
Source: StockCharts AAPL Apple Inc
Q3 2020 hedge fund letters, conferences and more
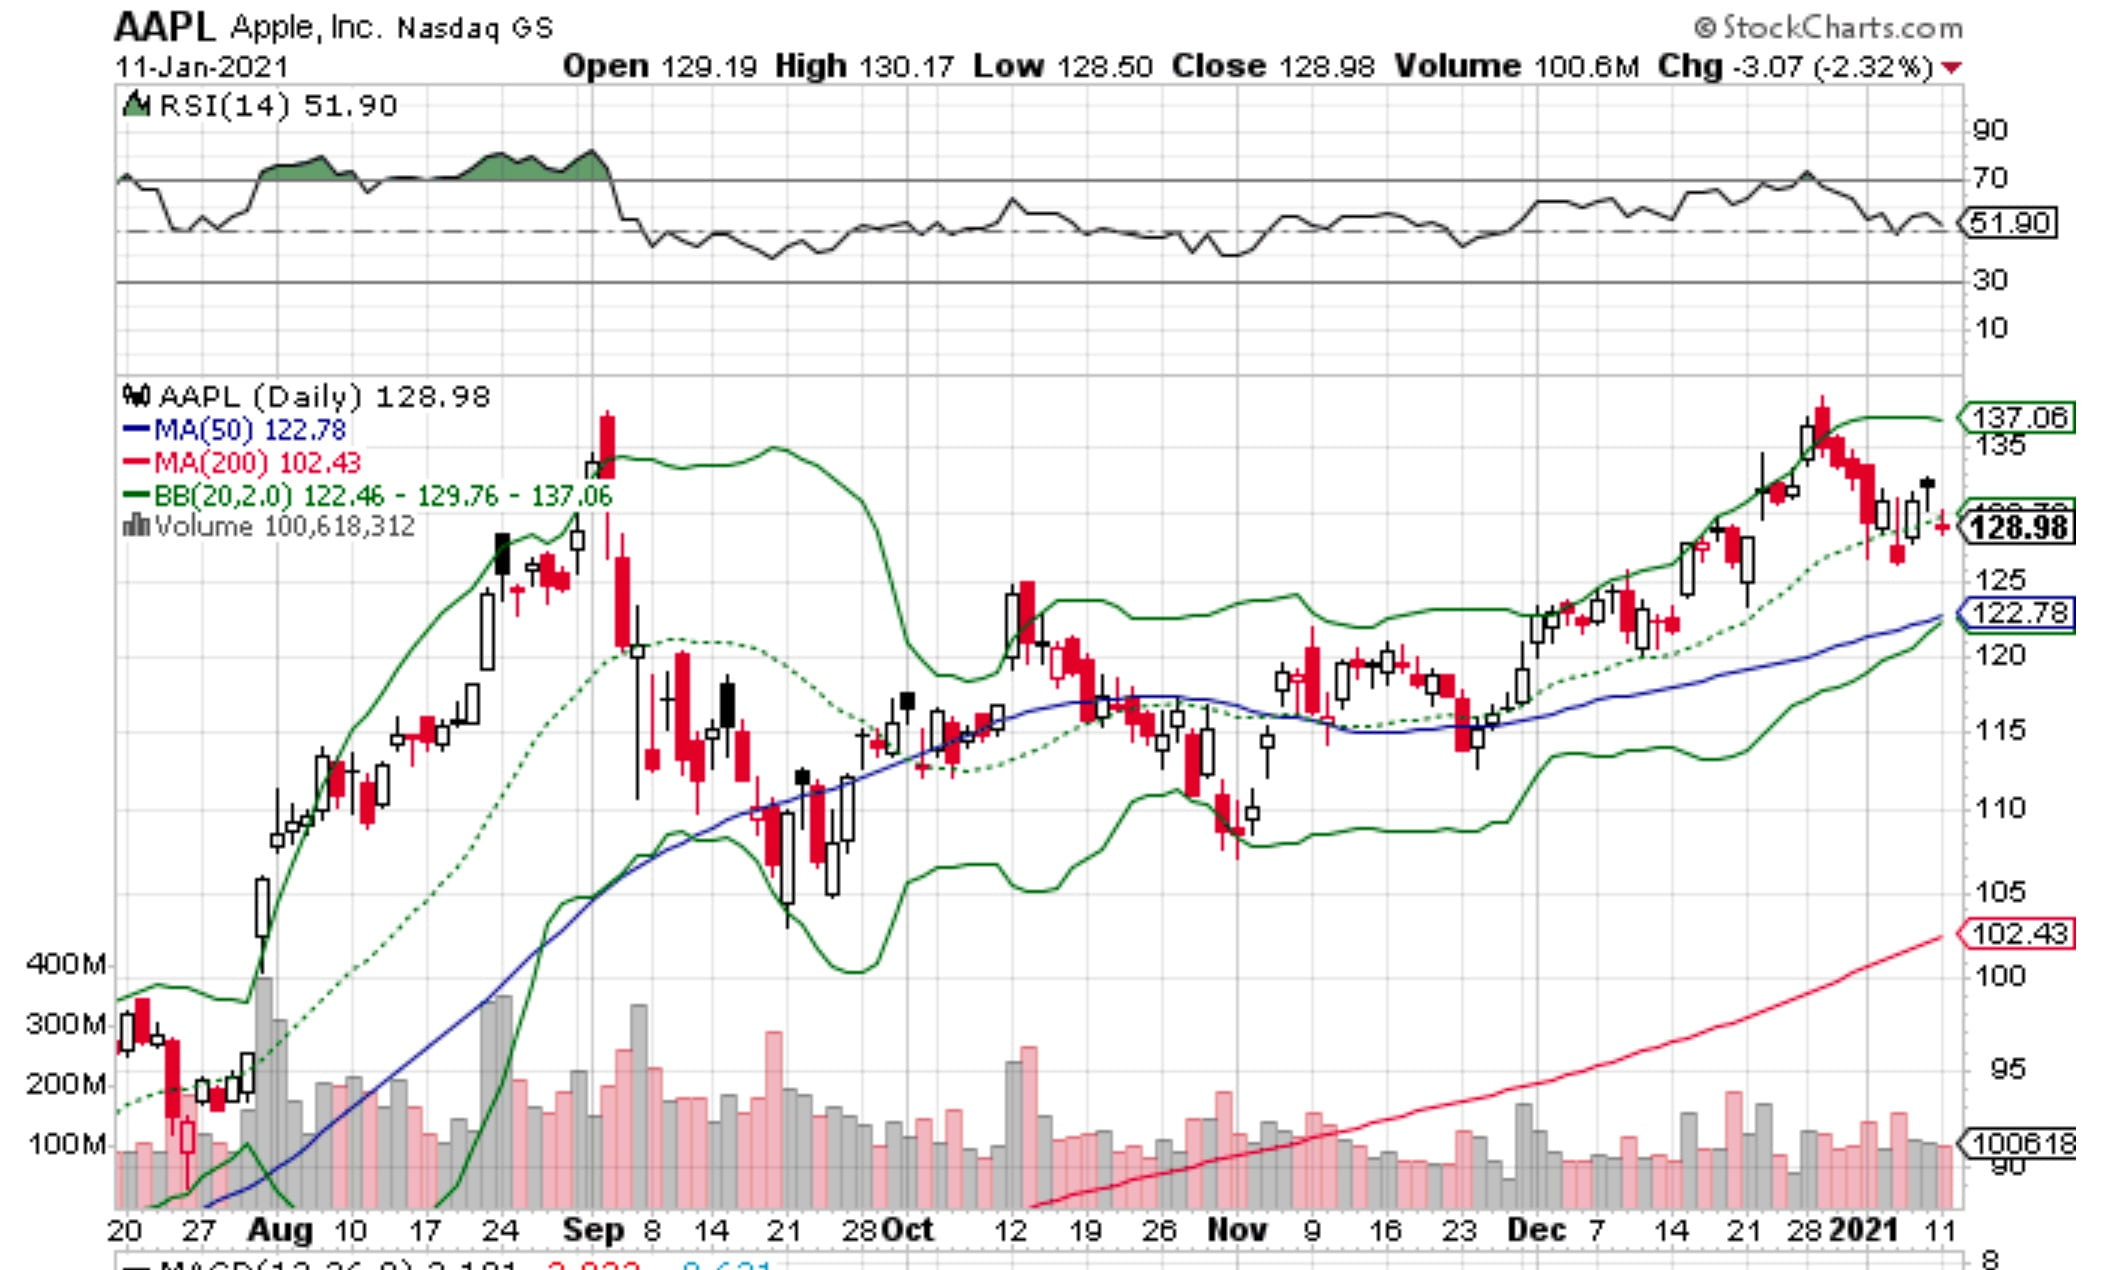
Apple Inc (NASDAQ:AAPL) has a market capitalization of $2.17 trillion [January 12, 2021], with a price of around $129. From an investment perspective, AAPL is regarded as a bullish stock, with a short-term positive performance outlook and a mid-term positive performance outlook. While it is deemed overvalued, with a price/earnings ratio of 39.32, the stock maintains an optimistic 1-year target estimate of $130.11, marginally higher than the spot price. As one of the top stocks to watch in January 2021, Apple Inc remains firmly on traders’ radars.
From a technical perspective, AAPL reflects positively. The 50-day moving average price is $122.78 (short-term moving average), and the 200-day moving average is $102.43 (long-term moving average). A clear bullish trend reflects with AAPL over time. This is bolstered by way of technical indicators such as Bollinger Bands. The upper Bollinger Band is $137.06, the median band is $129.76, and the lower Bollinger Band is $122.46. Given that Apple is dead-center, it is neither overbought nor oversold. There is still room for growth.
Notice that when Apple broke through the upper Bollinger Band ceiling in December, the price retraced sharply towards the median Bollinger Band. This is precisely why this technical indicator is such a powerful tool for anticipating price movements. Whenever a crossover occurs, a retracement invariably follows. Overbought stocks tend to sell-off as price equilibrium is restored. For Apple, 2021 is looking bullish. The company has overshot earnings expectations with earnings beats in Q4 2019, Q1 2020, Q2 2020, and Q3 2020. The company has a solid buy recommendation rating from analysts.
Expedia Group Inc (NASDAQ:EXPE) Opens Solidly in 2021
Source: StockCharts Expedia Group, Inc (NASDAQ: EXPE)
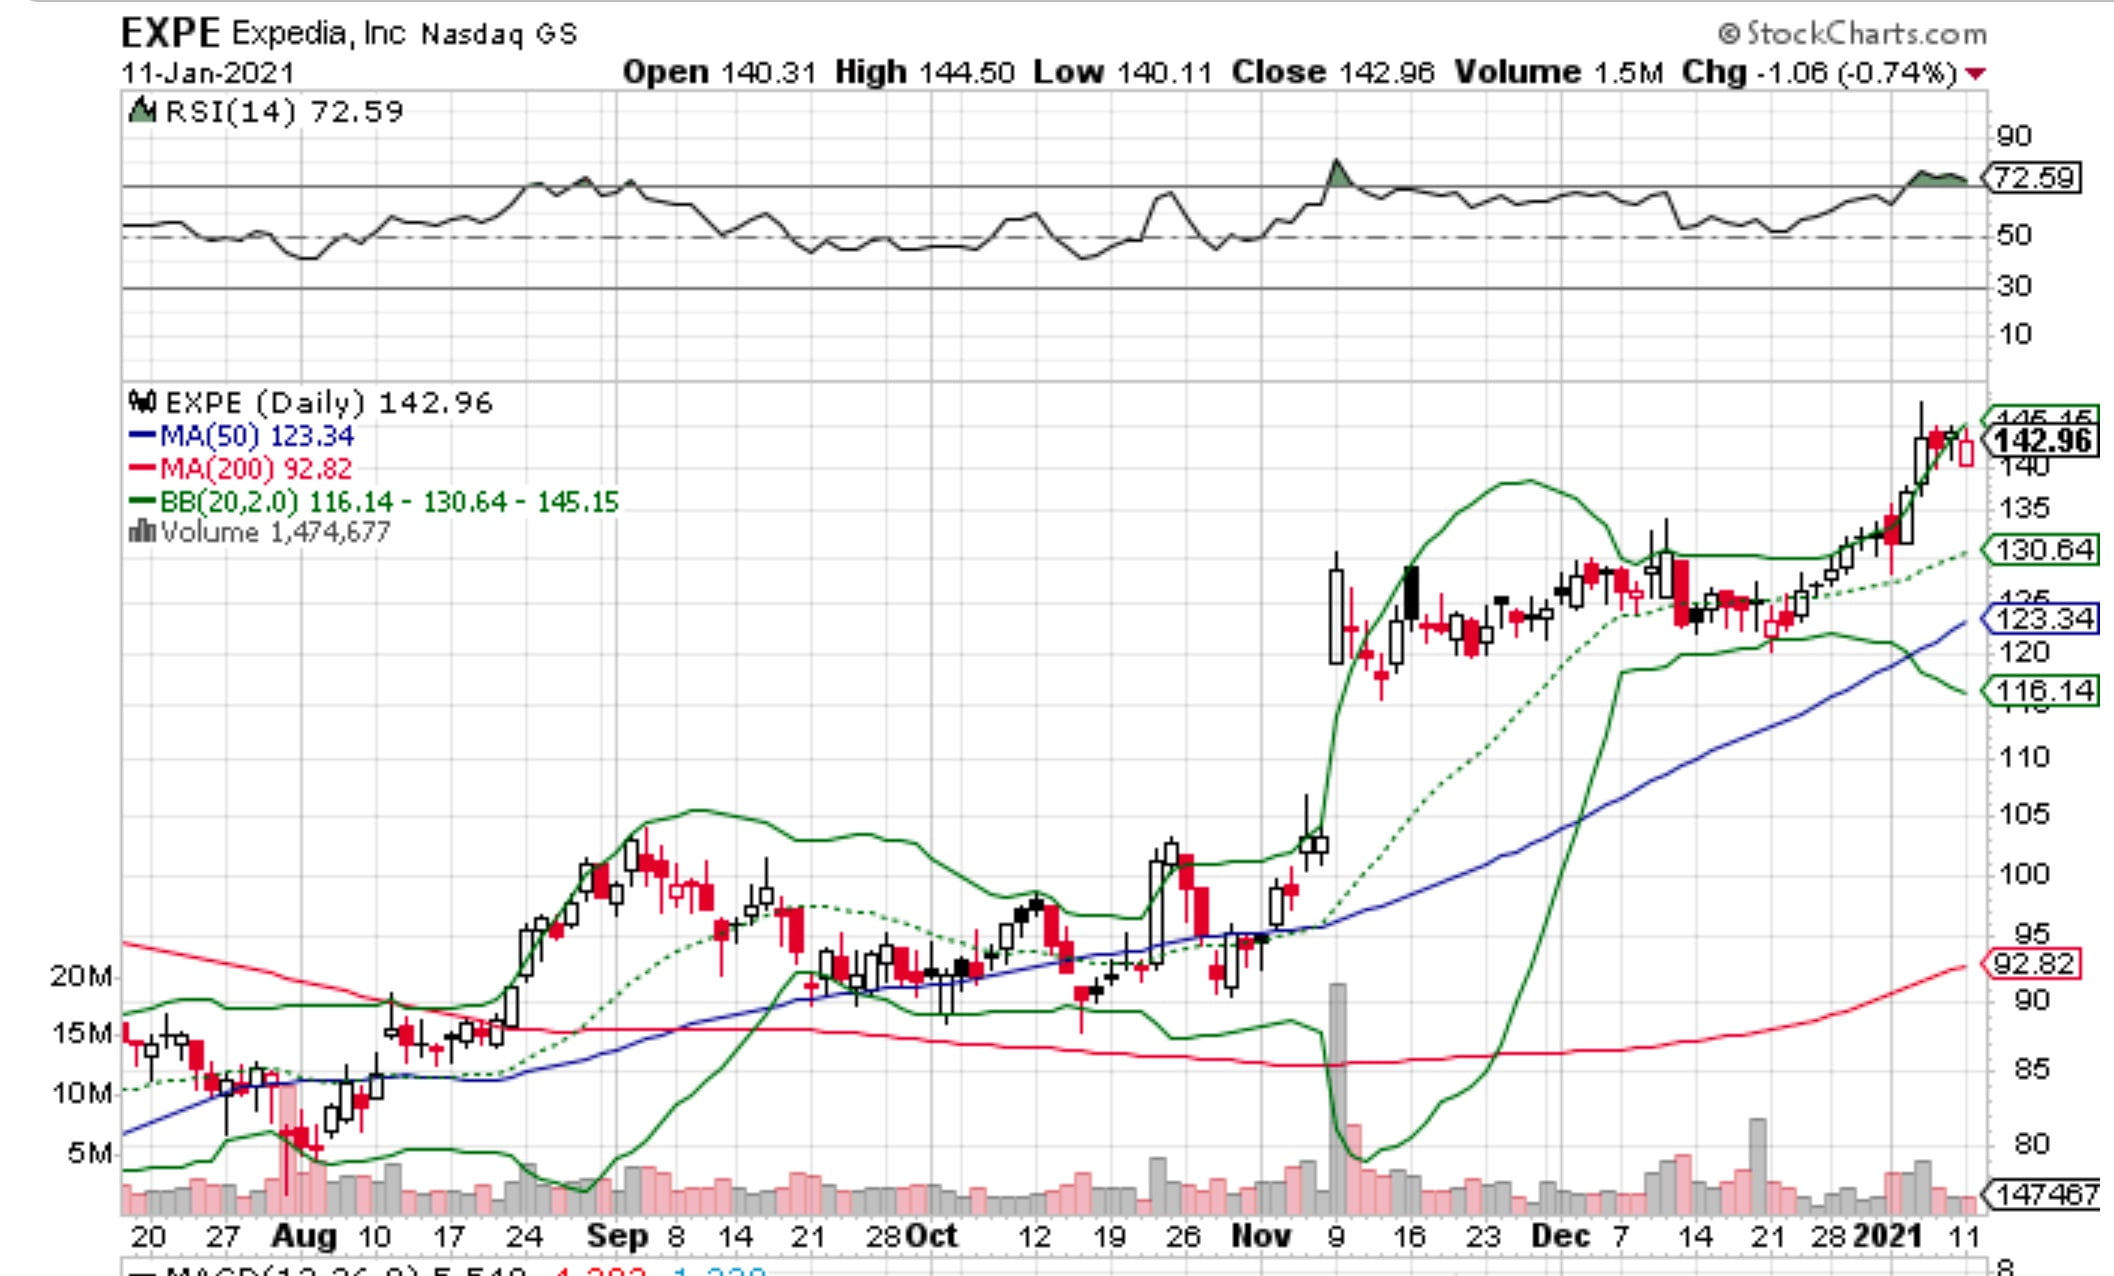
Expedia Inc (NASDAQ:EXPE) reflects all the right signals for traders in 2021. The spot price – $143 [January 12, 2021] is markedly higher than the short-term moving average price (50-day MA) of $123.34, and the long-term moving average price of $92.82. From a technical perspective, Expedia is well positioned to continue its bull run.
The Bollinger Bands indicate that there is still room for growth, although EXPE is fast approaching the upper BB limit of $145.15. The median BB is one of $30.64, and lower BB is $116.14. If EXPE continues to appreciate rapidly, it will invariably cross over the upper BB limit. When this happens, the stock tends to reverse as sellers take their cue from the technical indicators.
Presently, Expedia is regarded as overvalued. The stock has a short-term, mid-term, and long-term bullish performance outlook. This bodes well for traders and investors seeking to generate outsized returns on the stock. For 2021, the prognosis is positive, but the 1-year target estimate price is markedly lower at $122.34 (Yahoo! Finance analysts). In terms of consensus EPS and actual earnings, Expedia is largely hit and miss.
The company beat earnings forecasts in Q4 2019, but missed earnings forecasts in Q1 2020 and Q2 2020. More recently, Expedia beat consensus EPS in Q3 2020. It’s a mixed bag for sure. Yet, the recommendation ratings for this e-commerce giant remain bullish. On a scale of 1 (Strong buy) to 5 (Sell), Expedia weighs in at 2.6. Bank of America Securities recently upgraded their estimation of Expedia from neutral to buy.
Starbucks Corporation Will Perc Up Portfolios if it Continues to Rise
Source: StockCharts Starbucks (SBUX)
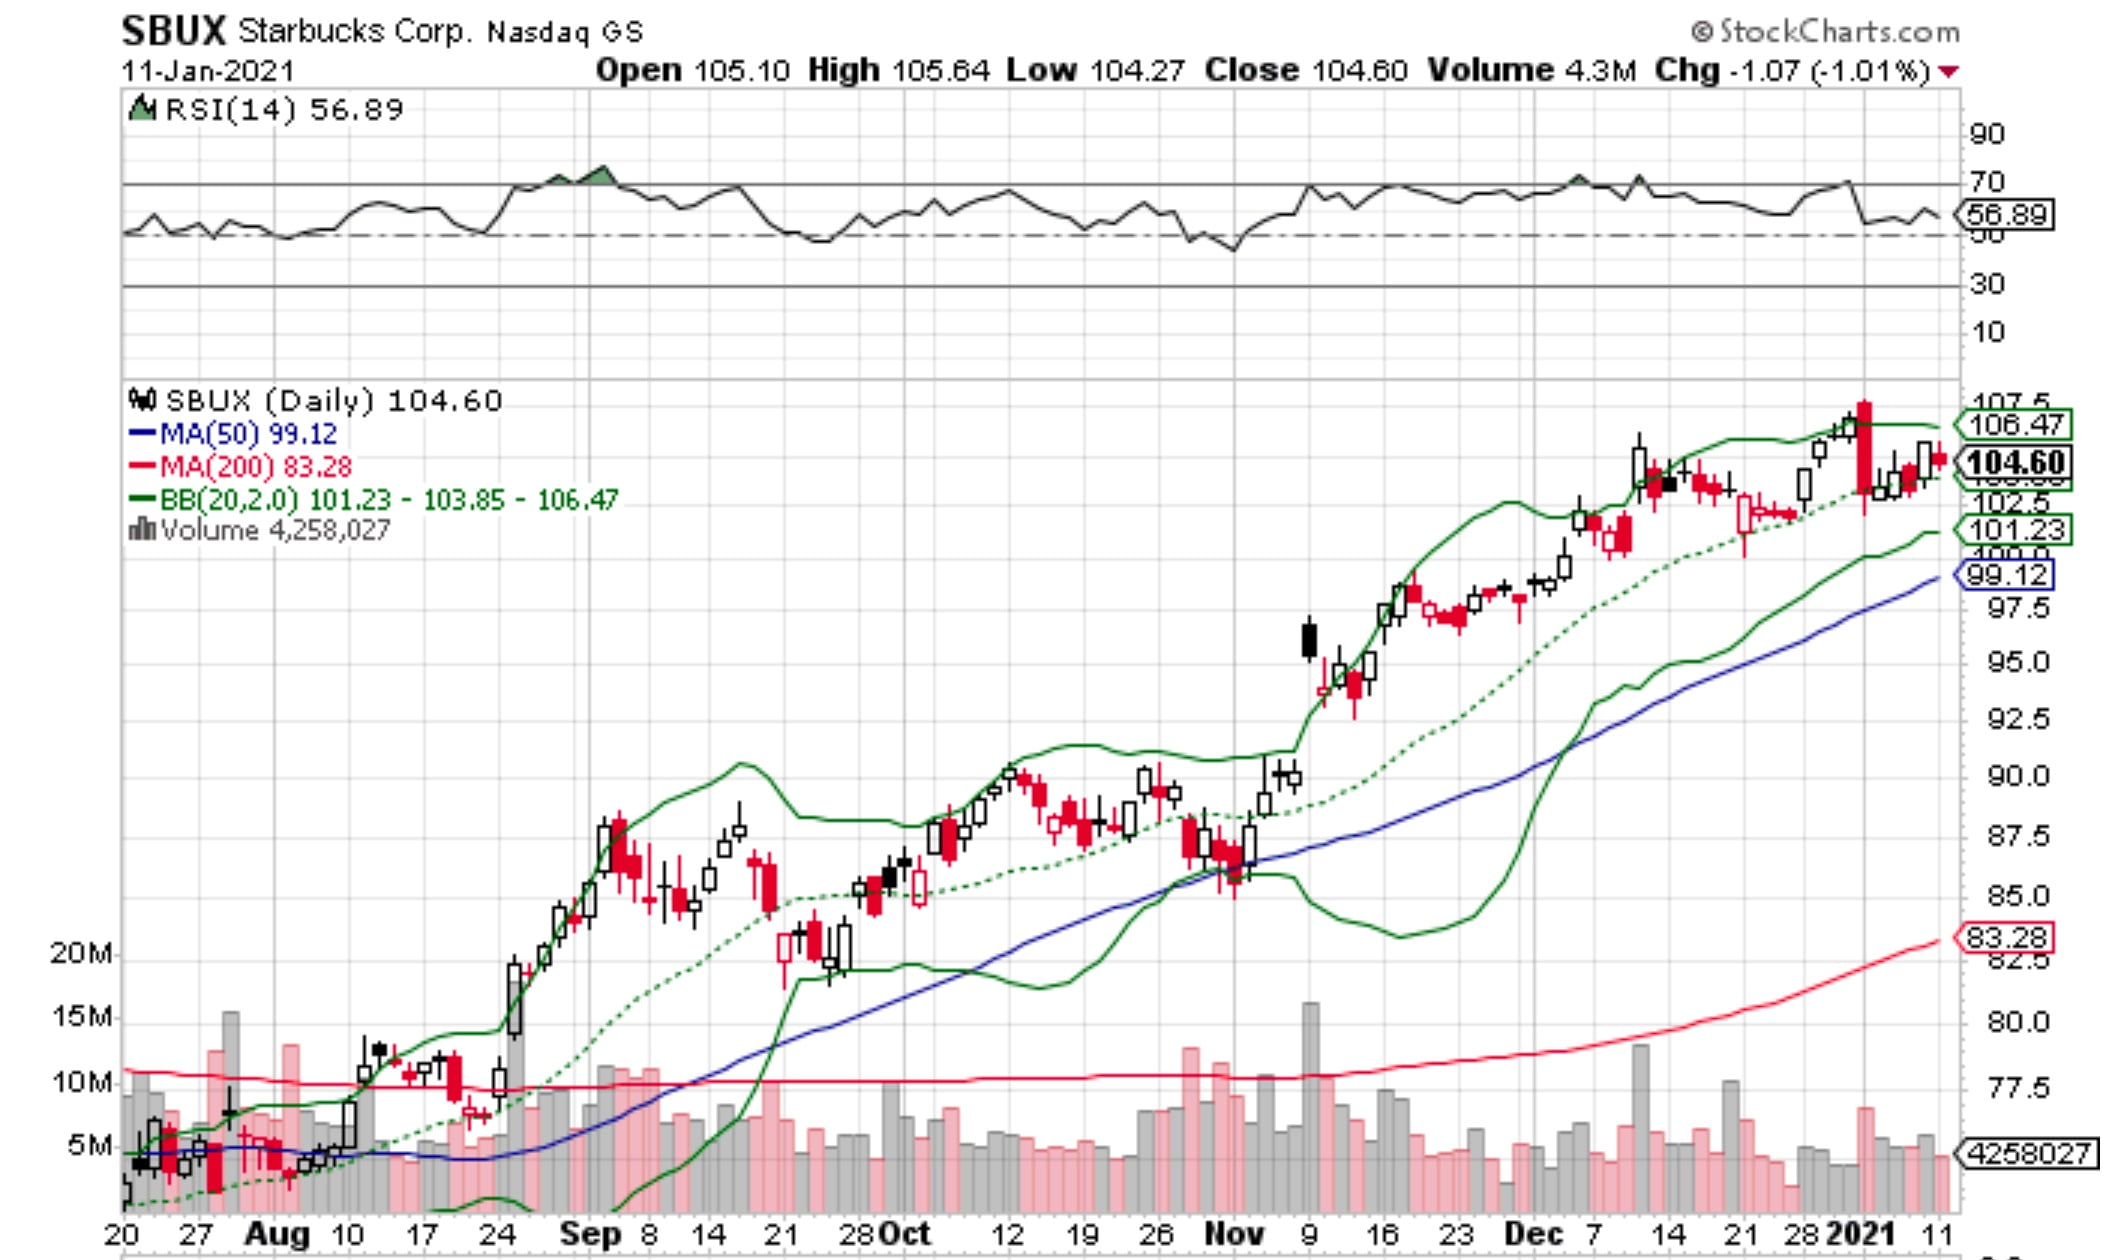
Starbucks Corporation (NASDAQ:SBUX) is now a three-digit stock, priced at $104.60 per share. This household favorite has steadily grown to become America’s favorite coffee franchise. Based on the analysis, SBUX is trending bullish. The 50-day moving average of $99.12 is higher than the 200-day moving average of $83.28. With the spot price hovering around $104.60, traders have reason to be excited about SBUX. While it is trading in a tight range vis-a-vis Bollinger Bands, SBUX is firmly between the median and upper Bollinger Bands. This means that price stabilization is likely as the Bollinger Bands tighten.
If SBUX continues rising, and breaks above the upper BB, a retracement is likely to occur at a lower equilibrium price point. For now, it appears that SBUX will stabilize over $100 per share which is good news for traders with an optimistic outlook on the stock. In terms of performance expectations, the short-term is bearish but the medium to long term is bullish. While SBUX is regarded as overvalued, the 1-year estimate price is $105.18 (Yahoo! Finance). This is marginally above the spot price. SBUX has been a mixed bag vis-a-vis earnings versus consensus EPS, hitting in Q4 2019, Q2 2020, and Q3 2020, but missing in Q1 2020.
As far as recommendation ratings go, SBUX is a solid buy, at 2.4, on a scale where 1 is a Strong Buy and 5 is a Sell. Despite its recent dip, SBUX has outperformed the retail wholesale sector’s loss of 0.4%. If the EPS is lower than expectations, this will likely put downward pressure on the stock, and allow traders to profit from short-selling SBUX ahead of earnings. An earnings beat would have the opposite effect for SBUX.


