
Mittleman Investment Management commentary for the fourth quarter ended December 31, 2018.
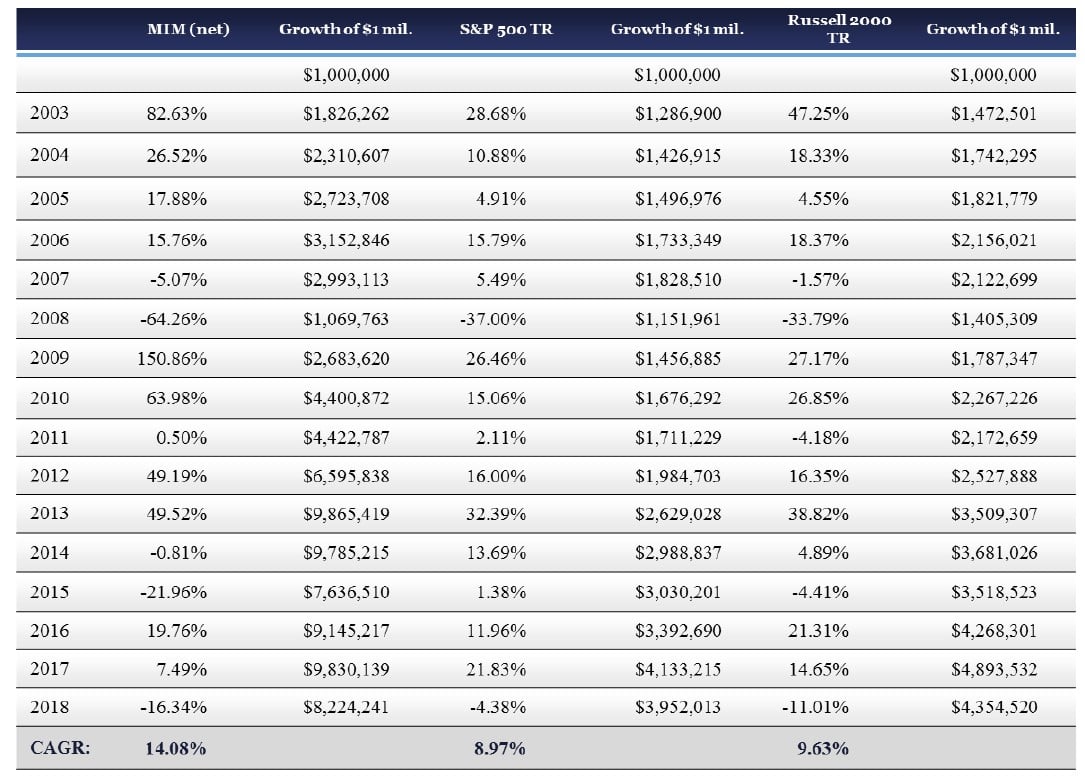
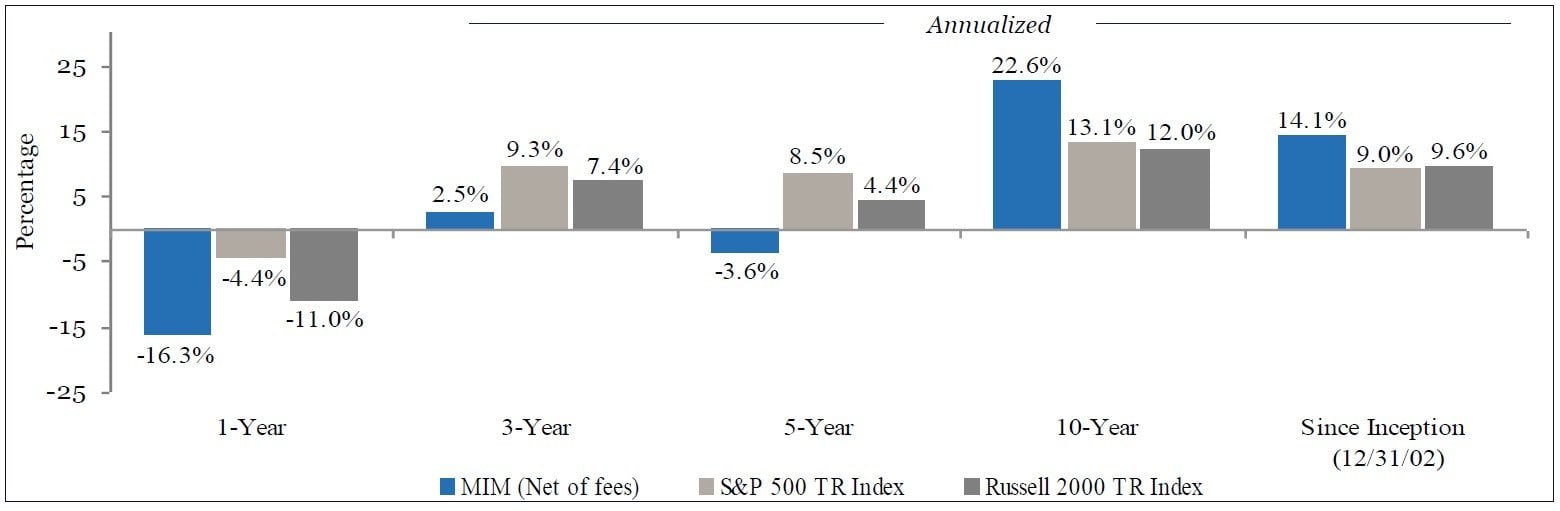
Mittleman Investment Management, LLC’s composite dropped 15.6% net of fees in the fourth quarter of 2018, versus losses of 13.5% in the S&P 500 Total Return Index and 20.2% in the Russell 2000 Total Return Index. Longer-term results for our composite through 12/31/18 are presented below:
“You make most of your money in a bear market. You just don’t know it at the time.” – Shelby C. Davis
Q4 hedge fund letters, conference, scoops etc
If the quote above holds true, given the decline that we’ve just endured, we should be about to make a lot of money. Shelby C. Davis began investing at age 38 with $50,000 that his wife gave him in 1947, growing it to $900M by the time he died at age 85 in 1994, a 23% CAGR over 47 years. Shelby earned the reward for endurance in investing, and that was to keep the powerful compounding machine going for as long as possible; long enough to make new highs after any draw-down.
And while our 16.3% decline in 2018 was a big step back, as shown below, in the only two prior years in which we endured a double-digit annual percentage decline in our composite performance, 2008 and 2015, both years were followed by double or triple-digit percentage gains in the immediately following year. The rubber band can snap back quickly.
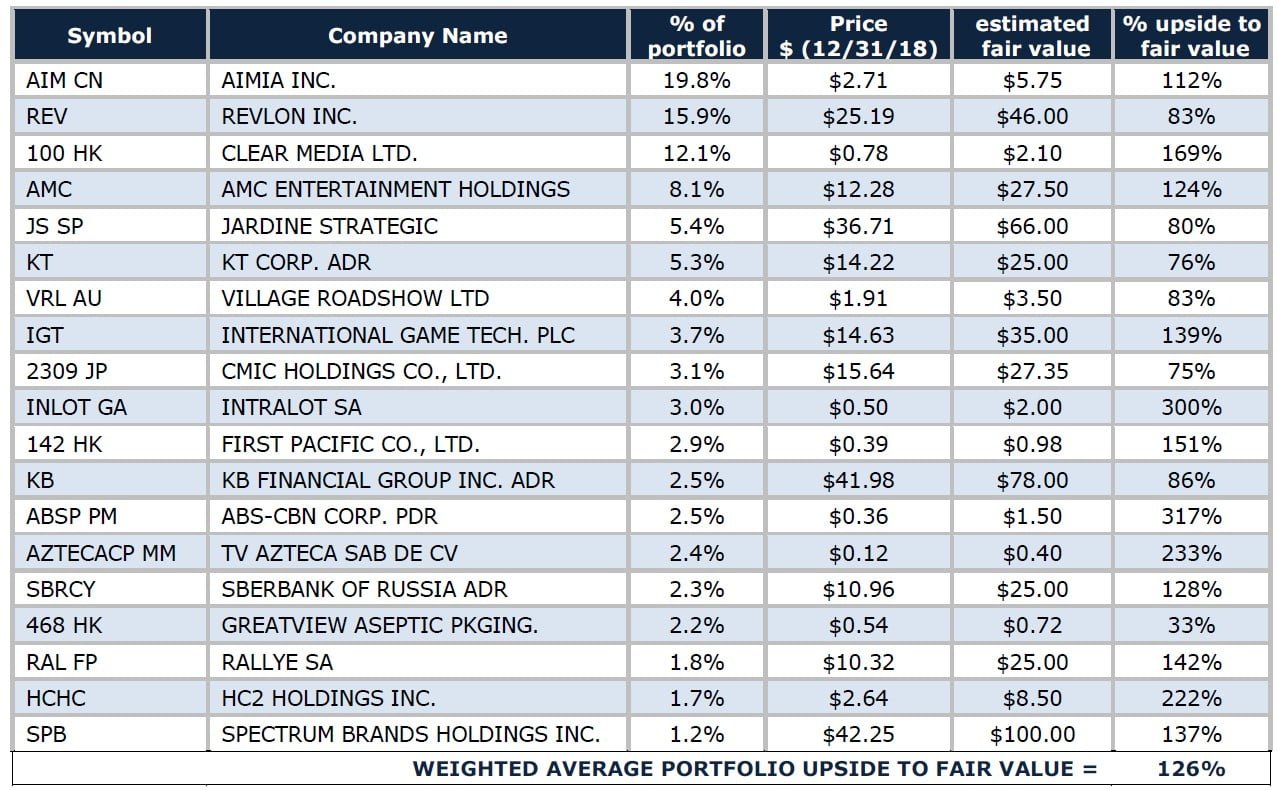
And snap back it should, given the deep level of undervaluation that we perceive in the portfolio, with a weighted average upside potential we estimate to be approximately 126% as of 12/31/18, versus 95% a year earlier. The investment thesis supporting our fair value appraisal for each of our holdings is summarized in our updated “What We Own, and Why” report which will be released separately in a few days to clients only.
Representative Holdings (excluding cash) as of 12/31/2018 (19 companies):
Our emerging markets exposure, roughly 40% of the portfolio on a look-through basis, weighed on our performance this year, with the MSCI Emerging Markets Index down -14.5% in 2018, and MSCI EM Small Cap Index down -18.6%. But, EM stocks held up much better in Q4 2018 than the major market averages, so that might indicate an inflection point is at hand. Our portfolio is built on bottom-up fundamental value, so our positions should not be misconstrued as bets on some hoped for macro-economic backdrop, interest rate, or currency moves. Just as we vastly out-performed the value indices over the past 10 years in which value stocks significantly under-performed the market averages, if EM continues under-performing for another 10 years we still expect to make a great return from what we own in those markets, which are hugely undervalued securities that we believe present much better risk/reward ratios than the index itself. The MSCI EM Index closed 2018 at 966, 28% below its high-water mark of 1,345 achieved just over 11 years ago in 2007; that we are finding bargains around there should not be a surprise. And while our premature embrace of those EM-related positions has been a major factor in our performance being -26.2% off from our high-water mark achieved August 30, 2014, about 4.33 years ago, we continue to believe that enduring the excess volatility to access those investments will ultimately pay off richly as those stocks are among the most undervalued that we have ever owned.
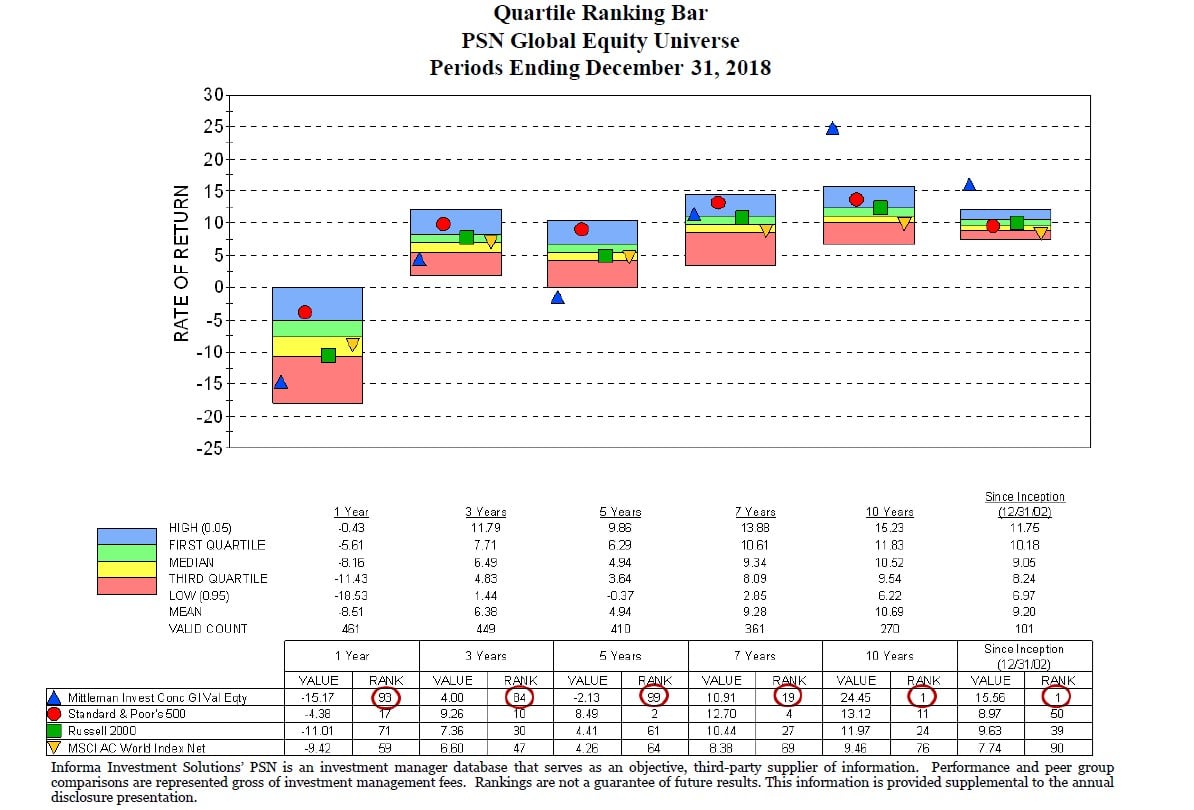
Perhaps another sign of a potential turning point is that during the last six months of 2018, our portfolio gained 0.6% on average, while the S&P 500 dropped 6.9% and the R2000 lost 17.4%. Thus, we actually weathered the extreme volatility of late 2018 pretty well. And while our trailing 5-year composite performance remains hideous and has us ranked in the 99th percentile of Informa Investment Solutions’ PSN Global Equity Universe for the 5-years ending 12/31/18, over 7 years we rank in the 19th percentile, and over both 10 years and 16 years (since inception) we are in the top 1 percentile of our peer group. Broadridge/Lipper rankings confirm similar standings.
There is a recency bias that seems to overpower even the most rational minds in attempting to determine the best path forward in investing. Someone viewing our results ten years ago on 12/31/08 would have recoiled in horror to see our trailing 5-year CAGR at -10.1% vs. -2.2% for the S&P 500 and -1% for the R2000 to that date. But the appropriate reflex on 12/31/08 should have been to salivate with greedy anticipation as over the ensuing ten years our CAGR was 22.6% vs. 13.1% for the S&P 500 and 12.0% for the R2000. So, beware that insidious instinct that sometimes allows mindless extrapolation to prevail over thoughtfully reasoned analysis. Our portfolio today, much like it was ten years ago, is full of extremely undervalued securities, most of which represent interests in enduring businesses that we view as recession-resistant, if not recession-proof, and are well-positioned to become much less undervalued in almost any macro-economic or market environment that may unfold from here.
Contributors/Detractors
The top three contributors to our Q4 2018 performance were Revlon Inc. (REV): $22.30 to $25.19 (+13%), Clear Media (100 HK): $0.74 to $0.78 (+5.4%), and Village Roadshow (VRL AU): $1.80 to $1.91 (+6.1%).
Revlon (REV), reported slightly better than expected Q3 results on Nov. 9, 2018 and given the low expectations the stock jumped on the news from $21.80 to as high as $29.62 (+36%) before sliding back to close the quarter at $25.19. Chairman and controlling (85.8%) shareholder, Ronald Perelman, bought another 346,191 shares of Revlon in the open market in Q4, at prices ranging from $22.61 to $25.15, all bought in the month of December. That’s in addition to the 428,943 shares he bought in Q3 from August 9th to September 25th at prices ranging from $15.18 to $21.50. A standstill agreement, initiated at our prodding on 9/15/17, and extended on 9/15/18 for another year, precludes Perelman’s holding company, MacAndrews & Forbes, from attaining the 90% ownership threshold needed to execute a short-form merger (no shareholder vote) with Revlon without advance notice and the formation of a special committee to negotiate any such potential offer. We have no illusions that this meager protection would stop Perelman from trying to buy out minority shareholders at an unfair price if the stock dips meaningfully again and he wanted to do that. But, for now we assume that the substantial insider buys are simply the informed opportunistic purchases of a shareholder who should have some sense of how the business is going and what its fair value is likely to be. We see fair value as no less than 2x sales, which we presume will be flat in 2019 vs. 2018 at $2.58B, and a still well-below normal but much improved EBITDA margin of 13.5% resulting in $350M in EBITDA and $100M in free cash flow, and an EV/EBITDA multiple of 15x, which produces a share price of $46, up 83% from the 12/31/18 closing price of $25.19.
There was noticeably improved shelf space for Revlon and their Almay brand in Q4 at fast growing specialty retailer Ulta, which is unusual in that for the first time that I can recall, Revlon and Almay have a combined square footage which exceeded Maybelline and Cover Girl, and with more visible positioning. I’m not sure how long that is sustainable but combined with the good flow of new product launches, hopefully the year-end results due out in early or mid-March will show signs of further improvement. Revlon’s prestige business, Elizabeth Arden (20% of sales), has been very strong, +16.5% in sales in Q3, offsetting the ongoing weakness in the mass market (Revlon and Almay). But if an economic slowdown is on the horizon, value-priced mass market brands like Revlon should reclaim some market share. Regardless, at long last Revlon seems to be getting innovative new products into the high growth sales channels (online (Amazon) & specialty stores (Ulta)) with more relevant marketing online (social media influencers) and at the point of sale (brighter more engaging displays).
Our second biggest contributor to performance in Q4 was Clear Media (100 HK), one of the largest outdoor advertising firms in China. Clear Media had some troubles in 2018, which bring to mind some classic Warren Buffett quotes:
- “I never attempt to make money on the stock market. I buy on the assumption that they could close the market the next day and not reopen it for five ”
- “Only buy something that you’d be perfectly happy to hold if the market shut down for 10 ”
- “If you aren’t willing to own a stock for ten years, don’t even think about owning it for ten ”
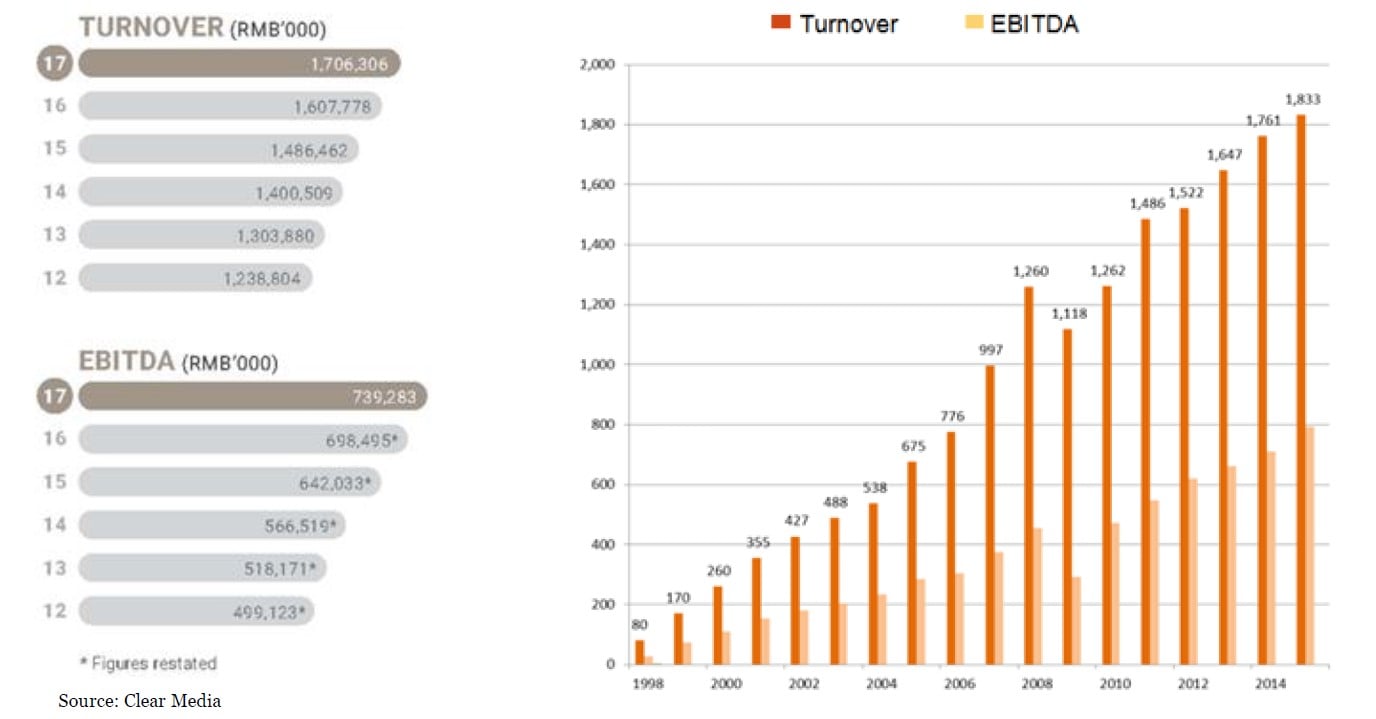
We’ve owned Clear Media with that mindset for just over six years now and have enjoyed just over a 16% CAGR during that time frame (Nov. 2012 to Dec. 2018). But, as I mentioned in my Q1 2018 review letter, Clear Media’s stock was halted by the Hong Kong Stock Exchange after March 30, 2018. It did not open again until November 19, 2018, so while not the 5 or 10-year trading hiatus that Buffett contemplated, it was a bit inconvenient and disconcerting. The trading halt was necessitated by the lack of a clean opinion from their auditor and to allow the exchange to investigate and demand remedies for internal control failings at Clear Media that allowed a theft of HKD 77M (USD 10M) from the company’s bank accounts, most of which occurred in 2010 and was an inside job, but not discovered and reported until January 2, 2018. The stock dropped 24% in Q1 2018 on that news. After the company reinforced its internal controls to the satisfaction of the exchange, and their auditor, Ernst & Young, gave them a clean opinion, trading resumed on November 19th and the stock price predictably plunged. Part of the reason for the drop was that just before trading resumed the company gave an intra-quarter update on sales which showed October sales down 25% year-on-year, an unusually bad result that undoubtedly is a symptom of the slow-down in the Chinese economy. We know it’s a cyclical business and are comfortable with that aspect of it. On an annual basis, this business has only had one down year in sales, which was 2009, an 11.3% drop, which was understandable given the macro backdrop of that time. The company still produced abundant FCF during that period. The following snap-shot from an older Clear Media presentation goes from 1998 to 2015, but then the bar chart to the left of it shows the restated numbers since 2012 through 2017. It’s all useful because it shows the longer-term growth story. 2018 looked to be headed for another record until the revelation of the sharp reversal in October sales called that into question.
Clear Media (100 HK) Sales (Turnover) and EBITDA 1998 – 2017:
Given the gains in sales already booked YTD, +12.4% in first half, +9.5% in Q3, even if the entire Q4 was -25% as was October, that would take full-year sales down to about an unchanged / flat sales number for the entire year versus 2017. But it’s unlikely that Q4 will develop like that, as what usually happens during periods of heightened economic uncertainty in this business is customers hold off on buying until the last minute, especially since many ad budgets are “use it or lose it” by year- end. For example, there was a bout of significant weakness in 1st half 2016, with sales down 12.5% for the entire half as China was slowing down then and there was a general fear about global growth resulting in ad buyers holding back, but for the full year 2016 the sales growth was +8.2%. So, I wouldn’t extrapolate too much from any one month, or even any one six-month period in this business, it can be very lumpy, but the long-term trajectory and FCF generation has been very good.
We took advantage of the brief panic and forced selling on Nov. 19th and 20th by buying about 7M shares, increasing our stake from just over 5% to 6.2% of the shares outstanding, making us the 3rd largest shareholder, behind International Value Advisors with 16.9%, and the largest U.S. billboard company, Clear Channel Outdoor (CCO) with a 50.4% stake. Despite the uptick in stock price in Q4, Clear Media was still down 19% for the year. That said, the stock has provided a very good total return of about 150% since we started buying it in early November 2012 at HKD 4.00 (USD 0.52), with most of the return provided by cash dividends paid out over those six years that we’ve held it, providing just over a 16% CAGR. The stock closed the year at HKD 6.11 (USD 0.78) which is a valuation of just over 3x EBITDA, in an industry where major players almost never trade for less than 10x EBITDA, and most of those are highly leveraged entities, whereas Clear Media has a net cash balance sheet.
Since we started buying Clear Media in November 2012 at HKD 4.00 (USD 0.52), a market cap. of USD 282M, the company has paid out USD 241.5M in cash dividends over those 6+ years. That is 86% of its initial market capitalization at our entry point. We have no other company in the portfolio that has been so good about returning cash to shareholders over the past six years. And I can imagine maybe only a handful of companies in the U.S. that have returned so much of their market cap. in cash dividends to shareholders over the past six years. Any lingering concerns investors may have about the veracity of the numbers here, due to the recent scandal, should be quelled by that history.
Lastly, there has been some encouraging private market transactions in this space recently. In November 2018 the largest outdoor advertising firm in the world, JCDecaux SA (DEC FP), itself trading about 10x EBITDA, closed on its cash buyout of its much smaller rival in Australia, APN Outdoor (APO AU) for which it paid 11x EBITDA (AUD 1.167B EV / AUD 103M EBITDA est. for 2019). Meanwhile APN has a lower EBITDA margin (27%) than Clear Media (42%) and it is unlikely to have better long-term growth prospects, given where consumer spending (and associated ad spend) is in Australia vs. China. And Focus Media (002027 CH), a much larger firm in China that handles indoor / in-building flat screens for advertisers saw Chinese giant Alibaba take a 6.6% stake for CNY 10.00 per share in July 2018 which was about 18x EBITDA, while the stock today is CNY 5.78, about 10.4x EBITDA. Focus Media would be a logical buyer for Clear Media if Focus Media decided they wanted to expand their network beyond their in-building offerings to the outdoor space. And Clear Media’s controlling shareholder, U.S.-based Clear Channel Outdoor (CCO) is highly leveraged and their parent company, iHeartMedia Inc., is just now emerging from bankruptcy, and will spin-off their 90% stake in CCO to creditors, garnering CCO complete independence. Given that CCO will remain highly leveraged (8.25x net debt / EBITDA) it would seem reasonable to imagine they might like to liquidate their 50.4% stake in Clear Media, which at my estimate of fair value at 10x EBITDA would be worth USD 546M to CCO, a sizable paydown of CCO’s more than USD 5B in net debt. And at 10x EBITDA (est. USD 105M for 2019, assumed down from TTM USD 116M as of 06/30/18 on China slow down) then Clear Media would be USD 2.10 per share, up +169% from the 12/31/18 closing price of USD 0.78 per share, not including the sizable cash dividend payments that we expect will continue to be forthcoming.
Regarding the macro-economic concerns about slowing Chinese economic growth, I addressed that valid issue in my 2015 year-end review letter with the following analogy: “In Japan, GDP grew 10.2% per year on average from 1961 to 1970, and the stock market there gained 8.2% annually during those years. From 1971 to 1980 Japan’s GDP growth slowed dramatically to an average of 4.5% per year, but stocks gained 15.9% per year in that slower growth time-frame. And the Japanese Yen, rather than weaken on the slower growth rate, strengthened dramatically during the 1970s, from JPY/USD 360 to 240, a 50% gain against the USD, despite the much slower growth rate, and despite Japan being a huge importer of oil during a time of rising oil prices. So, despite a GDP growth rate that was less than half of what it was in the prior decade, stock market returns nearly doubled the rate of the prior decade, and the currency gained 50%.” I then acknowledged, as I do now, that China is a much different situation, with much more debt as a percentage of GDP than Japan had in the 1970s, and an over-extended banking industry. Thus, the GDP growth slowdown apparently underway in China may not be such an easy transition for their stock market or currency as Japan experienced from the 1960s to the 1970s. Still, it need not be cataclysmic. China has more debt than Japan had when it was still a fast-growing economy, but China’s savings rate has averaged 33.5% over the past 25 years, while Japan’s savings rate averaged 10% from 1960 to 1980. If China’s policy makers can prod their consumers to spend a little more and save a little less, consumer spending as a percent of GDP will continue to grow there, and ad spending tends to chase consumer spending, so Clear Media, at 3x EBITDA, with a net cash balance sheet, is well positioned for almost any macro-economic future that unfolds in China over the years to come. Shelby Davis made immense returns buying Japanese stocks cheaply in the 1960s and 70s, as did John Templeton. It seemed too good to be true, significant Japanese businesses with decades of growth ahead of them at 3x to 6x earnings, while U.S stocks were at 16x. And yet it was there for the taking, for many years, while most investors shunned the opportunity. We see a very similar valuation disconnect today in not only Clear Media but throughout our holdings in Asia and most of our other non-U.S. holdings as well.
And not too far from Asia, our 3rd biggest contributor in Q4 was Village Roadshow (VRL AU), an entertainment conglomerate focused on theme parks and movie theaters, primarily in Australia. We last wrote about Village Roadshow in our Q2 2018 review letter, when it was one of the noted detractors. The fatal accident which occurred in October 2016 at their competitor’s park, Dreamworld (owned by Ardent Leisure (ALG AU)), located essentially across the street from Village Roadshow’s main theme parks, has depressed theme park attendance throughout the Gold Coast region more severely and for a longer period of time than I anticipated when we first bought Village Roadshow in Q1 2017. I had looked at other incidents in history where someone was sickened or killed by a company’s product or services, and it generally has taken about one year for people to get over it and return to normal buying behavior. For example, when Johnson & Johnson’s pain killer Tylenol was sabotaged and laced with poison, killing seven people in September 1982, Tylenol quickly saw its market share plummet from 37% to 7%, but it had rebounded to 30% by September 1983 after it had changed to tamper-resistant packaging. But over two years have passed since the incident at Dreamworld and only very recently has demand started to normalize, thus the upward movement in the share price of late. Also, there was some drama at their annual shareholder meeting in December that lifted the stock price towards year-end when the Deputy Chairman of the Board, John Kirby, 71, brother of Executive Chairman Robert Kirby, 67, (each one-third owners in the private entity which owns a 42% stake in Village Roadshow, with CEO Graham Burke, 77, owning the remaining third) hired a well-known investment banker and lawyer to campaign for the removal of his brother as Executive Chair and the removal of CEO, Graham Burke, who has been CEO for 30 years. John Kirby wants to see non-core assets sold and cost cutting. My fair value estimate is A$4.86 (USD 3.50) which is 9x EBITDA (using A$135M vs. A$142M used by JP Morgan analyst) and 83% higher than the year-end price of USD 1.91. My 9x EBITDA multiple is reasonable because their closest peer in Australian theme parks is Ardent Leisure (ALG AU A$1.46) which owns the Dreamworld property that had the terrible accident in 2016, is at 8.7x EBITDA today in the open market, with no control premium, and major theme park operators like Six Flags (SIX $60.80) trade at 13x EBITDA, Merlin Entertainment (Legoland) (MERL LN GBp 332) at 9x, Cedar Fair (FUN $55.15) at 9.4x, and SeaWorld Entertainment (SEAS $26.44) at 9x. And the last major movie theater acquisition was Cineworld (CINE LN) buying Regal Entertainment (RGC) in the U.S. for 9x EBITDA. So, if this recent bout of activism by an insider against his own brother and other fellow directors is successful it should increase the odds that Village Roadshow reaches fair value sooner than later. The background and details on John Kirby’s activism with Village Roadshow, for those who care to delve into it further, are well summarized in this article in The Sydney Morning Herald.
The top three detractors to our Q4 2018 performance were AMC Entertainment (AMC): $20.50 to $12.28 (-39% with dividend), Aimia Inc. (AIM CN): $3.50 to $2.71 (-23%), and HC2 Holdings (HCHC): $6.12 to $2.64 (-57%). HC2’s smaller portfolio weighting made its larger percentage loss less impactful.
While AMC Entertainment (AMC) was our biggest loser in Q4, -39% total return, it had just been up 40% with dividends in Q3 as the market celebrated a strong box office and a $600M investment by Silver Lake Partners (private equity) into a newly issued AMC convertible preferred stock, convertible at $18.95 per share. Box office results (U.S. & Canada) closed 2018 at an all-time high of $11.858B, up 6.9% on 2017’s performance of $11.091B, and attendance rose, too, up 5.3% from 1.236B to 1.301B tickets, marking the 2nd year out of the past 4 years in which attendance increased. Not bad for an industry the short- sellers would have you believe is in inexorable decline. So why did the stock tank again in Q4 if everything is so great? The panic-point du jour is that AMC’s new subscription pricing offering will cannibalize what would have been regular full priced ticket sales, and thus a strong box office will be wasted on them. If it does prove out that this experiment with subscription plan pricing does not work for AMC, they can change it (Cinemark has a more limited subscription option that is less risky but also less appealing to the customer) or dump it and go back to exclusively selling regular tickets. It is not going to kill the business if they tried something new in the pricing department and they ended up abandoning it due to a poor outcome. Netflix’s stock dropped from $43.50 to $9 in late 2011 after they announced they would split the company in two, with DVD-by-mail service to be called “Qwikster” and Netflix keeping the online streaming business. Then they saw that customers and the market hated the idea, so they reversed course. AMC is quite capable of changing or cancelling a less than ideal pricing plan if they deem it necessary. A delay in IPOing their European division until the 2nd half of 2019 also likely weighed on AMC’s stock price in Q4, but we don’t take that delay as immensely disappointing given the likelihood that the longer they wait to IPO those European theaters, the more valuable they will have become in the interim, due to AMC’s rapid renovation schedule applied to what had been an under-managed asset base during prior ownership as Odeon-UCI was owned by Guy Hand’s Terra Firma private equity fund, and they ran it for cash for more than 10 years, didn’t reinvest / refurbish theaters as they should have. The result was a very low EBITDA margin of around 12% when AMC bought Odeon-UCI in November 2016 which AMC should be able to massively improve upon over the next few years. AMC’s own EBITDA margin has been running around 16.5% over the past few years, with room for improvement. Cineworld (CINE LN) which was primarily a UK operator before buying Regal in the U.S. last year, has regularly run at a 22% EBITDA margin. So the Odeon-UCI business AMC bought really should see dramatic improvement in profitability over the next few years. That said, we lowered our fair value price target on AMC from $32 to $27.50 on a slight reduction in expected EBITDA for 2019, from $950M to $920M, and the dilutive effect of the $600M convertible preferred stock issued to Silver Lake Partners at an $18.95 conversion price. $27.50 is 124% higher than the year-end closing price of $12.28 and would be 9x EBITDA, the multiple at which Regal was bought out by Cineworld last year, and 12x FCF of $310M. AMC’s dividend yield was 6.5% on its $12.28 stock price as of 12/31/18 and would be 2.9% at our target price of $27.50.
Our 2nd biggest detractor from performance in Q4, Aimia Inc. (AIM CN) -23%, was also up big in Q3, +99%. On January 10, 2019 Aimia Inc. completed the sale of Aimia Canada Inc. (owner of Aeroplan) to Air Canada for the agreed upon C$450M plus C$47M in working capital adjustments in Aimia’s favor, for total proceeds of C$497M. No taxes owed as Aimia had an estimated C$1.1B cost basis in Aimia Canada Inc. for tax purposes, meaning the sale should generate a roughly C$650M capital loss which Aimia Inc. can carry forward and utilize against future realized capital gains. The company also has approximately US$150M in NOLs which reside in a U.S. subsidiary.
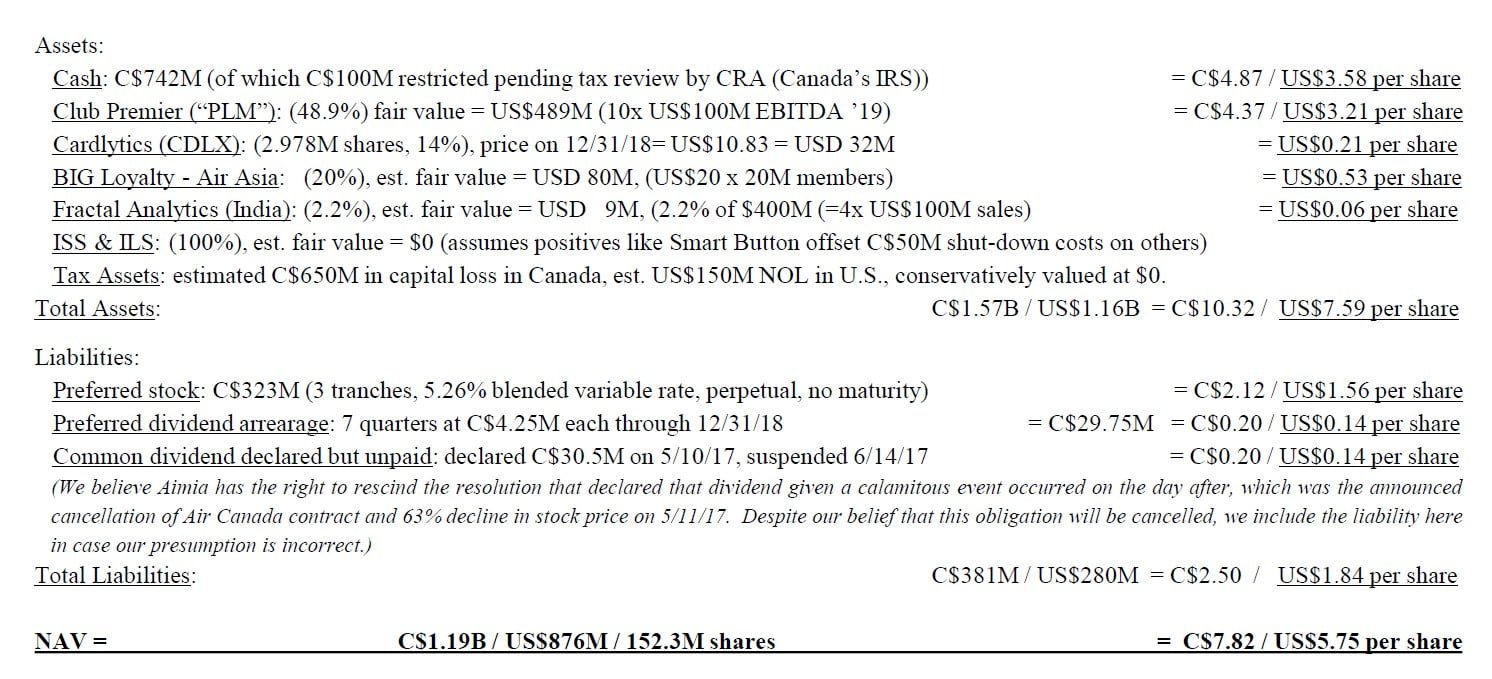
Our NAV estimate for Aimia is now C$7.82 (US$5.75), which is 112% higher than 12/31/18 price of C$3.69 (US$2.71), with no value given for tax assets, and no control premium, using exchange rate of CAD/USD 1.36 as of 12/31/18:
PLM has 5.7M members in a fast-growing coalition loyalty program anchored by Aeroméxico, Mexico’s flagship airline. Aimia invested US$124M between 2010-2012 for 48.9% stake; since then received about US$100M in cash dividends. Last financing round 2012, EV set at US$518M (14.8x EBITDA, but Aimia got previously agreed 15% discount, US$440M, 12.6x EBITDA); big growth since then, and prospects very good for more of the same as Mexican population is very young (median age 28) with low penetration of credit cards and air travel, and low household debt to GDP (15%). Again out of conservatism, our valuation of PLM ignores its net cash balance sheet which we believe exceeds US$100M.
(CAD/USD = 1.36 on 12/31/18) (No deduction for C$100M restricted cash as we believe it will be fully available within two years. In 2013 CRA (Canada’s IRS) pursued similar claim (C$54M +C$24M interest & penalties) based on 2008 tax year and Aimia prevailed in 2015, owing nothing. C$100M is likely 2x the worst case outcome.)
As I mentioned in our Q3 review letter, we have submitted proposals to Aimia’s Board with our best ideas for maximizing the value of Aimia’s substantial assets for the benefit of all stakeholders, and we believe it is imperative that Aimia move quickly to decide on a plan. But if the debate is ongoing, hopefully a significant share buy-back can be implemented in the interim, because with the stock so cheap versus NAV, any such purchases, even up to C$5.00 per share, would be immediately accretive to NAV per share. And we have conveyed that urgent recommendation to Aimia’s Board, as well, along with our other ideas.
Mittleman Brothers controls nearly an 18.6% stake in Aimia, and with a couple of seats on the Board, we hope to have substantial influence on the mission-critical capital allocation decisions that the company faces now that Aeroplan has been sold. However, given that we signed a standstill agreement with Aimia in exchange for our two board seats, if Aimia’s Board decides on a plan with which we do not agree, there may be little we can do until our standstill agreement expires on July 1, 2019. And while we wait with all Aimia shareholders to hear their decision, we will continue to try to further inform the Board as to the merits of our plan for Aimia’s future. Our overarching goal here is to make sure that any plan put forth embraces only transactions that are obviously accretive to NAV per share, and avoids doing anything that might be dilutive to NAV per share. We hope such basic parameters for a go-forward strategy would be agreeable to any and all shareholders.
The third most impactful detractor from our Q4 2018 performance was HC2 Holdings (HCHC), -57%, but with a smaller portfolio weighting mitigating the impact. HC2 is an investment vehicle run by Phil Falcone, with whom we’ve had success investing alongside in Playtex Products Inc. (PYX) and Harbinger Group (HRG). Simply put, HC2 bungled a refinancing by letting it get a little too close to the maturity date and trying to squeeze in one acquisition too many, right in advance of that refinancing window. The high yield market suddenly collapsed in November, the window closed, and getting the refinancing done at all required a highly dilutive equity component in the form of a $55M convertible bond, convertible at $4.38, versus my prior NAV calc of $12, now reduced to $8.50 per share, which is 222% above the 12/31/18 closing price of $2.64, but less impressively above our average cost of $6.06. There is a lot of optionality in the HC2 portfolio, which layered on top of the financial leverage which just bit us pretty badly, can make for fireworks to the upside if one of two things work out. So while this remains one of our riskiest investments, the risk/reward is still attractive, and much more so from this blown out level.
Lastly, let me touch on the rationale behind having so much of the portfolio in the top two holdings, a roughly 20% weighting in Aimia Inc. (AIM CN) and a 16% weighting in Revlon Inc. (REV), and both are above our usual top weightings range of 10% to 15%. The Aimia weighting is big partially due to appreciation, as the stock was USD 2.71 on 12/31/18 versus our average cost of USD 1.68 and I did not want to sell since I believe it’s worth a minimum of USD 5.75 right now. But I am comfortable holding Aimia at a 20% weighting because more than half of its net worth is in cash, so on a look-through basis, the Aimia position is really more like a 10% weighting in the collection of assets inside of Aimia, and a 10% weighting in cash.
With Revlon it’s more about my comfort level with the low-end private market value (2x sales) and the decades-long endurance of the brand portfolio, with its proven record of innovating back into the fore whenever it gets behind trend. Also, it’s encouraging that the bank of Ron Perelman opened for Revlon when it was in much worse shape in the early 2000s, and would likely be there again if needed, which reduces the usual stress of being heavily long an equity whose bonds trade at $58 to $83. And lastly, owning a 13D-sized stake in Revlon gives us some standing with which to at least attempt to improve corporate governance at Revlon and fairness to minority shareholders.
In closing, I want to acknowledge how much deference we ask of you, especially during extended or extreme bouts of under- performance, and how grateful we are that you’ve seen fit to grant us that. Of course it’s not easy, when the market is screaming at you its conclusions, and we’re telling you the market is wrong. Sometimes for years. In a Barron’s magazine article from Feb. 15, 1999, Seth Klarman of Baupost called it a “necessary arrogance” to be a chronically contrarian, value investor, believing you’re right and the consensus is wrong. On the other hand, John Templeton said, “The most important lesson in investing is humility.” We take the Forrest Gump point of view on the matter and think, “maybe it’s both?”
And on the always topical subject of patience, I received an email from Shai Dardashti, Founder of Casulo Group, which had a quote I’d never seen before from Jeff Bezos on the benefits of a lengthy time horizon, which reminded me that Bezos started out as an investment manager:
“If everything you do needs to work on a three-year time horizon, then you’re competing against a lot of people. But if you’re willing to invest on a seven-year time horizon, you’re now competing against a fraction of those people, because very few companies are willing to do that. Just by lengthening the time horizon, you can engage in endeavors that you could never otherwise pursue. At Amazon we like things to work in five to seven years. We’re willing to plant seeds, let them grow—and we’re very stubborn. We say we’re stubborn on vision and flexible on details.” – Jeff Bezos, 2011
So to you, the allocator of capital to investment managers like us, falls this quandary over probabilities and practitioners, conviction and constraint, when to extend patience, and when to retract it. Of you we ask for all of your patience; in return we offer a relentless work ethic in fully transparent adherence to our value-oriented investment discipline, and the probability that its history of long-term out-performance will persist, thus rewarding your endurance accordingly.
Sincerely,
Christopher P. Mittleman
Chief Investment Officer – Managing Partner
This article first appeared on ValueWalk Premium


