This report highlights last month’s top performers and features a stock from the current portfolio. September’s Dividend Growth Stocks Model Portfolio was made available to members on September 28, 2017.
Recap from August’s Picks
Our Dividend Growth Stocks Model Portfolio outperformed the S&P 500 last month. The Model Portfolio rose 4.1% on a price return basis and 4.2% on a total return basis. The S&P 500 rose 1.5% on a price and 2.0% on a total return basis. The portfolio’s best performing stock was Lear Corp (LEA), which was up 17%. Overall, 21 out of the 30 Dividend Growth Stocks outperformed the S&P during the 7/28/17 to 8/30/17 measurement period.
The long-term success of our model portfolio strategies highlights the value of our Robo-Analyst technology, which scales our forensic accounting expertise (featured in Barron’s) across thousands of stocks[1].
The methodology for this model portfolio mimics an All-Cap Blend style with a focus on dividend growth. Selected stocks earn an Attractive or Very Attractive rating, generate positive free cash flow (FCF) and economic earnings, offer a current dividend yield >1%, and have a 5+ year track record of consecutive dividend growth. This model portfolio is designed for investors who are more focused on long-term capital appreciation than current income, but still appreciate the power of dividends, especially growing dividends.
Featured Stock from September: Maxim Integrated Products (MXIM: $48/share)
Maxim Integrated Products (MXIM), a broad-line semiconductor manufacturer, is the featured stock from September’s Dividend Growth Stocks Model Portfolio.
Over the past decade, MXIM’s revenue has grown by 1% compounded annually while after-tax profits (NOPAT) have grown by 8% compounded annually. Over the past three years, revenue has declined by 2% compounded annually. Despite the top-line headwind, NOPAT growth has accelerated to 12% compounded annually due to margin improvement. MXIM’s NOPAT margin increased to 25% in 2017 from 17% in 2014 and 14% in 2007. This has been accomplished primarily through meaningful reductions in operating costs.
MXIM’s return on invested capital (ROIC) (16% TTM) ranks in the top-quintile of our coverage universe. MXIM’s ROIC remains in a long-term uptrend compared to the 10% ROIC earned ten years ago.
Figure 1: MXIM’s Long-Term Profitability Improvement Trend
Sources: New Constructs, LLC and company filings
Steady Dividend Growth Supported by FCF
MXIM has increased its regular dividend for 11 consecutive years. The current annualized dividend of $1.44/share equates to 9% compound annual growth compared to the $0.94/share dividend paid five years ago. Growing FCF has fueled dividend growth in the past, and we expect the same for the future.
Over the past five years, MXIM has generated cumulative FCF of $2.5 billion (19% of market cap) and paid out cumulative dividends of $1.6 billion. MXIM’s $624 million of FCF over the trailing twelve months represents 154% of the annual cash dividend payment based on the $1.44/share annualized dividend. Stated differently, MXIM’s current regular dividend equates to a 65% FCF payout ratio.
Companies with FCF well in excess of dividend payments provide higher quality dividend growth opportunities because we know the firm generates the cash to support the current dividend as well as a higher dividend. On the flip side, the dividend growth trajectory of a company where FCF falls short of the dividend payment over time cannot be trusted to grow or sustain its dividend because of inadequate free cash flow.
Figure 2: MXIM’s Free Cash Flow (FCF) vs. Regular Dividend Payments

Sources: New Constructs, LLC and company filings
Tech-Sector Dividend Growth Stock with Attractive Risk-Reward
At its current price of $48/share, MXIM has a has a price-to-economic book value (PEBV) ratio of 1.4. This ratio means the market expects MXIM’s NOPAT to grow by no more than 40% over its remaining corporate life. This expectation seems overly pessimistic for a firm that has grown NOPAT by 10% compounded annually since 1998 and 40% cumulatively over the past three years alone.
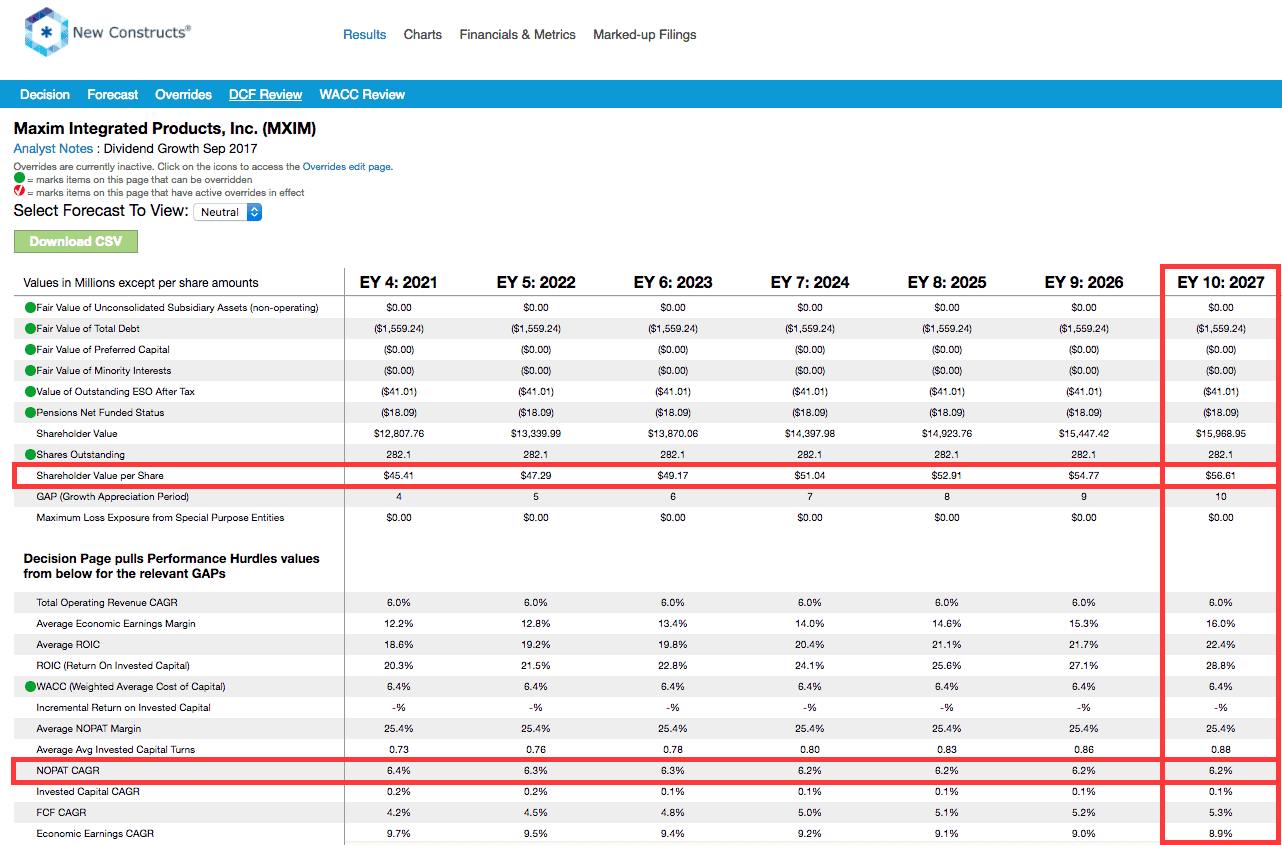
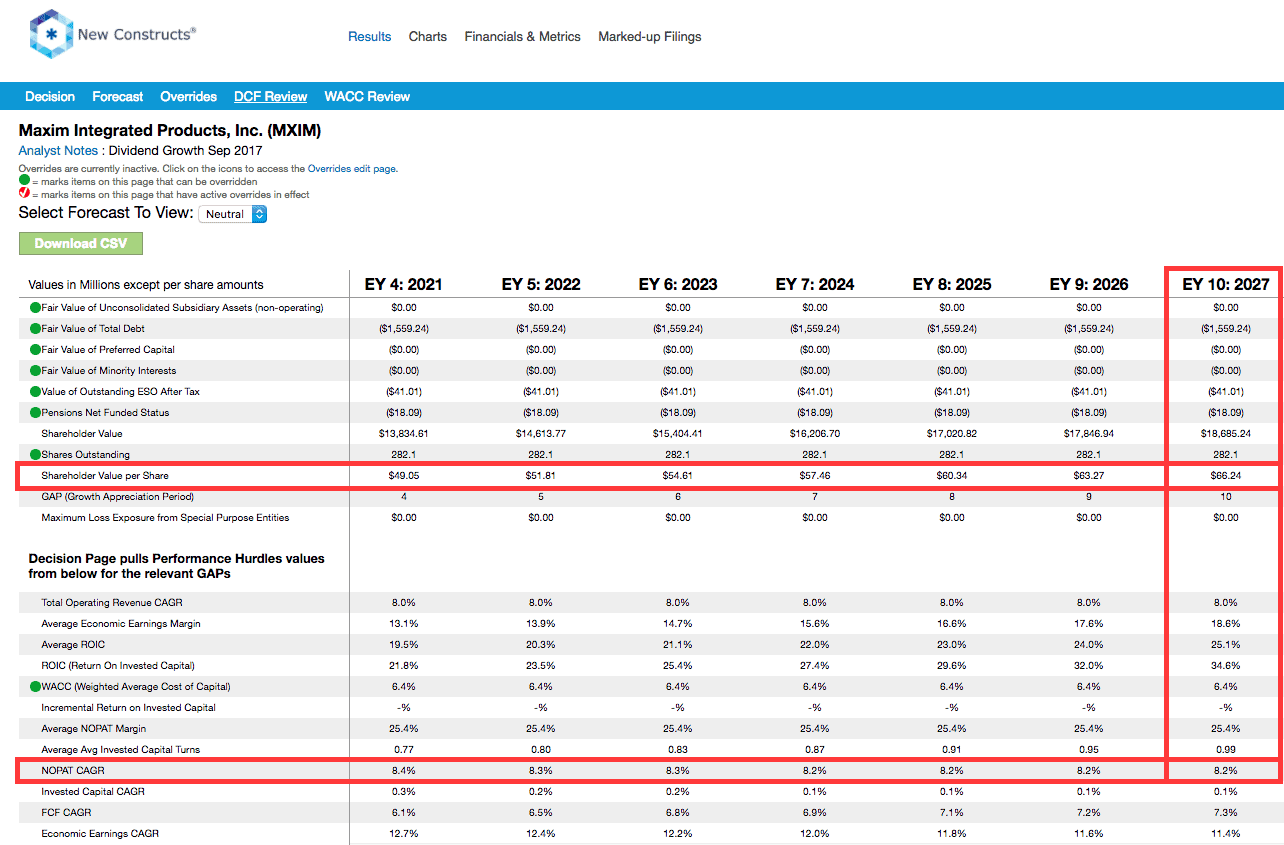
If MXIM can maintain current NOPAT margins (25% TTM) and grow NOPAT by 6% compounded annually over the next decade, the stock is worth $57/share today – an 18% upside. In a more optimistic scenario of 8% compound annual NOPAT growth over the next decade, the stock is worth $66/share today – a 37% upside.
MXIM represents an attractive risk-reward opportunity for investors and a textbook addition to our Dividend Growth Stocks Model Portfolio due to: meaningful upside potential rooted in low market expectations, consistent dividend growth, and FCF generation that exceeds dividend payments by a comfortable margin.
Auditable Impact of Footnotes & Forensic Accounting Adjustments
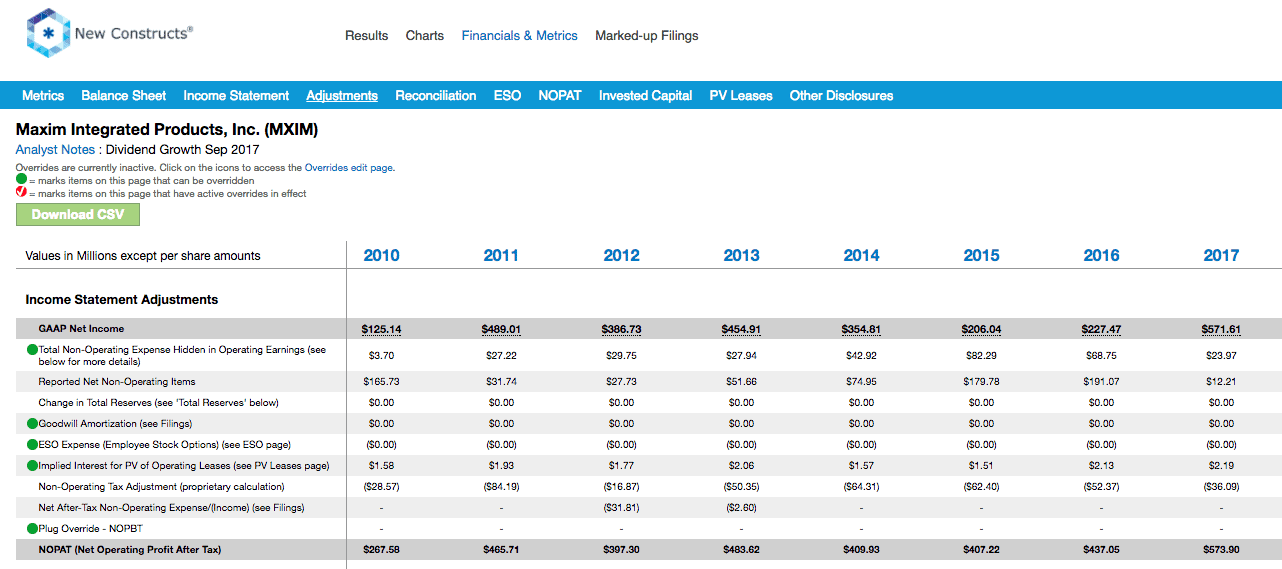
Our Robo-Analyst technology enables us to perform forensic accounting with scale and provide the research needed to fulfill fiduciary duties. In order to derive the true recurring cash flows, an accurate invested capital, and a real shareholder value, we made the following adjustments to Maxim Integrated Products’ (MXIM) 2017 10-K:
Income Statement: we made $136 million of adjustments with a net effect of removing $2 million in non-operating expense (<1% of revenue). We removed $69 million related to non-operating expenses and $67 million related to non-operating income. See all adjustments made to MXIM’s income statement here.
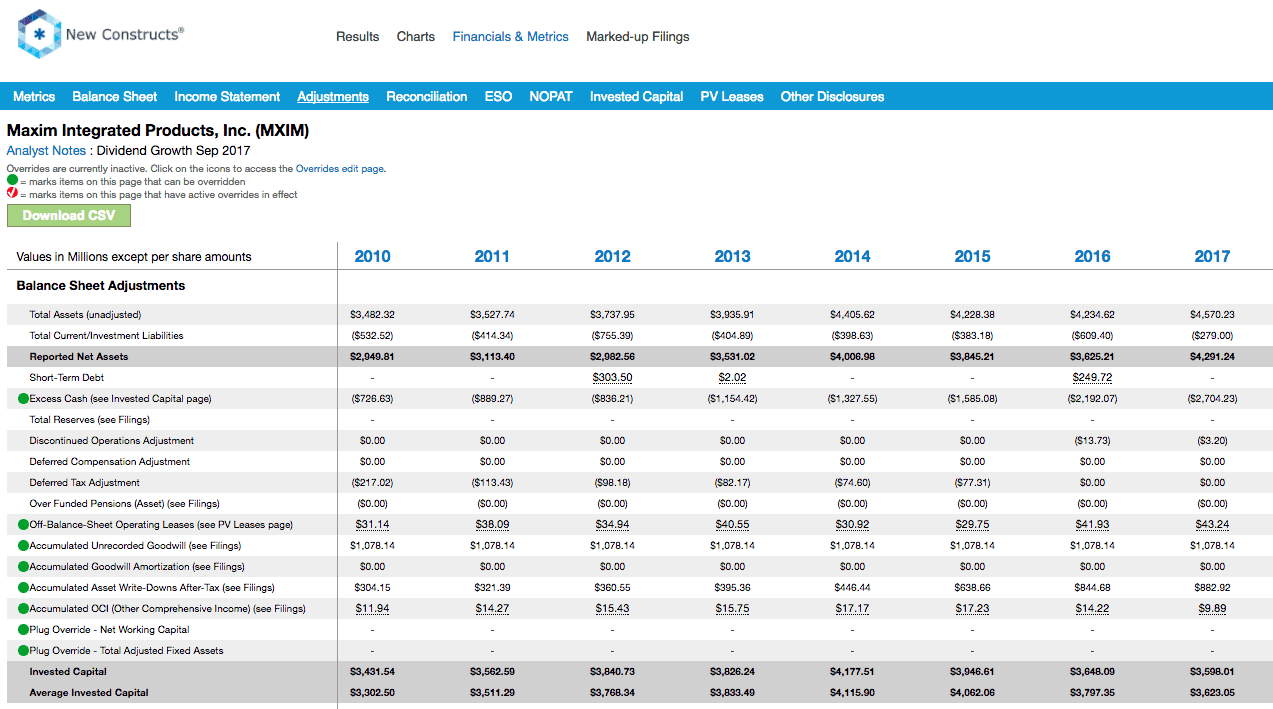
Balance Sheet: we made $4.7 billion of adjustments to calculate invested capital with a net increase of $668 million. The most notable adjustment was $1.1 billion (25% of reported net assets) related to goodwill. See all adjustments to MXIM’s balance sheet here.
Valuation: we made $4.3 billion of adjustments with a net effect of increasing shareholder value by $1.1 billion. The largest adjustment to shareholder value was $2.7 billion in excess cash. This cash increase adjustment was partially offset by a $1.6 billion decrease adjustment for total debt, which includes $43 million of off-balance sheet operating leases. Total net valuation adjustments of $1.1 billion represent 8% of MXIM’s market value.
This article originally published on October 5, 2017.
Disclosure: David Trainer, Kenneth James, and Kyle Guske II receive no compensation to write about any specific stock, style, or theme.
Article by Kenneth James, New Constructs


