U.S. Stock Market: What Has Happened Since 8/24 by Eric Bush, CFA, Gavekal Capital Blog
How stock market leadership reacts after large declines, like we had on Monday, August 24th, can give investors important signals as to whether we have seen the ultimate cyclical low. In the tables below, we break out performance since 8/24 by industry group for the developed world, emerging world and for the United States. As usual, this performance data is on an equal-weighted, USD basis.
The main takeaway when we look across all regions is that the industry groups that have been the worst performers YTD have seen the largest bounce since 8/24. This isn’t all that surprising since these industries were probably the most oversold going into the decline and a little relief rally is to be expected. However, it probably is a good indication that a further a testing of the low could be ahead of us since rarely does leadership switch on a dime from going from the worst performing sector to the best performing sector in the next cyclical. For example, off of the 2009 low consumer discretionary stocks led the markets higher. After the 2011 low, health care stocks have dominated performance. Health care stocks moved into leadership after the 2011 low after generally being the second or third best performer from 2009-2011.
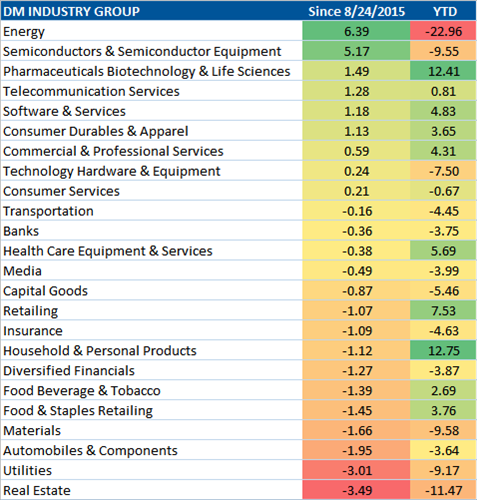
In the developed world, energy has been the worst performing sector YTD has it is down nearly 23%. Since 8/24, energy has also had the largest bounce as it has gained over 6%. On its heels since 8/24 is semiconductors and semiconductors equipment which has been the fourth worst performing industry group YTD. Overall, the bounce in the developed world has been pretty muted outside of these two industry groups. Only nine are positive since 8/24. Interestingly, real estate, which is the second worst performer YTD has had the worst performance since 8/24.
In the emerging markets, technology hardware & equipment has had the largest bounce as it has gained nearly 14.5%. Even after this gain, this industry group is down 19.5% YTD and is the fifth worst performer YTD. The worst performing industry group, semiconductors and semiconductors equipment, has had the second largest bounce since 8/24. Once again, one of the worst performers YTD has had the worst performance since the drop. Consumer services has fallen by 3.21% since 8/24 and is down nearly 26% YTD. Some of the better performing industry groups in the EM, like media, consumer durables & apparel, and pharmaceuticals biotechnology & life sciences, have been in the upper half of performance since 8/24.

Lastly in the US, once again the worst performing industry YTD, this time media, has been by far the best performer since 8/24. Media has gained 8.32% over the past two weeks. Several of the other underperforming industry group YTD, such as food, beverage & tobacco and household & personal products, have seen a decent gain since 8/24. Overall in the US, the bounce has been stronger than in the rest of the developed world as 19 out of 24 industry groups are positive since 8/24.


