Forget all the “earnings season” analysis you read last month. The real earnings season—annual 10-K filing season—is happening right now.
Every year in this six-week stretch from mid-February through the end of March we parse and analyze roughly 2,000 10-Ks to update our models for companies with a 12/31 fiscal year end. Our analysts work tirelessly to uncover red flags hidden in the footnotes and make our models the best in the business.
There’s no way we could analyze so many filings in such a short time without our engineering team’s help. Using machine learning and natural language processing, we automate much of the rote work of data gathering and modeling. Our technology frees our analysts up to spend more time on the complicated and unusual data points that other firms miss.
A Fiduciary Level of Diligence
Investors have understood for decades that you need to read the footnotes and make adjustments to understand a company’s true earnings and return on invested capital (ROIC). Two factors have blocked this level of diligence from becoming the industry standard.
For one, accurately calculating ROIC is hard. For years, the technological sophistication did not exist to perform this level of diligence on a wide scale. Even today, many data providers still get it wrong.
Secondly, the market has not always demanded diligence. For decades, industry groups and federal regulators tacitly accepted the reality of conflicted, less-than-ideal advice. A lack of transparency and education kept investors from demanding the diligence they deserve and that they, too often and wrongly, assume they are getting. But, that is starting to change.
As Michael Kitces observes, the new Department of Labor fiduciary rule could open up financial institutions to lawsuits if their brokers/advisors don’t meet a certain level of diligence. Even if the fiduciary rule is never enacted, clients are becoming more educated and will increasingly demand unconflicted, diligent advice.
As shown below, we work hard to provide advisors with the data they need to provide a fiduciary level of diligence.
What We Accomplished Last Week
Figure 1 shows the work our analysts did last week and over the entirety of this filing season so far.
Figure 1: Filing Season Diligence
Sources: New Constructs, LLC and company filings.
Last week, our analysts parsed 378 filings and collected 56,507 data points. In total, they made 9,646 adjustments with a dollar value of $5.3 trillion. That breaks down into:
- 4,185 income statement adjustments with a total value of $353 billion
- 3,867 balance sheet adjustments with a total value of $2,439 billion
- 1,594 valuation adjustments with a total value of $2,537 billion
10-K Filing – One Company To Watch In 2017
Based on our analysis of Cigna’s (CI: $149/share) 10-K this week, we have upgraded the stock from Neutral to Attractive.
We highlighted Cigna as one of our top stocks at the beginning of 2015. Shortly after, the insurer received a takeover offer from Anthem (ANTM) and ended the year up over 40%. The higher market expectations drove a downgrade on CI to Neutral in our system.
Now, the merger deal has fallen through, and analyst Lindsay Bohannon found a few items in Cigna’s 10-K last week that should put the stock back on investors’ radar.
Cigna had three significant hidden non-operating expenses in 2016 that artificially decreased its reported GAAP net income:
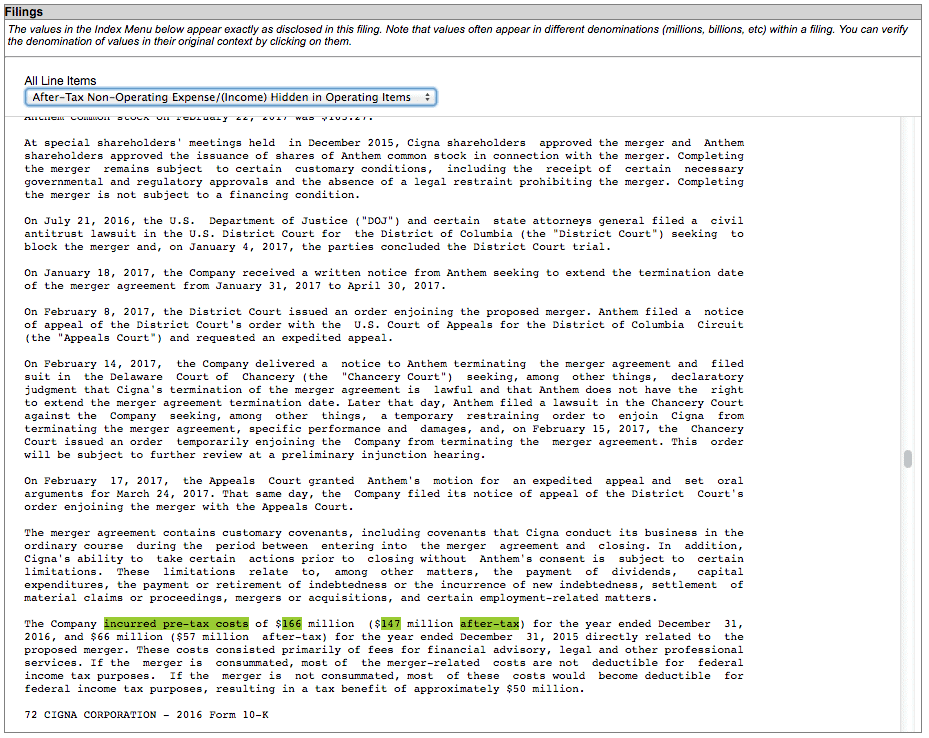
- On page 72 of its 10-K, we found a $147 million after-tax charge for costs related to the aborted merger.
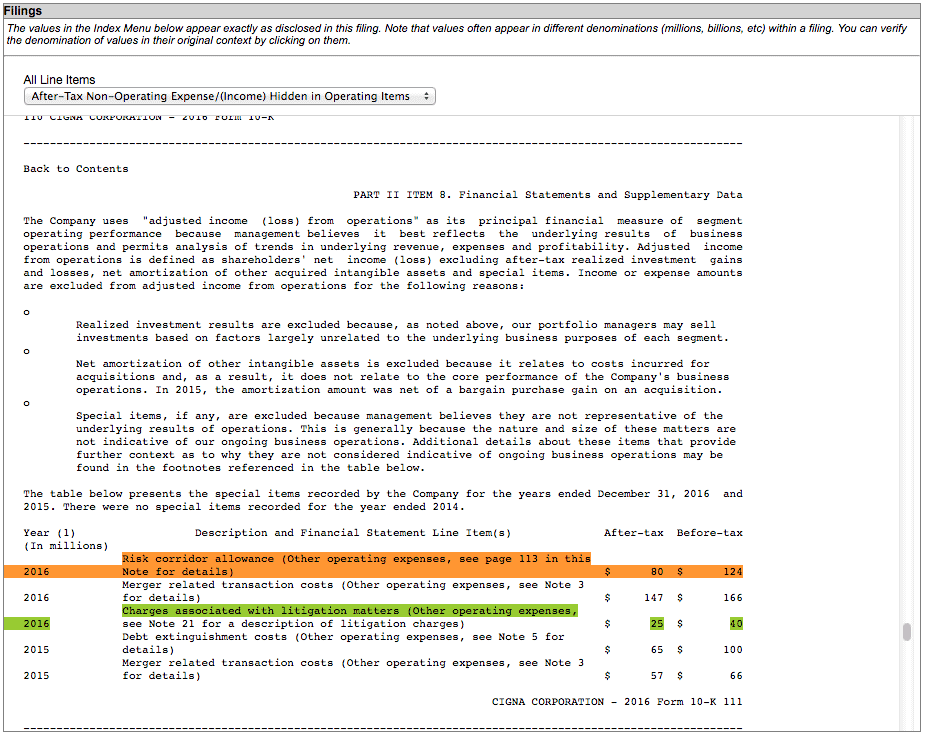
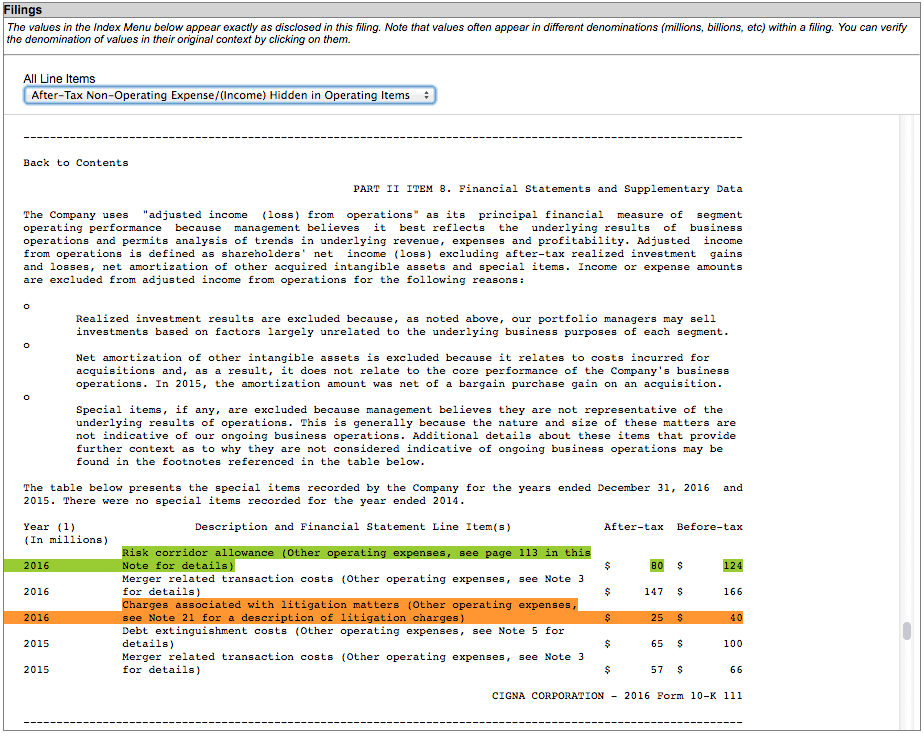
- On page 111 of its 10-K, we found an $80 million after-tax charge related to an unfavorable court decision that could impact Cigna’s ability to collect claims from the government related to the Affordable Care Act.
- Also on page 111, we found a $25 million after-tax charge from litigation expense.
All together, these three items accounted for $252 million in non-operating expense (13% of GAAP net income). While Cigna’s GAAP EPS declined by ~10% in 2016, the adjustments we made reveal that its true operating profit (NOPAT) was actually flat on the year and its ROIC held steady at ~11%.
The market appears to be underrating CI’s consistent profitability. At its current valuation of ~$149/share, CI has a price to economic book value (PEBV) of just 1.05, which implies that the market expects the company to grow NOPAT by no more than 5% for the remainder of its corporate life. Given the fact that Cigna has grown NOPAT by 6% compounded annually over the past decade, we think that the market’s expectations are too pessimistic.
Without reading the footnotes, investors would miss the significant non-operating expenses in Cigna’s 10-K. Reading the footnotes is an essential part of providing a fiduciary level of diligence, and it has enabled our stock picks to consistently outperform the market.
This article originally published here on February 28, 2017.
Disclosure: David Trainer, Lindsay Bohannon, and Sam McBride receive no compensation to write about any specific stock, sector, style, or theme.
Article by Sam McBride, New Constructs


