“You look at every bear market… they’ve always basically occurred because of an uptick in inflation and an uptick in interest rates.”
– Paul Tudor Jones
Citing an improving economy and the possibility of more spending and lower taxes from the Trump administration, Fed officials are signaling rising rates immediately ahead.
“An uptick in inflation and an uptick in interest rates.” We may be at the beginning of a new cycle.
I was in Kansas City this week presenting to a group of individual investors on behalf of one of our large advisor clients. As a quick aside, I’m a Philadelphian (the “City of Brotherly Love”) but boy, are the people in KC nice. Let’s just say KC takes the “brotherly love” theme to a whole new level.
Anyway, I talked about how deeply in debt we are here and in the balance of the developed world and, with interest rates at 5,000-year lows, there is no way that bonds can repeat what they have done over the last 35 years. Just a “just is” thing, so think about positioning your bond allocation differently.
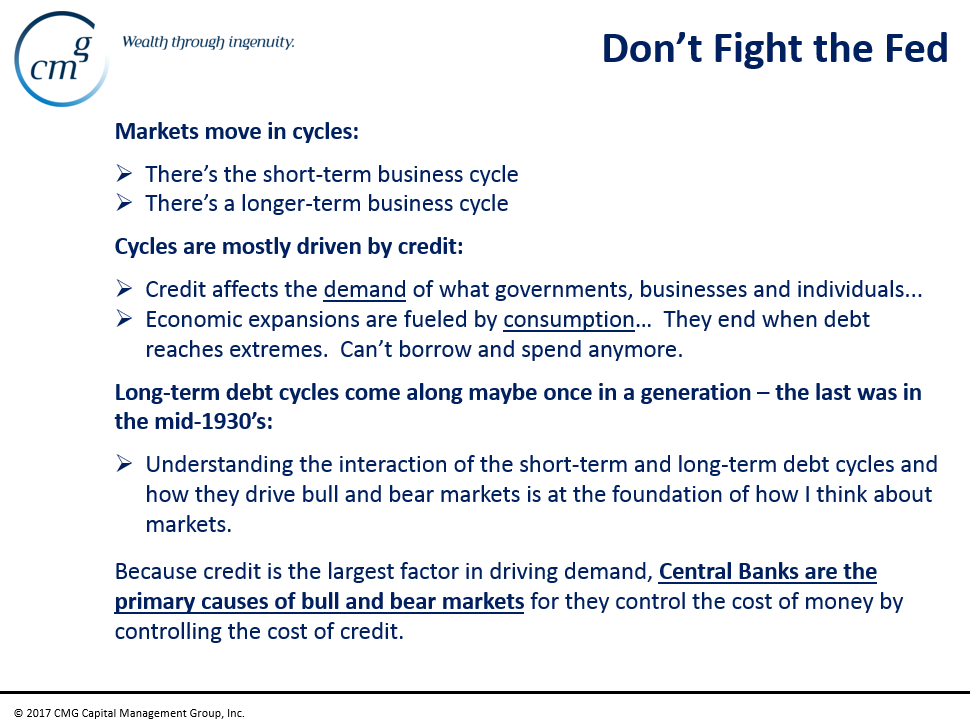
There were three slides I shared that I’d like to share with you. The main point in the first slide is that we are at the end of a long-term debt super cycle. One most similar to the mid-1930s. Most of us have never seen what the end of such cycles looks like. Let’s just say it gets bumpy.
- Don’t Fight the Fed – Central Banks are the Primary Cause of Bull and Bear Markets
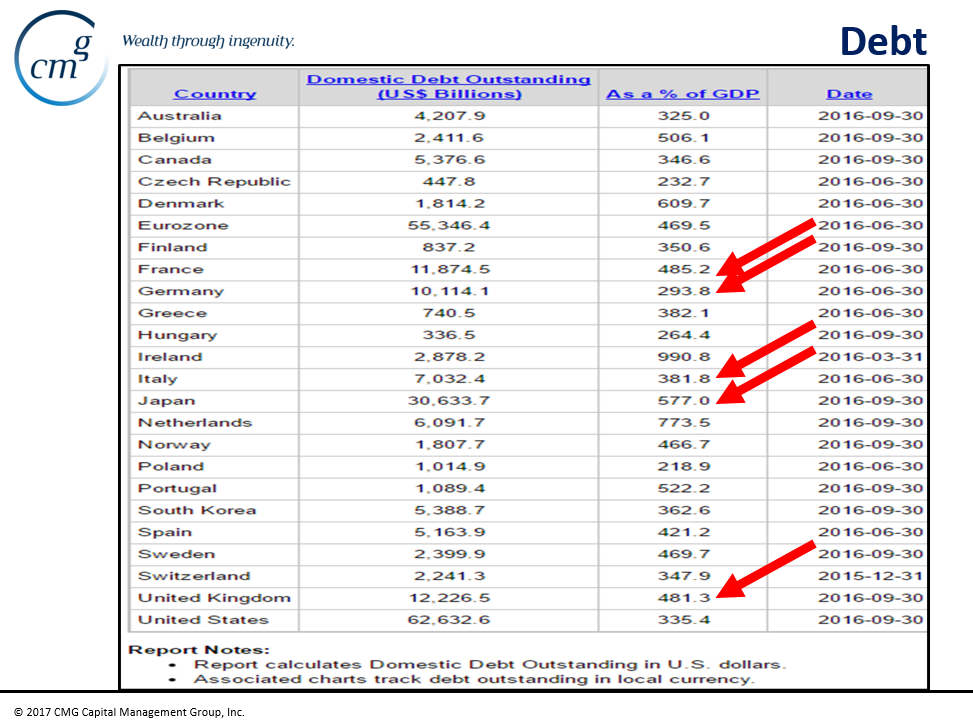
The second slide sums up the size of the problem. I told the audience to think of debt-to-GDP this way: If your brother earns $100,000 in annual income and borrowed $10,000 on his credit card, he could consume $110,000 worth of stuff. In this example, his debt to his personal GDP is just 10%. But what if he could get more credit year after year and reached a point where his total debt reached $352,000 but his income remained the same. His personal debt-to-GDP ratio would now be 352%.
If he could borrow at super low interest rates, maybe he could sustain the monthly loan payments. Maybe? But how much more could he possibly borrow? What lender would lend him more? And what if those low rates began to rise? How much debt can his $100,000 income cover? Essentially, he has reached the end of his own debt cycle. He has to make a massive shift in what he can earn or else there’s going to be big trouble.
Collectively, as a nation, our total national income (for simple reasoning purposes) is reported in a number we call GDP (Gross Domestic Product). It is a measure of all the goods and services we produce in a particular period. Think of it as our total national income and then compare what we earn relative to how much debt we owe and we come to our national debt-to-GDP ratio.
As you look at the collection of countries in the next chart, keep in the back of your mind that credible academic studies, looking back at over eight centuries, found that the point in which a country runs into issues is when its total debt-to-GDP ratio reaches 90%. That’s like your brother earning $100,000 with $90,000 in debt. Look at the debt trap the developed world finds itself in today:
- While U.S. debt is at 352% total debt-to-GDP, the rest of the developed world is also struggling with a debt mess:
And keep in mind that rising interest rates will put more squeeze in our brother’s ability to pay.
My fundamental view is that we remain at the end of a challenging debt super-cycle. It is beginning to deleverage. Such cycles happen maybe once in a generation. Most of us have never seen one. The last one was in the mid-1930s. They are deflationary in nature but that doesn’t mean we won’t see inflationary pressures and higher interest rates. Today’s immediate issue is that short-term inflationary pressures are evident and signal risk to rising interest rates. And, as today’s OMR title declares, the Fed plans to hike.
How we escape this trap remains to be seen. A beautiful or an ugly deleveraging (as Ray Dalio puts it)? The countries in the above chart have to somehow come together and agree to a grand understanding and while improbable as that outcome is, it would come with its share of consequences. Debt’s our most significant global issue.
I share in Trade Signals (link below) what I believe are a few important charts to review each week. One is Don’t Fight the Tape or the Fed. In past letters, I’ve suggested “Watch out for minus 2.” You’ll see what I mean when you look at the chart. The Fed eyes aggressive rate increases. Keep your eye on a -2.
You’ll also find a few others that I hope can help you monitor and measure return and risk probabilities. For example, the Zweig Bond Model is signaling higher interest rates, which is a bearish environment for high-grade bond funds and ETFs, yet our trend-based indicators continue to suggest there is more room for the cyclical bull to run. So despite the global macro debt issues (we keep On Our Radars), the Trump trade remains “risk on” and our trend-based strategies remain mostly long risk assets.
Finally, I share an article by Ambrose Evans-Pritchard. He is one of my favorite thinkers and writers. I believe it will give you a sense as to just how close a European sovereign debt crisis might be. I did not “red arrow” to the total Eurozone debt in Chart #2 above, but take a quick look again and you’ll see that it sits at 470%. Debt remains global issue number one.
Grab a coffee and find your favorite chair and read on… and have a great weekend!
? If you are not signed up to receive my weekly On My Radar e-newsletter, you can subscribe here. ?
Included in this week’s On My Radar:
- Unpayable Debts and an Existential EU Financial Crisis – Are Eurozone Central Banks Still Solvent?
- Charts of the Week
- Trade Signals – Equity Trend Bullish, Bonds Bearish, Sentiment Extreme Optimism; Trend Trumps Sentiment
Unpayable Debts and an Existential EU Financial Crisis – Are Eurozone Central Banks Still Solvent?
Debt’s a drag, man. It’s one thing to say debt-to-GDP is this or that. It’s another to then see the evidence of the problem right in front of our face.
I wrote about the subprime problem and the systemic risk it presented. It made no sense that no-doc mortgages could be rolled up into tranches of AAA-rated stuff. After the crisis, many said that nobody saw it coming. We did, wrote about it frequently and so did others. Just saying…
It’s my view that we are nearing a sovereign debt crisis and that it starts in Europe. As Ambrose writes, “such a tail risk is real.” How we work through it and just how severe the impact will be we don’t yet know, but the risk is real. Like subprime before it, we can’t say we didn’t see it. This article ties in nicely with what I wrote above and I believe it is well worth your read…
By Ambrose Evans-Pritchard, February 23, 2017
Vast liabilities are being switched quietly from private banks and investment funds onto the shoulders of taxpayers across southern Europe. It is a variant of the tragic episode in Greece, but this time on a far larger scale, and with systemic global implications.
There has been no democratic decision by any parliament to take on these fiscal debts, rapidly approaching €1 trillion. They are the unintended side-effect of quantitative easing by the European Central Bank, which has degenerated into a conduit for capital flight from the Club Med bloc to Germany, Luxembourg, and The Netherlands.
This ‘socialization of risk’ is happening by stealth, a mechanical effect of the ECB’s Target2 payments system. If a political upset in France or Italy triggers an existential euro crisis over coming months, citizens from both the eurozone’s debtor and creditor countries will discover to their horror what has been done to them.
Such a tail-risk is real. As I write this piece, four out of five stories running on the news thread of France’s financial daily Les Echos are about euro break-up scenarios. I cannot recall such open debate of this character in the Continental press at any time in the history of the euro project.
As always, the debt markets are the barometer of stress. Yields on two-year German debt fell to an all-time low of minus 0.92pc [percent] on Wednesday, a sign that something very strange is happening. “Alarm bells are starting to ring again. Our flow data is picking up serious capital flight into German safe-haven assets. It feels like the build-up to the eurozone crisis in 2011,” said Simon Derrick from BNY Mellon.
I’ll cut to the chase (but you can read the entire article here. It does, however, require a subscription.)
- Private investors sell their holdings of Italian or Portuguese sovereign debt to the ECB at a profit and rotate the proceeds into mutual funds Germany or Luxembourg. “What it basically shows is that monetary union is slowly disintegrating despite the best efforts of Mario Draghi,” said a former ECB governor.
- The Banca d’Italia alone now owes a record €364bn to the ECB – 22pc of GDP – and the figure keeps rising. Mediobanca estimates that €220bn has left Italy since the ECB first launched QE. The outflows match the pace of ECB bond purchases almost euro for euro.
- Professor Marcello Minenna from Milan’s Bocconi University said the implicit shift in private risk to the public sector – largely unreported in the Italian media – exposes the Italian central bank to insolvency if the euro breaks up or if Italy is forced out of monetary union. “Frankly, these sums are becoming unpayable,” he said.
Does this next bullet sound familiar (emphasis mine)?
- It is astonishing that the rating agencies still refuse to treat the contingent liabilities of Target2 as real debts even after the Draghi letter and given the self-evident political risk. Perhaps they cannot do so since they are regulated by the EU authorities and are from time to time subjected to judicial harassment in countries that do not like their verdicts. Whatever the cause of such forbearance, it may come back to haunt them.
And Ambrose concludes with this:
- So what happens if the euro fractures? We can assume that there would be a tidal wave of capital flows long before that moment arrived, pushing the Target2 imbalances towards €1.5 trillion. Mr. Buiter says the ECB would have to cut off funding lines to “irreparably insolvent” central banks in order to protect itself.
- The chain-reaction would begin with a southern default to the ECB, which in turn would struggle to meet its Target2 obligations to the northern bloc, if it was still a functioning institution at that point. The ECB has no sovereign entity standing behind it. It is an orphan.
- The central banks of Germany, Holland, and Luxembourg would lose some of their Target2 credits, yet they would have offsetting liabilities under enforceable legal contracts to banks operating in their financial centres. These liabilities occur because that is how the creditor central banks sterilize Target2 inflows.
- In other words, the central bank of Luxembourg would suddenly owe 350pc of GDP to private counter-parties, entailing debt issued under various legal terms and mostly denominated in euros. They could try printing Luxembourgish francs and see how that works.
- Moody’s, Standard & Poor’s, and Fitch all rate Luxembourg a rock-solid AAA sovereign credit, of course, but that only demonstrates the pitfalls of intellectual and ideological capture.
- It did not matter that the EMU edifice is built on sand as long as the project retained its aura of inevitability. It matters now. Bookmakers are offering three-to-one odds that a candidate vowing to restore the French franc will become president in May.
So is it a Brexit, Trump-like probability in Italy and France?
- Anything could happen over coming months in France, just as it could in Italy where the ruling Democratic Party is tearing itself apart. Party leader Matteo Renzi calls the mutiny a “gift to Beppe Grillo”, whose euro-sceptic Five Star movement leads Italy’s polls at 31pc.
- As matters now stand, four Italian parties with half the seats in parliament are flirting with a return to the lira, and they are edging towards a loose alliance.
- This is happening just as the markets start to fret about bond tapering by the ECB. The stronger the eurozone economic data, the worse this becomes, for pressure is mounting in Germany for an end to emergency stimulus.
- Whether Italy can survive the loss of the ECB shield is an open question. Mediobanca says the Italian treasury must raise or roll over €200bn a year, and Frankfurt is essentially the only buyer.
- It is France and Italy that threaten to subject the euro experiment to its ordeal by fire. If the system breaks, the Target2 liabilities will become all too real and it will not stop there. Trillions of debt contracts will be called into question.
- This is a greater threat to the City of London and the banking nexus of the Square Mile than the secondary matter of euro clearing, or any of the largely manageable headaches stemming from Brexit. Would anybody even be talking about Brexit in such circumstances?
If you think back to the chart I shared with the Kansas City audience (and you above), we know from studying history that credit eventually kills all great societies. My focus with these pieces each week is to try my best to figure out, like tech in 1999 and subprime in 2007, what are the most significant risks we face and how do we do are damnedest to cover our backsides and even profit.
Keep your eye on a probable European sovereign debt crisis. Keep your eye on Italy and keep your eye on the French election. The U.S. looks to be the cleanest shirt in the dirty shirt contest but we are all linked globally together so… be mindful of risks and stay nimble.
Charts of the Week
Let’s start with the following chart on German debt yields. A minus 0.90%. You get to pay Germany nearly one percent for the privilege of owning their government bonds. This chart from Ambrose’s Telegraph article. Insane…
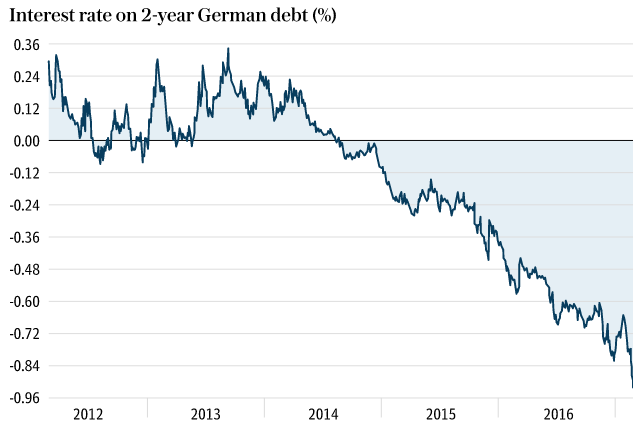
Source: The Telegraph
The next chart plots U.S. economic recoveries. Note the blue line. Debt’s the drag:
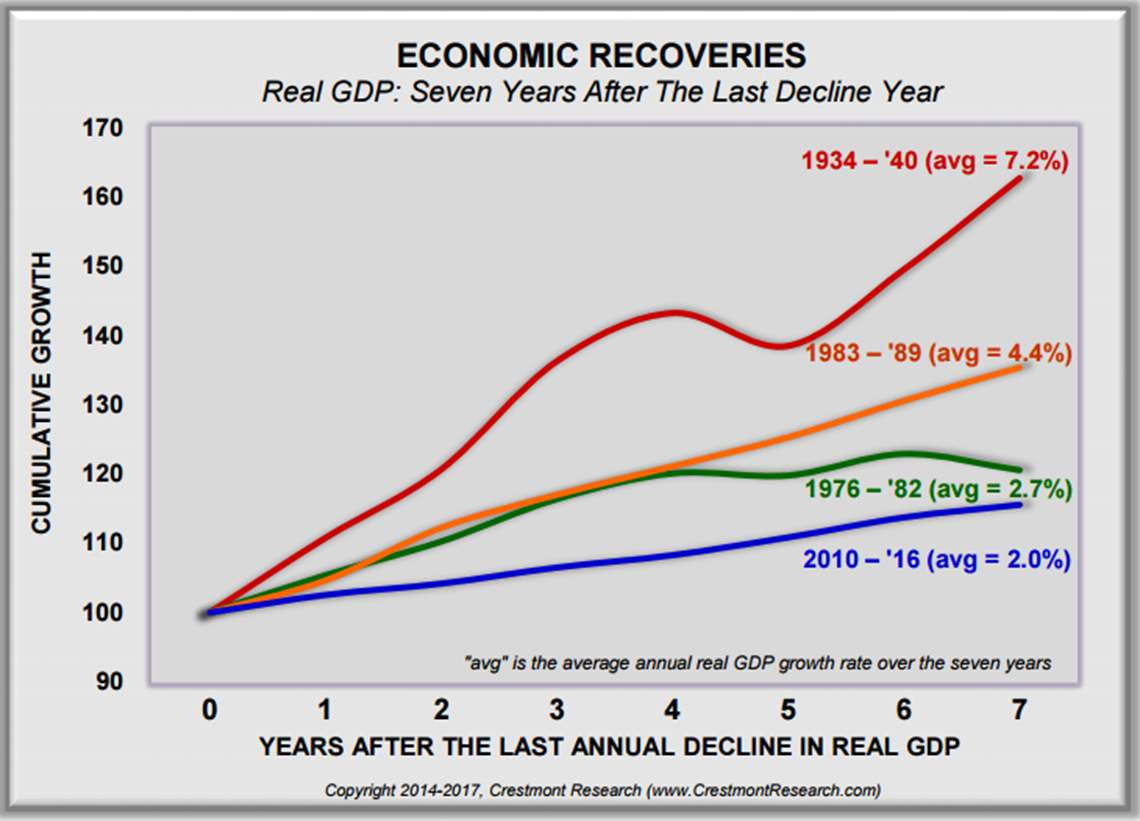
Source: Crestmont Research
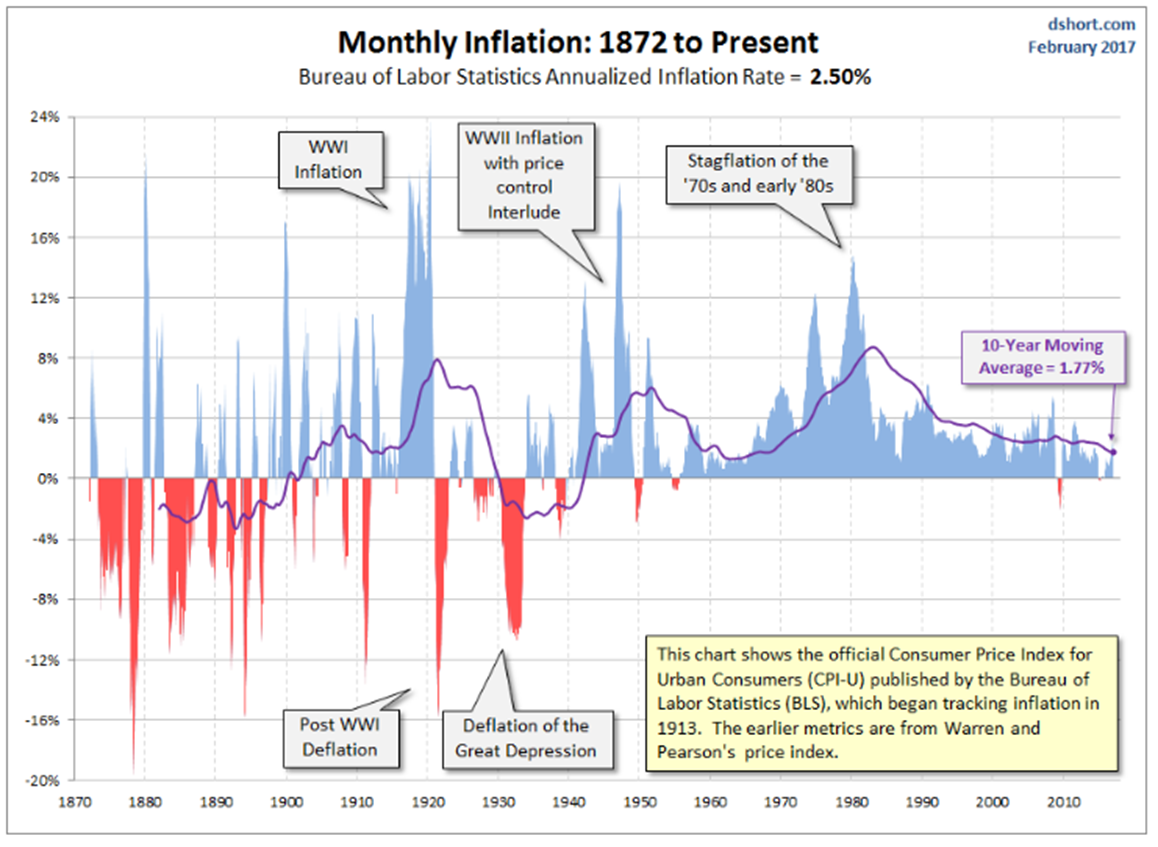
Keep an eye on inflation (rising):

Year-over-year change in CPI – look at the January numbers in the far right of the chart. The most recent BLS – Bureau of Labor Statistics Annualized Inflation Rate year-over-year equals 2.5%. The Fed’s target has been reached:
Source: Advisor Perspectives
And if you were wondering what inflation looks like by category:
Source: dshort.com
Source: dshort.com
Here is the current probability of a Fed March interest rate hike:
Switching to equities, Ned Davis Research has something they call “Top Watch Indicators”… meaning indicators that help them spot a probable market top.
Here’s how you view the next chart:
- When the green bars in the lower section rise above the horizontal dotted line (50), a market top is indicated.
- The vertical dotted lines and shaded area indicates the times that more than 50% of their top watch indicators signaled a market top.
- Percentage declines are indicated.
- Green bar on the far right shows where we are as of 2-14-17.
Source: Ned Davis Research
Chalk one little dot up for the active fund managers. All the money has been flowing into passive index funds and ETFs:
And all that money that chased into “high dividend papers?” In a few short months, they’ve given up six years of excess returns. I continue to be cautious on high dividend stocks due to over popularity, low interest rates and the risk of rising rates.
Diversification has been under pressure the last few years. The average university endowment lost 1.90% in 2016. However, it is best viewed over the long term and designed to achieve a certain return relative to an acceptable amount of risk. 100% allocation to stocks is for a different investor risk profile. Not wise to compare one asset class to a diversified investment plan. With that said, in case you were wondering… this is how the 10 richest universities invested their money in 2016:

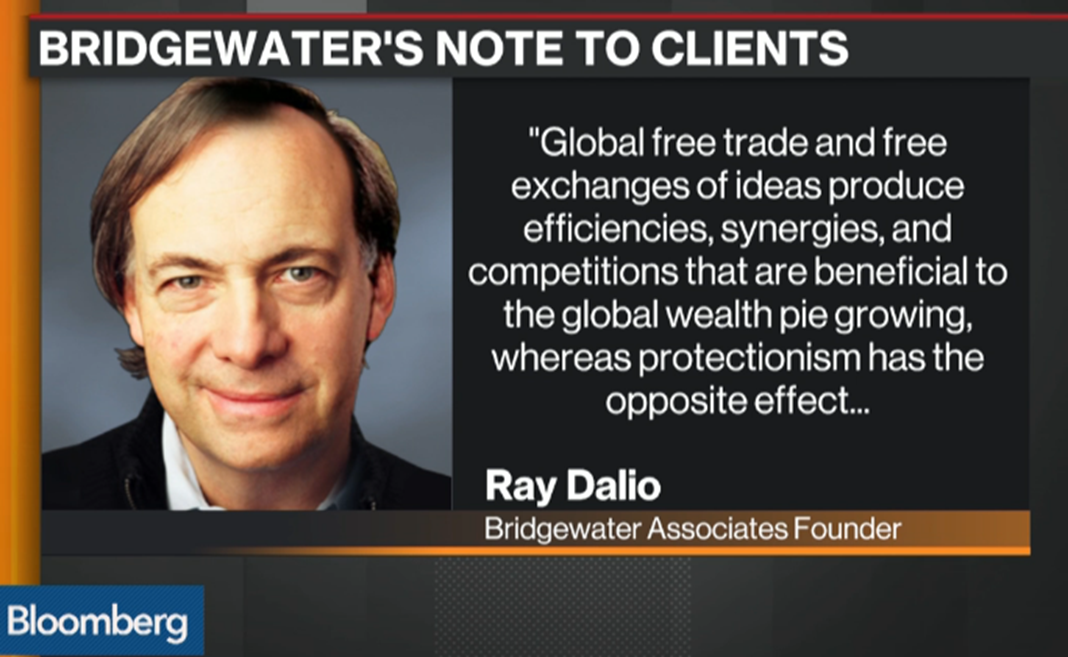
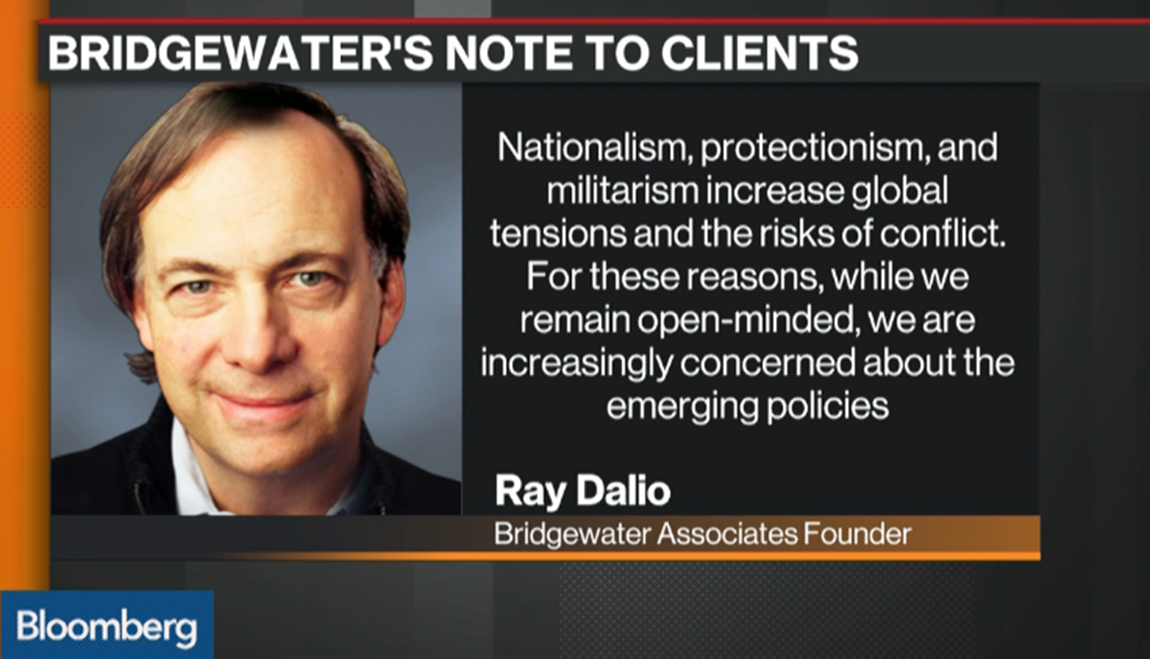
Dalio is less optimistic on Trump:
I read and save what I find interesting to an app called Evernote. When I get to the end of the week and begin to write, I have a collection of ideas to share with you.
I’m taking a shot at this new “Charts of the Week” section and hope you find some of them useful in your work with your clients or for yourself if you are an individual investor.
So let me know what you think of this section and also please share with me anything you find interesting. I appreciate your feedback…
Trade Signals – Equity Trend Bullish, Bonds Bearish, Sentiment Extreme Optimism; Trend Trumps Sentiment
S&P 500 Index — 2,364 (2-22-2017)
Click here for the charts and explanations.
Personal Note
It’s 70 degrees and sunny here in Philadelphia and wow… it feels really good. I would like to express my gratitude to David Dickens and David Cox of Brookstone Capital Management for hosting me at their terrific event in Kansas City. Thanks much!
John Mauldin and I are presenting on March 14 and 15 in the metropolitan NYC area (Summit, New Jersey and Hackensack, New Jersey) on behalf of Josh Jalinski, “The Financial Quarterback.” Josh is a popular financial radio talk show host on iHeart Radio and works closely with Mauldin Solutions and CMG. John will be sharing his views on what he sees ahead.
If you’re an individual investor and are interested in attending, email [email protected] to reserve a seat. Let Josh’s team know I sent you to him and please feel free to email me if you’d like to learn more.
If you are an independent advisor and you’d like to learn more about the Mauldin Solutions Core Strategy, John and his team will be hosting a series of due diligence meetings in Dallas. The first is scheduled for March 28 and 29 in Dallas. Dinner at John’s house the evening of the 28th and a half-day due diligence session with the ETF trading strategists that make up the Mauldin Solutions Core Strategy the morning of the 29th. Send me an email if you’d like to learn more.
Hope you have some fun plans for your weekend ahead. I’m driving my Matthew across the state to the Pittsburgh area. We are heading to Seven Springs ski area for an end of season ski competition. Matt does X-Game like jumps and his fingers are crossed for a good showing. I’m not sure how 70 degrees equates to good snow but hey, the bonding time is priceless.
Have a great weekend!


