This is a good time to review the action of the US$ on International Equities for US investors. Recent notes have focused on the correlation of oil and the Trade Weighted US$ Index Major Currencies. Below in the 1st chart is shown the Trade Weighted US$ Index Major Currencies vs. EFA(iShares MSCI EAFE ETF) Sept 2001 to Present. EFA is the iShares MSCI EAFE ETF which represents LgCap and MidCap Intl Equities. That there is an inverse correlation can be seen by looking at major shifts in both charts. EFA performance for investors in the US is driven by international longer term economic cycles but also influenced by the short term US$ relationship to global currencies. The EFA is inversely correlated whenever there is a short-period shift in Trade Weighted US$ Index Major Currencies. This is most prominent when investors fear the worst and rapidly shift funds into US$ based Treasuries. When this occurs it is US investors with Intl exposure who feel this impact.
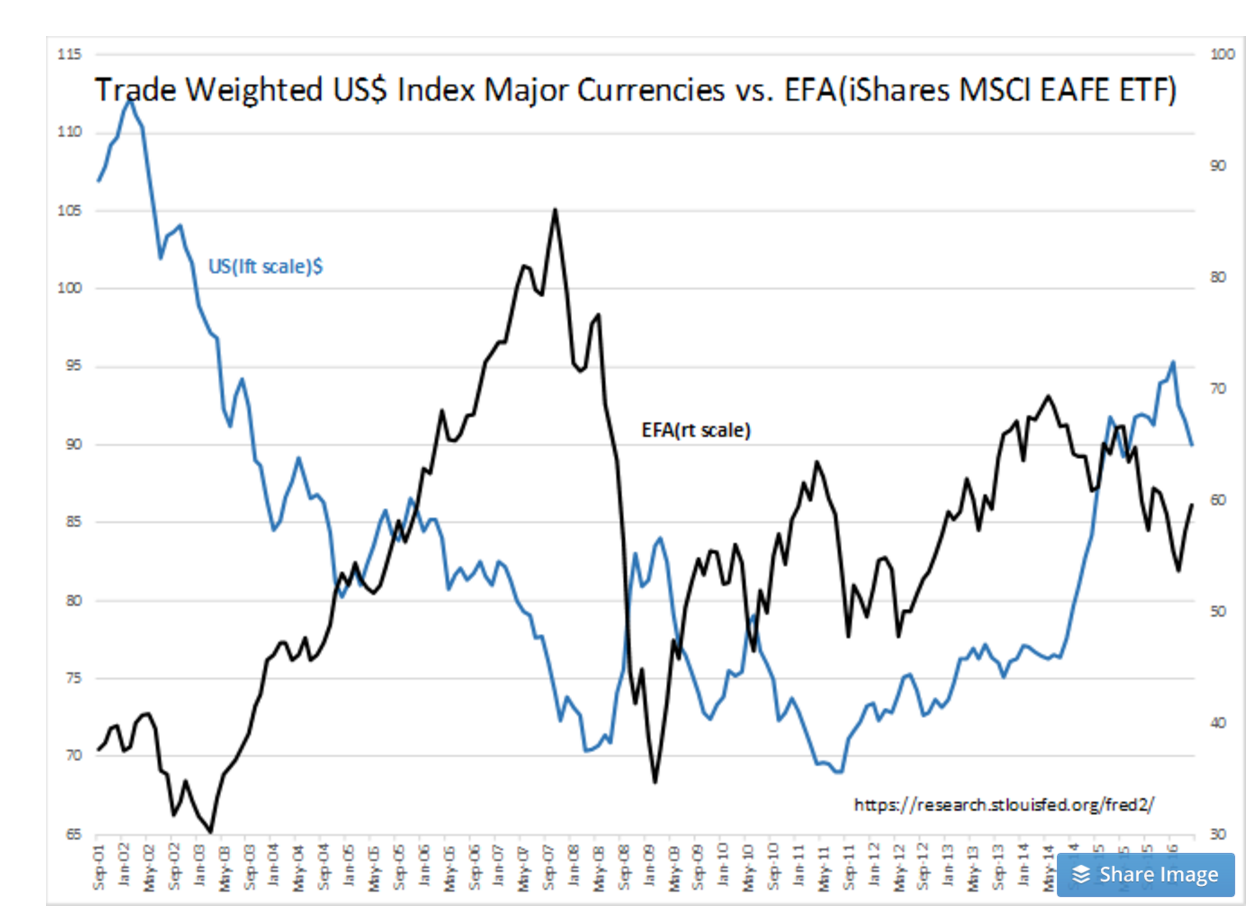
In the 1st chart one can see that recession in 2002-2003 had a stronger impact on EFA than the decline in Trade Weighted US$ Index Major Currencies. In 2008-2009 the impact of recession and strength in Trade Weighted US$ Index Major Currencies amplified the decline in EFAfor US investors. Recent history shows that since the lows of 2009 EFA was gradually rising with economic activity till May 2014 when theTrade Weighted US$ Index Major Currencies began a strong rise. From May 2014 till Feb 2016 EFA fell ~-25% as Trade Weighted US$ Index Major Currencies rose ~25%. Feb 2016 was the turn. Since Feb 2016 the Trade Weighted US$ Index Major Currencies has fallen ~-7% and EFA has risen ~11%.
Summary of Recent Market History:
1) May 2014 to Feb 2016 the Trade Weighted US$ Index Major Currencies rose ~25% and EFA fell ~-25%
2) Feb 2016 to Present the Trade Weighted US$ Index Major Currencies fell ~7% and EFArose ~11%
When the Trade Weighted US$ Index Major Currencies shifts over short periods, commodities (which are priced globally in US$) and investments outside the US priced in global currencies are impacted inversely. US$ strength came not for economic reasons but as a result of the Russian invasion of Ukraine in early 2014. I repeat, this was not an economic change. Data show that we have had no change in economic trends with the Russian invasion. The reversal of Feb 2016 is in my opinion the US$ beginning to return to its long term trend which is shown in the 2nd chart Trade Weighted US$ Index Major Currency vs. $WTI Crude Price.
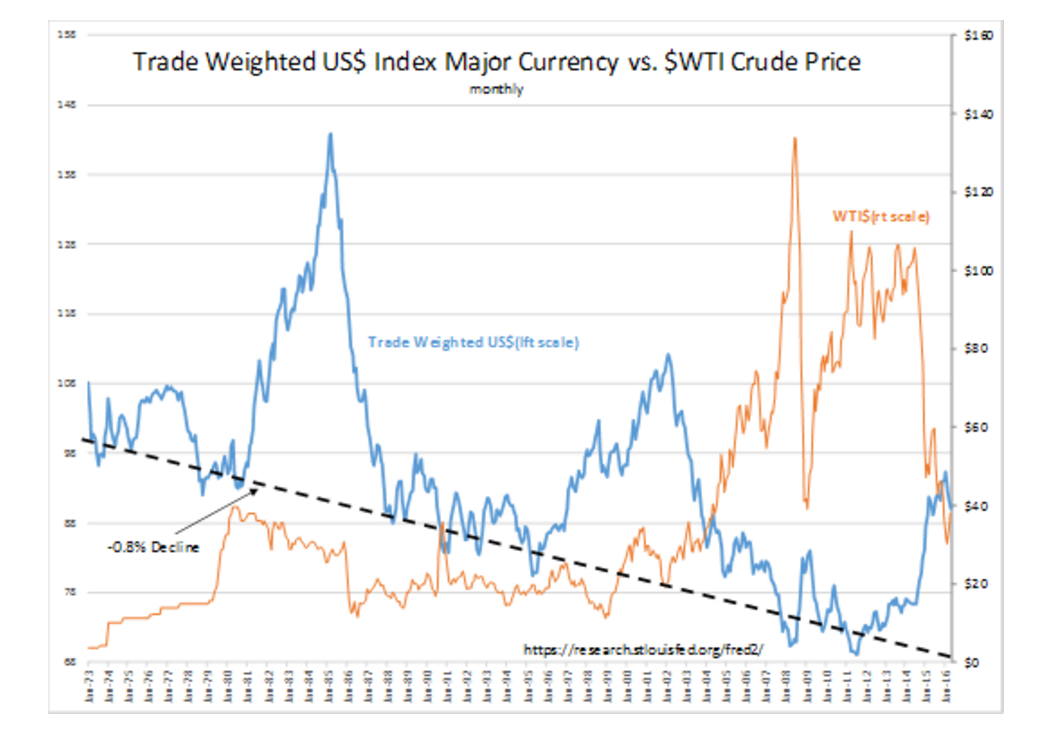
The 2nd chart Trade Weighted US$ Major Currency Index vs. $WTI Crude Price ($OIL) is from Jan 1973 to Present. One can see the inverse relationship to $WTI and the long term ~0.8% decline trend in Trade Weighted US$ Index Major Currencies. It is what is behind the long term trend that forms the expectation that Trade Weighted US$ Index Major Currencyshould return to trend in the next few years. The basis for the declining US$ against global currencies is in the story of global trade. Countries with the highest productivity and creativity in advancing global standards of living have the most active trade relationships. In seeking the lowest-cost standard-of-living improvements individuals direct their income transaction-by-transaction to those products and services which carry the greatest value for their income. Services are always local. Products however can be manufactured anywhere and imported if they provide value. Simply being cheaply manufactured does not fulfill the desire for improvements in standard of living for the consumer. The overall good must provide a combination of attributes which includes cost, functionality, appearance and etc. which only individual buyers can judge correctly for themselves. It is in manufacturing in other countries to provide goods which are competitive against other choices consumers have available that global trade plays its part.
Advances in Standard of Living = Intellectual Creativity = Net Profit Margins = Wealth Creation
In Free Market global trade, it is individuals in each country who make choices to benefit their own standard of living. The individuals in the country which creates the greatest standard of living advances also creates the largest wealth. Wealth is directly correlated to the intellectual value added to the individual standard of living which is in turn correlated to Net Profit Margins of corporations who do this better than other corporations. It is Net Profit Margins and the competition to provide value to individual consumers which make Free Markets so effective at standard of living advances. Governments which claim to do this via command economies have always failed. Venezuela’s mass deprivation is a good recent example of failed Socialism.
To understand this one only has to look at the difference between the Net Profit Margins of Microsoft and Apple ($AAPL), 40%+ and 25%+ respectively, against supermarkets and superstores which only distribute goods made by others and have Net Profit Margins of 1%-2% and 2%-3% respectively. Microsoft and Apple provide products which greatly reduce the cost of communication, analysis and transfer of intellectual information in society. The intellectual value of this benefit is reflected in wide Net Profit Margins. It is in the millions of daily individual choices transaction-by-transaction which sets Net Profit Margins for corporations. If the value is not present, individuals will spend their income elsewhere.
Microsoft creates and duplicates its products in the US. The labor costs for duplicating software are non-existent and Microsoft ($MSFT) does this in the US and has 40%+ Net Income Margins. Apple in comparison provides software on a hardware platform. It is the hardware which is complex and requires labor cost to manufacture. Apple outsources manufacturing to the lowest cost providers which means it must give up some of its profit margin to someone else. Apple’s Net Profit Margins are 25%+. Apple and all computer manufacturers have outsourced manufacturing and assembly to lower cost countries from the very early years. They have shifted sites as wages have risen in foreign countries. When Apple, the intellectual value creator, manufactures in lower cost countries and imports back to the US the US$ falls in relation to the currency of that country in which manufacturing occurs.
Multiply the Apple impact across all those companies in the US which have created intellectual value for society and used lower cost manufacturing countries, it should be clear that the net effect is to cause the currency of the country with the greatest value creation to fall in relation to others with which it trades. Note: Wages have always risen in those countries US companies to which exported manufacturing. Through our own desire to get the best value for our individual income, we raise the income of others and improve the standard of living of others. Through global trade, the most intellectually creative country raises the global standard of living. This is a natural process of Free Markets.
Global trade dominates the Trade Weighted US$ Index Major Currency trend. While global trade is far more powerful than short term swings in market psychology, the impact operates over a longer term and much more slowly. Nothing has changed the last several years to upset this long term trend. I expect the Trade Weighted US$ Index Major Currency to return to trend and commodity and Intl Equities to respond as they have historically.


