“Worldwide M&A activity totals US$1.3 trillion during YTD 2021, up 93% compared to same time last year. The YTD tally marks the strongest opening YTD period for deal making since records began in 1980. By number of deals, worldwide deal making has increased 6% so far this year, a 3-year high. Global M&A for deals greater than US$10 billion has increased 37% compared to the same period last year, while deals between US$1-US$5 billion have registered triple-digit percentage gains, by value and by number of deals, compared to a year ago. Within the US$1-US$5 billion category, 27% of deal value and 25% of volume has been driven by SPAC acquisitions, ” comments, Matt Toole, Director, Deals Intelligence, Refinitiv.

Q4 2020 hedge fund letters, conferences and more
Up 93% YoY, Worldwide M&A Activity Totals US$1.3 Trillion YTD; Strongest Opening Since 1980 Records
- Quarterly M&A surpasses US$1 trillion for third consecutive quarter; Strongest YoY Q1 percentage gains in 33 years; SPAC acquirors account for 27% of deals between US$1-5 billion
- US M&A nearly triples to all-time high; Europe deal making up 25%; Asia Pacific M&A up 45%
- SPACS: All-Time Quarterly Record by Value & Number of Deals: 103 SPAC combinations worth a combined US$228.5 billion have been announced so far in 21Q1
- February 2021 - Monthly record for proceeds raised, a total of US$34.5 billion
- March 2021 - Monthly record for the number of listing during any one month, a total of 112 SPAC IPOs
- Technology, Financials, Industrials and Energy & Power lead 2021 deals
- PE-backed buyouts double; Highest value, number of deals on record
- Cross-border deal making doubles; Emerging Markets M&A up 33%, lowest percentage M&A since 2009
- Goldman Sachs maintains top spot for WW, US, European and Asia Pacific M&A; Nomura takes top spot in Japan
Quarterly Highlights
Quarterly M&A Surpasses US$1 trillion for Third Consecutive Quarter; Strongest Year-Over-Year Q1 Percentage Gains in 33 Years; SPAC Acquirors Account for 27% of Deals between US$1-5 billion
Worldwide M&A activity totals US$1.3 trillion during year-to-date 2021, up 93% compared to the same period last year. The year-to-date tally marks the strongest opening YTD period for deal making since records began in 1980. By number of deals, worldwide deal making has increased 6% so far this year, a three-year high. Global M&A for deals greater than US$10 billion has increased 37% compared to the same period last year, while deals between US$1-US$5 billion have registered triple-digit percentage gains, by value and by number of deals, compared to a year ago. Within the US$1-US$5 billion category, 27% of deal value and 25% of volume has been driven by SPAC acquisitions.
The first quarter of 2021 marks the third consecutive quarter to surpass US$1 trillion. Including deals which were announced andsubsequently withdrawn, this recent span of deal making marks the fourth time in 40 years that three or more quarters have surpassed US$1 trillion: from 4Q 2017 to 2Q 2018 (3), from 2Q 2015 to 4Q 2015 (3) and from 4Q 2006 to 4Q 2007 (5).
U.S. M&A Nearly Triples to All-Time High; Europe Deal Making Up 25%; Asia Pacific M&A Up 45%
United States year-to-date M&A activity hit US$654.1 billion, up 160% compared to last year and is the country’s strongest opening period for deal making since records began in 1980. M&A in Europe has reached US$277.3 billion so far this year, up 25% compared to a year ago and a three-year high. Asia Pacific M&A activity for YTD 2021 totals US$206.5 billion, up 45% from year-to-date 2020 and a six-year high.
Technology, Financials, Industrials and Energy & Power Lead 2021 Deals
Deal making in the Technology sector accounts for a record 20% of global M&A so far this year with US$258.2 billion of deals announced, up 244% compared to last year and an all-time high. M&A targeting the Financials sector hit a record US$204.3 billion during year-to-date 2021, up 25% compared to year ago levels. Deal making in the Industrials sector accounts for 13% of global M&A so far this year with a record US$173.5 billion of deals announced, up 19% compared to last year and an all-time high. Deal making in the Energy and Power sector also accounts for 12% of global M&A so far this year with US$158.6 billion of deals announced, more than double year ago activity.
PE-backed Buyouts Double; Highest Value, Number of Deals on Record
Global private equity-backed M&A activity totaled US$250.6 billion during year-to-date 2021, a 116% increase compared to last year. Private equity backed buyouts account for 19% of overall M&A so far this year, up from 17% during year-to-date 2020. By number of deals, global PE-backed M&A is up 56% compared to a year ago. This marks the strongest year-to-date for global PE-backed deals, by value and number of deals, since records began in 1980.
Cross-Border Deal Making Doubles; Emerging Markets M&A Up 33%, Lowest Percentage of M&A since 2009
Cross-border M&A totaled US$447.2 billion during year-to-date 2021, a 135% increase compared to last year. By number of deals, cross-border deal making is up 7% compared to a year ago, a three-year high. M&A involving emerging markets totaled US$251.9 billion so far during year-to-date 2021, a 33% increase compared to a year ago. The first quarter of 2021 accounts for the lowest percentage of emerging markets deal making since 2009.
Goldman Sachs Maintains Top Spot for WW, US, European and Asia Pacific M&A; Nomura Takes Top Spot in Japan
Goldman Sachs maintained the top position for worldwide announced M&A advisory work during year-to-date 2021 boosted by the top ranking in the United States, Europe and Asia Pacific, while Nomura took first place in Japan. Led by Evercore Partners, nine independent advisory firms placed among the top 25 global financial advisors during year-to-date 2021.
Worldwide M&A Volumes
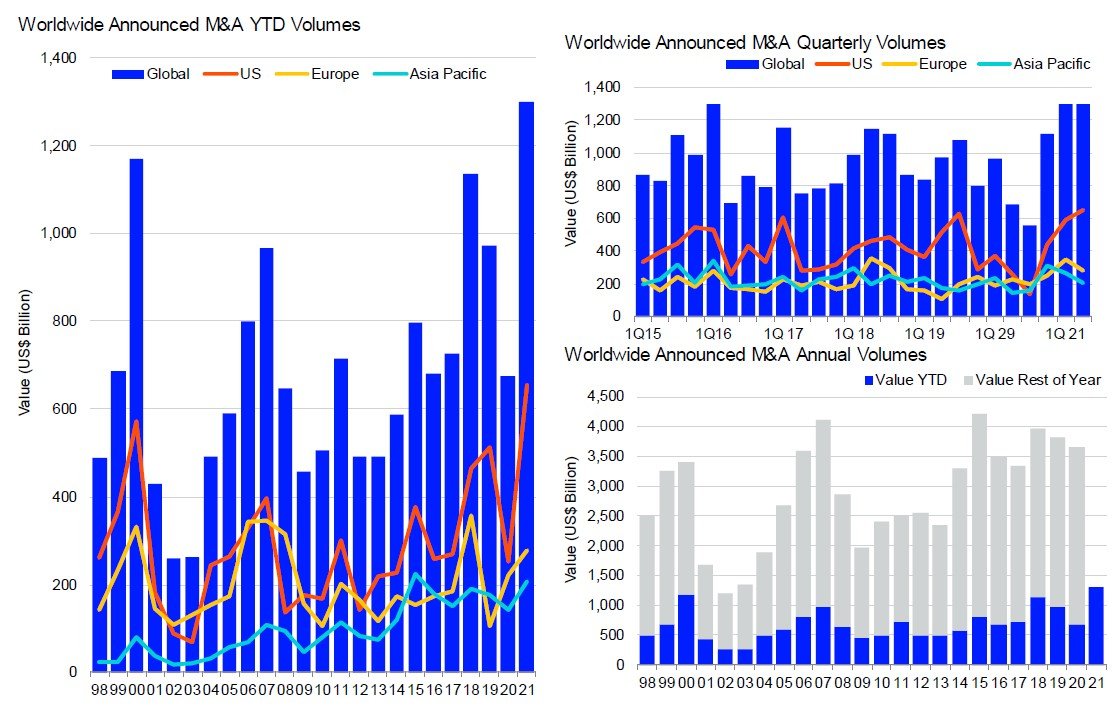
WW M&A Up 93%
Worldwide M&A activity totals US$1.3 trillion during year-to-date 2021, up 93% compared to the same period last year. The year-to-date tally marks the strongest opening YTD period for deal making since records began in 1980. By number of deals, worldwide deal making has increased 6% so far this year, a three-year high. Global M&A for deals greater than US$10 billion has increased 37% compared to the same period last year, while deals between US$1-US$5 billion have registered triple-digit percentage gains, by value and by number of deals, compared to a year ago. Within the US$1-US$5 billion category, 27% of deal value and 25% of volume has been driven by SPAC acquisitions.
The first quarter of 2021 marks the third consecutive quarter to surpass US$1 trillion. Including deals which were announced and subsequently withdrawn, this recent span of deal making marks the fourth time in 40 years that three or more quarters have surpassed US$1 trillion: from 4Q 2017 to 2Q 2018 (3), from 2Q 2015 to 4Q 2015 (3) and from 4Q 2006 to 4Q 2007 (5). This most recent milestone would be the only consecutive streak to hold the record.
U.S. M&A Nearly Triples
United States year-to-date M&A activity hit US$654.1 billion, up 160% compared to last year and is the country’s strongest opening period for deal making since records began in 1980. By number of deals, YTD 2021 has produced 3,066 deals, a 3% decrease compared to year-to-date 2020 and a two-year low. First quarter quarter-to-date M&A activity in the U.S. is up 10% from this point in the fourth quarter of 2020.
Europe M&A Up 25%
M&A in Europe has reached US$277.3 billion so far this year, up 25% compared to a year ago and a three-year high. There have been just over 3,800 European deals announced year-to-date, a 7% increase compared to last year and the strongest YTD number of deals since 2018.
Asia Pacific Deal Making Up 45%
Asia Pacific M&A activity for YTD 2020 totals US$206.5 billion, up 45% from year-to-date 2020 and a six-year high. Asia Pacific accounts for 16% of worldwide merger activity, down from 21% during the year ago period.
Monthly M&A Activity
M&A stalled in the spring of 2020 with April recording the lowest global monthly M&A total since September 2004. M&A rebounded strongly over the summer with all nine months since July 2020 recording gains over the same month a year previous. Deals announced globally during January 2021 increased 91% from January 2020, while February deal value increased 63% year-on-on year to US$453.6 billion, the highest February M&A total since our records began in the 1980s. US$523.1 billion worth of deals have been recorded globally during March 2021, the highest monthly M&A total since our records began.
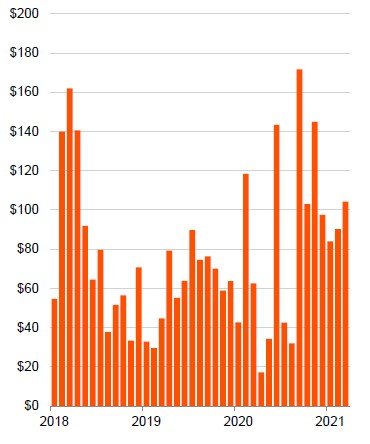
Global Monthly M&A ($bil)
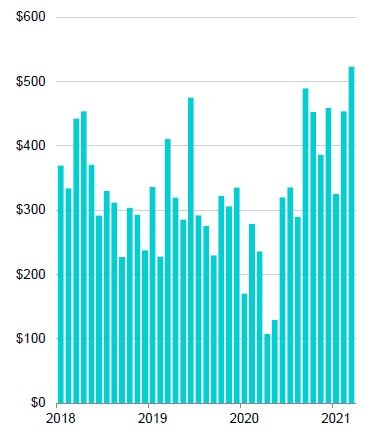
March 2021 saw the highest level of monthly M&A activity globally since our records began in the 1980s.
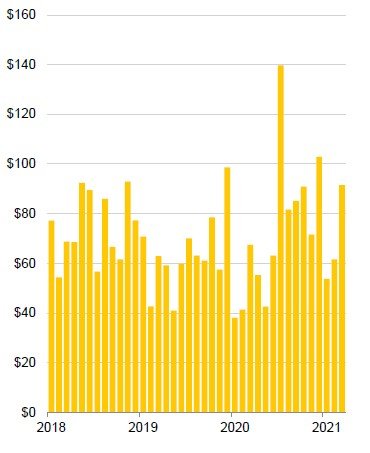
Americas Monthly M&A ($ bil)
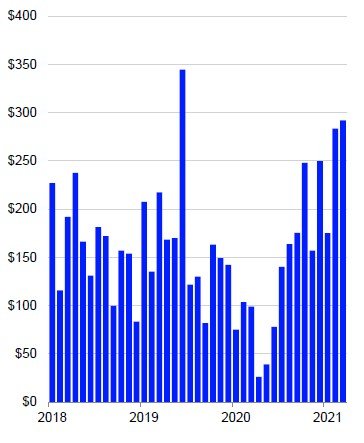
March 2021 saw the highest level of monthly M&A activity in the Americas in 21 months, the fourth highest monthly total of all-time.
Asia-Pacific Monthly M&A ($ bil)
Each month this year has seen double-digit percent gains for M&A in Asia over the same month last year.
European Monthly M&A ($ bil)
European M&A in March 2021 totalled US$104.3 billion, exceeding the US$100 billion mark for the fifth time in the last ten months.
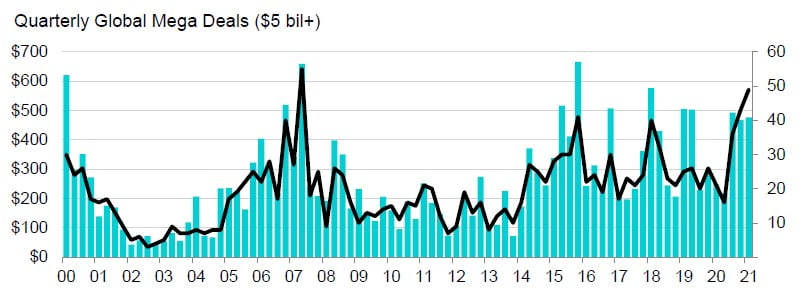
Billion Dollar Deals
263 deals worth US$1 billion or more have been announced so far during Q1 2021, 2.6-times the number recorded during the same period last year and the highest year-to-date tally since our records began in the 1970s. Both number and value of deals in the $1-5 billion size category reach all-time highs. Number of mega deals at all-time YTD high.
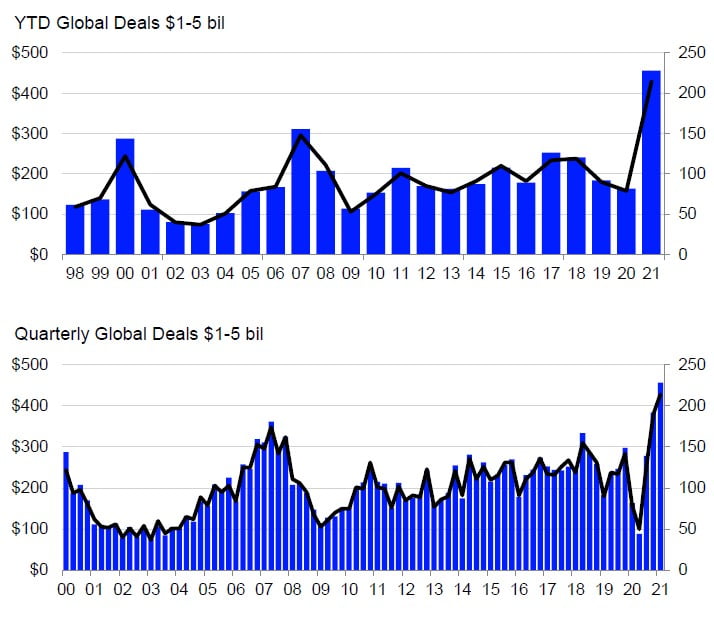
263 deals worth US$1 billion or more have been announced so far during Q1 2021, 2.6-times the number recorded during the same period last year and the highest quarterly tally since our records began in the 1980s. 111 billion dollar deals were announced in February alone, the highest monthly tally since our records began, exceeding the previous monthly record of 87 deals recorded in December 2020 by 28%.
The combined value of these billion dollar deals is US$932.2 billion, 126% more than the value recorded during the same period last year.
Deals in the $1-5 billion size category account for 35% of total global announced M&A deal value so far this year, compared to 24% at this time last year. Deals in this category have increased 179% in value and 171% by number compared to last year, both reaching all-time highs.
49 mega deals, each worth US$5 billion or more, have been announced so far during 2021, an all-time year-to-date high. The combined value of these deals is US$476.1 billion, up 92% YTD.