The post “Value And Momentum Factors In Fixed Income” appeared first on AlphaArchitect
Smart beta (or factor investing) seems to be the product du jour in ETFs. There are so many different factor products available that just about every fund company seems to offer them…even Vanguard is launching their own suite of factor-based stock funds. Note that nearly all of these products are focused on stocks…not bonds.

Why the lack of factor love for fixed income instruments?
Fixed income seems to be the red-headed stepchild of factor investing and academic factor research! The earliest factor research that explores bonds was done by none other than Fama and French in 1993. Their core finding was that duration and credit were the core drivers of bond returns. The research on bond factors beyond this original FF 1993 paper, especially relative to the research on equity factors, is almost non-existent as far as I can tell. That said, fixed income factor investing research did receive some of its first love in 2013 with, “Value and Momentum Everywhere,” where fixed income factor returns (at least value and momentum) are shown to be attractive.(1) Justin Sibears at Newfound Research (in one of my favorite articles of 2017) shows that an investor can use factor investing in the municipal bond market in his post, “Smart Beta with Muni Bond ETFs.” Jordan Brooks and Dr. Moskowitz published “Yield Curve Premia,” which shows cross section fixed income factors are better predictors of returns than other yield curve based models. Finally, Corey Hoffstein at Newfound research published a great post just this week on using factors to time duration exposure in fixed income. I am not aware of much additional research beyond a couple of client educational papers published by AQR (the additional research focuses on CUSIP level bond selection factors which would be difficult for the average investor to exploit on their own).
Perhaps the most surprising revelation to me is that the recent research which shows that many active managers simply exploit the term and credit risk factors and Justin Sibers shows that (of the funds they looked at) municipal bond funds don’t exploit factors in fixed income.
I hope to add my thoughts to the fixed income factor research by showing that factor investing exists in credit sector selection and that even a very simple factor strategy can potentially harvest those factors.
Data
I use Bloomberg Barclays fixed income indices for this analysis (both yield and total returns). The specific indices used are as follows:
The results are hypothetical results and are NOT an indicator of future results and do NOT represent returns that any investor actually attained. Indexes are unmanaged, do not reflect management or trading fees, and one cannot invest directly in an index.
To calculate real yields I use inflation expectations over various horizons from the Cleveland Federal Reserve inflation expectation data (available here). Specifically, I use the 2-year expected inflation for short-term bonds, I use the 7-year inflation expectation for intermediate-term bonds and I use the 15-year inflation expectation for long-term bonds. I use expected inflation to calculate real yield because inflation expectations have a term structure and therefore a 2-year bond and a 30-year bond could trade at very different nominal yields but have the same real yield. For example, in January 2009, the nominal yield on the BloombergBarclays Corporate Bond 1-5 Year index was 6.6% but had a real yield (using 2-year expected inflation) of 5.6%. In the same month, BloombergBarclays Corporate 10+ Year Corporate Bond Index had a nominal yield of 6.96% (greater than the short-term bond index nominal yield) but had a real yield of 5.17% (less than the real yield of the short-term bond index).
Each index has a unique starting date, but data is available for all indices starting in 1995. Therefore, it takes until 2002 to have enough data to calculate the 5-year Z-scores and the 2-year averages (more below).
Factor Definition Methodology
With respect to fixed income, real yield is generally accepted as the measure of value. Because this analysis uses bonds of varying degrees of credit risks, one shouldn’t blindly compare the real yield of different bond sectors as if they have similar credit risk (for a similar discussion on stock valuation I suggest you start reading some of Lawrence Hamtil’s blog posts).
To account for the differences in credit risk, I calculate a yield Z-Score for each index (the current real yield is compared to the 5-year average real yield for the same index and the difference of the two is divided by the standard deviation of the real yield over the 5-year period of time). In this way, we can compare each bond with how cheap or expensive it is compared to its recent history. This is largely consistent with other valuation methodologies in research where a 5-year return reversal is used.
As an example of how this is done, in January 2009 the BloombergBarclays Corporate Bond 1-5 Year index had a real yield of 5.6% and its average real yield over the previous 60 months was 2.62%. Over this same time period, the real yield had an annualized standard deviation of 4.45%. The Z-Score for January 2009 is then (5.6%-2.62%)/4.45% = 2.42. This means that the index appears to be 2.42 “standard deviations” cheap compared to its 5-year average.
Momentum is (thankfully) much easier to calculate, where I use the trailing 12-month return for each index.
Factor Long/Short Portfolios
I attempt to follow academic research convention by creating long/short portfolios of the bond indices where the long portfolio consists of the average of the three bond sectors that rank highest on the desired attribute, the middle two sectors are ignored and the average of the bottom three bond sectors constitute the short portfolio. In this way, the long/short portfolios are dollar neutral.
For value, the average of the prior two years of Z-scores are used to rank each sector to create the long/short portfolios. The two years of Z-scores are used so that the value portfolio is tranched so that timing luck and turnover are reduced. For momentum, the trailing twelve-month return is used to rank portfolios. This is a very similar methodology that Justin Sibears used in his post.
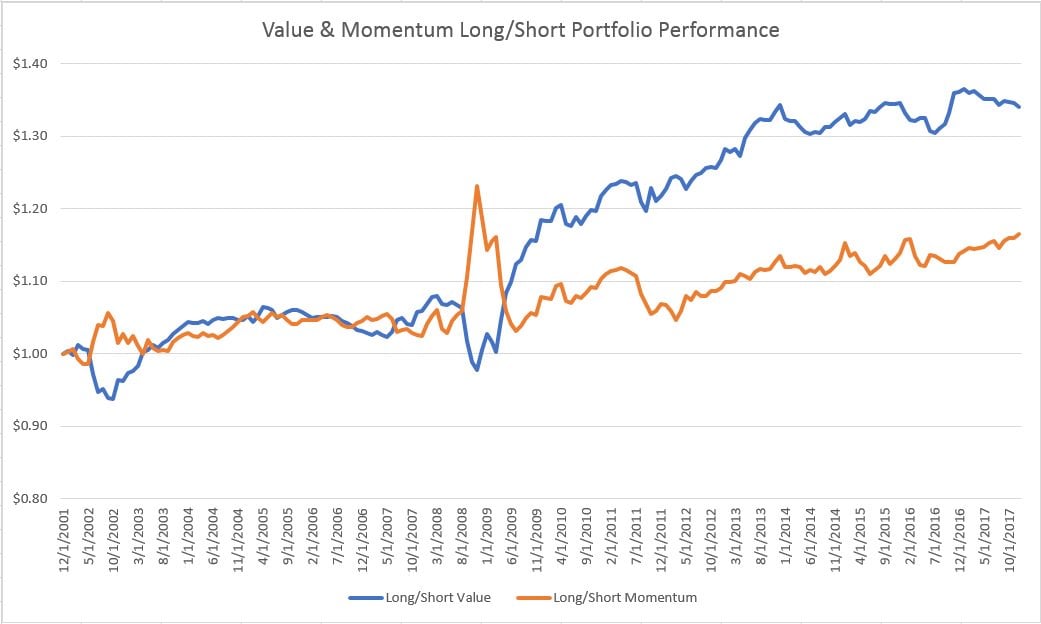
Below is a graph of the performance of the long/short dollar neutral portfolio for each factor:
The results are hypothetical results and are NOT an indicator of future results and do NOT represent returns that any investor actually attained. Indexes are unmanaged, do not reflect management or trading fees, and one cannot invest directly in an index.
The summary statistics for the series are shown below:

The results are hypothetical results and are NOT an indicator of future results and do NOT represent returns that any investor actually attained. Indexes are unmanaged, do not reflect management or trading fees, and one cannot invest directly in an index.
One can see from the graph and chart, above, value and momentum factors in fixed income have positive (gross) returns and are also negatively correlated…these are very similar (although less impressive) results to value and momentum in equity markets. Nice to see the robustness of the result we’ve seen over and over again. One interesting difference is that the long/short return for value is almost twice as large as momentum in the fixed income markets…perhaps it’s just better to be a value investor in fixed income?
Regression Analysis of Long/Short Factors
The next natural question is as follows: Are these results actually value and momentum in fixed income markets or are these results something new/different? Thankfully, the fine folks at AQR have published the various return series from their Value and Momentum Everywhere paper and made the return series available for download here.
Below, I run a regression analysis of the long/short value factor I’ve created against the AQR fixed income value factor from their website. The regression results are below:
The results are hypothetical results and are NOT an indicator of future results and do NOT represent returns that any investor actually attained. Indexes are unmanaged, do not reflect management or trading fees, and one cannot invest directly in an index.
This analysis shows that this version of the value factor isn’t the same as AQR’s (the r-squared is only 5%), however, they are clearly related, as this value factor has a 0.31 beta and a 2.9 t-stat.
I do the same analysis for the momentum portfolio with the results below:
The results are hypothetical results and are NOT an indicator of future results and do NOT represent returns that any investor actually attained. Indexes are unmanaged, do not reflect management or trading fees, and one cannot invest directly in an index.
The results for the momentum regression are very similar as the regression analysis for value – this version of fixed income momentum isn’t the same as AQR’s with an r-squared of only 1.3%, but it has a 0.19 beta to AQR’s momentum factor with a 1.58 t-stat.
It is not surprising that these long/short fixed income factors are related, but not highly correlated, to the value and momentum results in Value and Momentum Everywhere, as the fixed income markets used in Value and Momentum Everywhere are ten global government bonds as opposed to a swath of bond sectors from a single country.
Long Only Implementation
Long/short factors are interesting and show that a particular strategy “works,” but is it possible to use fixed income factors for a traditional long-only investor? You bet! As Sam Lee (in this blog post) and Corey Hoffstein (in this blog post) remind us, every deviation from a benchmark is a combination of the benchmark + a long/short portfolio. What this means is that we can start with a benchmark and simply add or subtract the long/short factor exposure.
To test this, we build a benchmark that is simply the equal-weighted average of all eight sectors that were used in the analysis. The long-only factor fixed income portfolio is then the benchmark + the average weight of the value and momentum portfolio.
For example, if both the value portfolio and the momentum portfolio would be short-intermediate term investment grade sector then it would be completely avoided in the long-only portfolio and its weight would be used elsewhere. If the value and momentum long/short portfolio were giving a mixed signal to a fixed income sector then it would receive a neutral weight (same as the benchmark). If both the value and momentum long/short portfolio would be long the intermediate term investment grade sector, the long-only factor portfolio would be overweight that particular fixed income sector.
Does this strategy work?
Below, I show the graph of the long-only fixed income factor portfolio vs. the equal-weighted benchmark:
The results are hypothetical results and are NOT an indicator of future results and do NOT represent returns that any investor actually attained. Indexes are unmanaged, do not reflect management or trading fees, and one cannot invest directly in an index.
The following is a brief summary statistics for the two portfolios:
The results are hypothetical results and are NOT an indicator of future results and do NOT represent returns that any investor actually attained. Indexes are unmanaged, do not reflect management or trading fees, and one cannot invest directly in an index.
As you can see from the summary stats above, even the long-only factor portfolio has an excess return with a similar volatility of the benchmark. In addition, the long-only factor portfolio generates a (gross) alpha of 2% per year and has a 0.92 beta to the benchmark.
These results are interesting, but Corey Hoffstein (Corey and I corresponding regarding our blog posts as we both were independently writing about factors in bonds) asked a great question – Are these results due to implicitly timing interest rates (i.e., these factors were correctly changing the duration of the bond portfolio) or are they due to cross-sectional factors (i.e., picking bond sectors correctly while not correctly changing the duration of the portfolio)?
To determine the answer to this question, I estimated the duration of the Benchmark portfolio and the Long Only Factor portfolio and graphed them over time, below:
The results are hypothetical results and are NOT an indicator of future results and do NOT represent returns that any investor actually attained. Indexes are unmanaged, do not reflect management or trading fees, and one cannot invest directly in an index.
It should be clear from the graph above, that the Long Only Factor portfolio was, in fact, making very large interest rate bets.
The next step was to determine if these interest rate bets were the driver of returns or if the Long Only Factor Portfolio was successful in making cross-sectional bond selections. To determine the answer to this question, I created another portfolio where the bond sectors that were exhibiting positive factor characteristics were not equally weighted, but instead, duration weighted so that the ending portfolio had a duration equal to that of the benchmark each month (I realize this doesn’t eliminate interest rate risk entirely as it still leaves different curve kinks but it should be a good approximation). This change resulted in the following results:
The results are hypothetical results and are NOT an indicator of future results and do NOT represent returns that any investor actually attained. Indexes are unmanaged, do not reflect management or trading fees, and one cannot invest directly in an index.
Here are the summary stats for the Duration Equalized Factor portfolio:
The results are hypothetical results and are NOT an indicator of future results and do NOT represent returns that any investor actually attained. Indexes are unmanaged, do not reflect management or trading fees, and one cannot invest directly in an index.
As you can see from the results above, the Duration Equalized performance does decline when interest rate bets are removed but the majority of the (gross) outperformance remains. This would seem to indicate that the (gross) outperformance appears to be due to cross-sectional factors in fixed income markets (this conclusion would also be supported by the regression analysis which shows meaningful loadings on cross-sectional value and momentum in government bonds).
Conclusion
Factor investing in equities seems to get all the attention in both academic research and in the creation of investable products. However, value and momentum in fixed income markets appears to have all the desirable attributes (returns and low/negative correlation to each other) as factors in equities. Even using very simple factor definitions (please read Corey’s post on duration timing with factors to understand how one might construct a more complex factor methodology for fixed income), these results show that it might be possible to harvest fixed income factors for individual investors.
For those interested (and understanding that this is now almost a month out of date), the Long Only Factor portfolio (which is NOT neutralized for duration differences) would have the following allocation as of 12/31/17:
- 16.67% BloombergBarclays Corporate 1-5 Year
- 16.67% BloombergBarclays Corporate 10+ Year
- 16.67% BloombergBarclays High Yield
- 33.33% BloombergBarclays US High Yield 1-5 Year
- 16.67% BloombergBarclays Treasury 1-3 Year
- The views and opinions expressed herein are those of the author and do not necessarily reflect the views of Alpha Architect, its affiliates or its employees. Our full disclosures are available here. Definitions of common statistics used in our analysis are available here (towards the bottom).
- Join thousands of other readers and subscribe to our blog.
- This site provides NO information on our value ETFs or our momentum ETFs. Please refer to this site.
References
- Bai, Bali, and Wen have a new paper as well. Check it out here.


