“History never repeats itself, but it rhymes.” – Will Rogers
Dear fellow investors,
The singer, Prince, wrote about “partying like it’s 1999.” We can tell you that 1999 was no party unless you owned the most popular tech stocks and the hottest initial public offerings of the latest dot-com company. As we remember, value-oriented investors like us made little or no money in 1999 as the S&P 500 Index made 21.04% and the NASDAQ went berserk, gaining 86.13%. In the last month, our portfolio began to behave just like ones we ran back then. The market participants wanted Microsoft, Cisco and Intel, if they were conservative, at 60-110 times earnings. Or if they were aggressive, they wanted Lucent, Sun Microsystems or GeoCities. The companies we owned spent a whole year getting no buying interest or were being net liquidated.

Q4 hedge fund letters, conference, scoops etc
Since we want to stay invested in good-quality common stocks for ten years or longer, we thought we would run you through the charts and graphs which compare today to 1999. After the party, came the hangover. Even the most conservative growth and tech names suffered permanent damage in the bear market which followed from 2000-2003. However, value folks ended with either minimal losses and/or significant gains in many cases. On top of the damage which was wrought on investors from an 80% decline in the tech-dominated NASDAQ during the bear market of 2000-2003, insult was added to injury. Microsoft was the big winner because it got even in 16 years. Many of the popular stocks back then are dead and gone or have yet to exceed their 2000 high 19 years later.
Here are some rhymes to 1999, that taken together, may look more like a poem:
- Flattening yield curve: The spread in interest rates between 2-year and 10-year Treasuries compressed from +0.79% in October of 1998 to -0.56% by April of 2000. While we haven’t inverted that part of the yield curve today, it has compressed from +1.78% in July of 2015 to a paltry +0.11% as we write. Inversion or not, today’s market seems myopically focused on impending recession, which became the reality coming out of the last major tech-boom of our lifetimes.
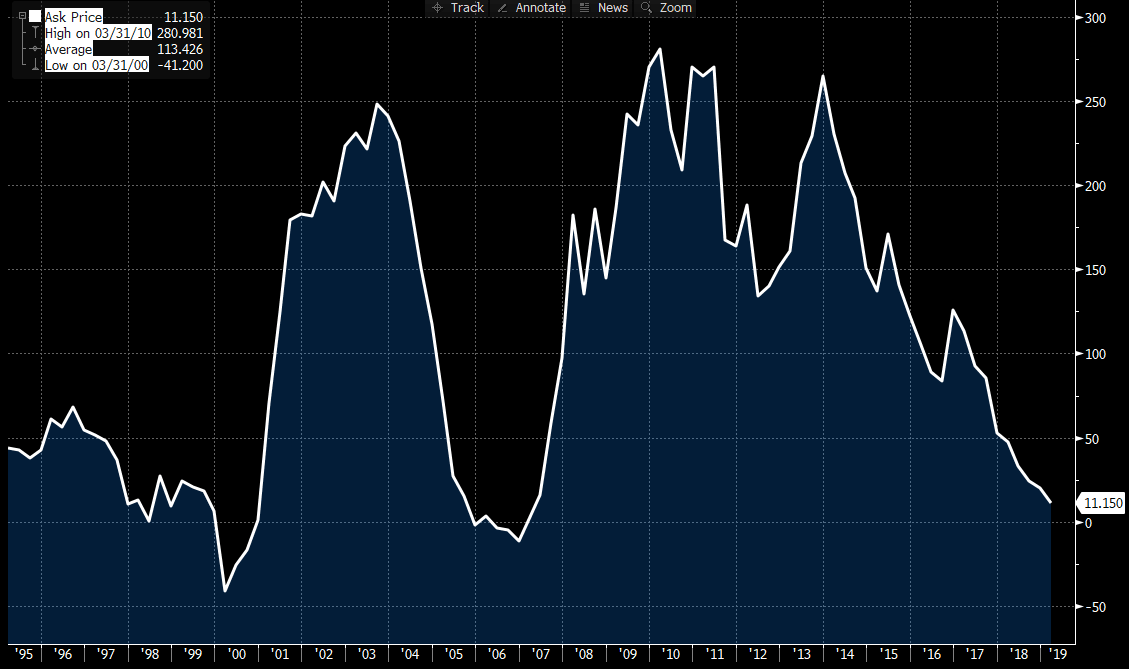
Source: Bloomberg.
- Yield curve inversion: Well, not really. It depends on what part of the yield curve you want to look at, but a lot of folks today are pointing to the short-to-medium area. If you look at the spreads between the 2 or 3-year bonds vs. the 5-years, we’re now inverted. This has scared the markets and rhymes with 1999, as well as several other times surrounding recessions and periods of economic weakness. Never mind the fact that it is also a patently lousy metric to predict recessions, as the below chart tells you.

Source: Fundstrat.
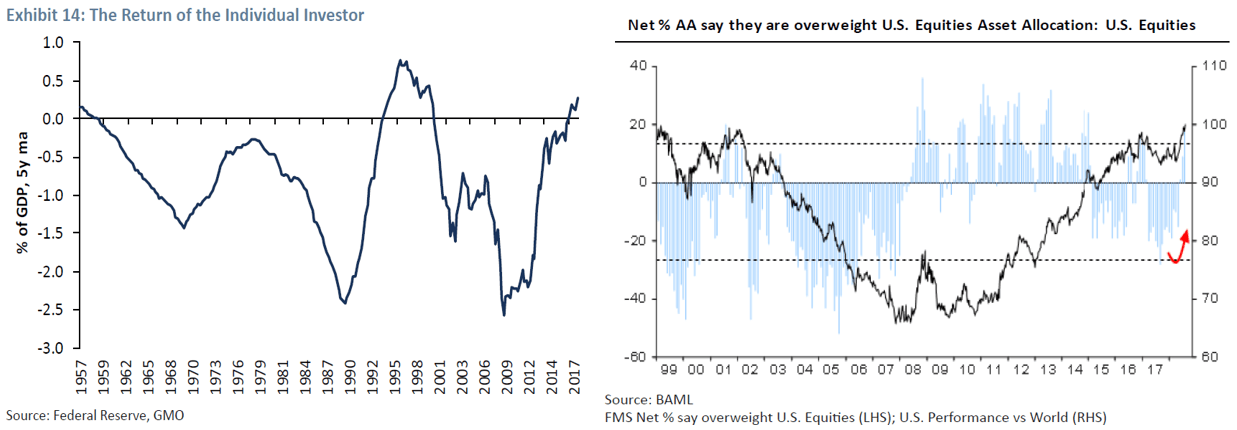
- Return of the individual investor and asset allocator to equities: need we say more? The numbers here seem to tell a scary story, despite the fact that sentiment polls indicate that many are still not bullish. If you look at what they’re doing and not what they’re saying, we might be at the April 10, 2000 peak where the last tech bubble popped. However, we’re certainly begging for trouble in relation to five to ten-year returns, if history is any guide.
- Today we have more firms in the Russell 3000 Index, outside of the peaks of 1999 and the global financial crisis, that make no profit. We also have the largest percent of initial public offerings (IPOs) which are unprofitable companies, outside of 1999. In the case of 1999, it was mostly a valuation bubble that tolerated these money-losing companies. Today, there is plenty of that, but it is exacerbated by persistently and historically low costs of capital that has forgotten to demand a return on investment in the form of earnings and free cash flow.

- On a 40-year lookback, there has never been a time where growth investing has beaten value by such extremes other than 1999 and today. At this juncture, we’ve never had this kind of divergence last this long or by this magnitude, since these factors have been tracked going back to 1929. The extremes reached in 1999 were built in a five-year stretch, whereas today, it has persisted for more than ten. The reversion to the mean from 2000 to 2003 was dramatic for any value investor that stood against the misallocation of the years prior.
- The overvaluation and misallocation to top-line revenue growth stories has never been greater than the last tech boom of the late 90’s. Currently, roughly 12% of the Russell 3000 Index securities that trade at or higher than 10x price-to-sales. To give this perspective, imagine that these ~330 companies could ever attain the roughly 10% net margins of today’s average S&P 500 stock. This implies you are paying at least 100x price to earnings, if earnings ever show up at all.

- Sentiment towards value investing is at historic lows. The below chart shows how incredibly rare it is to have a 10-year lookback on the market where value has underperformed. The first such period since 1926 was very brief but took place in 1999. Today we’ve had such a long and clear rear-view mirror in this regard, that nearly no one believes it has efficacy anymore. Hence, nearly half of liquid equity holdings have migrated towards passive index funds and we’re reading articles about the death of value investing every week.

- The equity bubble of today is simply a redux of 1999’s, involving some of the same securities. Similar to 1999, few that are involved are recognizing it as a bubble. As example, it is a statistical aberration to note that every single analyst on Wall Street that covers Amazon has a “buy” or “strong buy” rating on the stock. There is not a single dissenter on the name. Everyone agrees, and over time they have been rewarded for doing so. This is not normal and is anecdotal to the later stages of a bubble.

- NYSE member margin balances are at record levels. This may be symptomatic to where the individual investors and asset allocators are leaning, but it still rhymes with other peaks of enthusiasm and complacency.
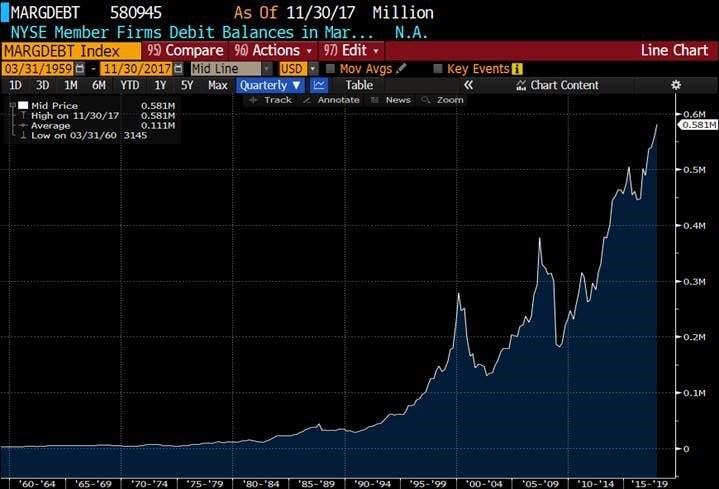
Source: Bloomberg.
- Market capitalization to gross domestic product (GDP), one of Warren Buffett’s indicators of market peaks, is nearly at 1999 levels.
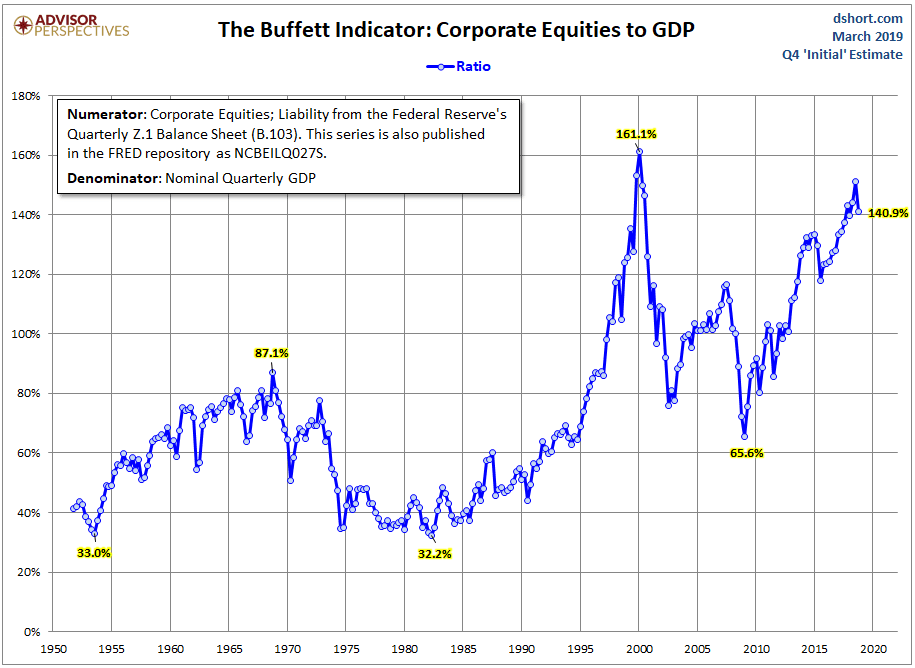
Source: Advisor Perspectives.
We don’t want to be some kind of a negative nabob, but it looks to us like avoiding popular common stocks and emphasizing deeply out-of-favor sectors and industries could offer significant outperformance the next five years. We like low price-to-free cash flow names like Target (TGT), Discovery Inc. (DISCA), Walgreens (WBA) and American Express (AXP). We believe the economy will surprise to the upside the next five years and the cost of capital will ultimately rise. About the only thing left to do in this cycle is to bring unicorn companies like Pinterest, Lyft and Uber to the public markets. Since that appears to be in the process, we at Smead Capital Management remind our readers that there is some money we just don’t want to make, and this environment so far in 2019 looks like 1999 to us!
Warm regards,
William Smead
Tony Scherrer, CFA
The information contained in this missive represents Smead Capital Management’s opinions, and should not be construed as personalized or individualized investment advice and are subject to change. Past performance is no guarantee of future results. Bill Smead, CIO and CEO, and Tony Scherrer, CFA, Director of Research, wrote this article. It should not be assumed that investing in any securities mentioned above will or will not be profitable. Portfolio composition is subject to change at any time and references to specific securities, industries and sectors in this letter are not recommendations to purchase or sell any particular security. Current and future portfolio holdings are subject to risk. In preparing this document, SCM has relied upon and assumed, without independent verification, the accuracy and completeness of all information available from public sources. A list of all recommendations made by Smead Capital Management within the past twelve-month period is available upon request.
©2019 Smead Capital Management, Inc. All rights reserved.
This Missive and others are available at www.smeadcap.com.


