
In his Weekend Reading Notes to investors, while commenting on the Big Money Index, Louis Navellier wrote:

Q1 2021 hedge fund letters, conferences and more
Yellow Traffic Lights And Human Behavior
Odd as it may seem, I think yellow traffic lights sum up human behavior perfectly. When lights at intersections rolled out in 1868, yellow wasn’t part of the plan. In fact, yellow lights didn’t exist until 1920. A Detroit police officer named William Potts introduced them to warn drivers of a coming red light.
Here’s how the yellow warning light perfectly profiles our human nature: Most people’s eyes glaze over when faced with calculating risk assessment, but when it comes to zipping through a yellow light, people engage in rapid and rigorous risk assessment:
- How many cars are at the intersection?
- Are they stopped?
- Is it rush hour?
- Are cars quickly coming from the perpendicular road?
- Are there cops around?
- How fast am I going?
- If I accelerate, will I make it in time?
- How late am I for my next appointment?
- Are there pedestrians present?
Then, most of us gun it anyway, and fly through, just as it turns red. The satisfaction of surviving this adventure, un-arrested, is undeniable.
Patience In Investing Or Traffic
But among investors, risk assessment tends to be less rigorous. Most investors let someone else, their financial advisor, drive. Hopefully, they pick safe drivers, especially as they approach some “deep amber” lights turning red.
Patience doesn't come naturally for most of us whether it's traffic or investing. We just want to get there now – or at least as fast as possible. Patience pays great dividends… over time, of course
Like much in life, the older I get, the more I realize that patience is usually the best course. That’s why I dig deep into the data to give me as clear a picture as I can get. This process leads me to “outlier” stocks, the 4% of stocks that account for 100% of the market’s gains over bonds for the last 100 years.
Sometimes when all is humming along, I focus on stocks. Other times I focus on the big picture – the Big Money Index to be more precise. Right now, it’s rising, suggesting it might be worth gunning through the yellow light the market is flashing.
But does it, really? Let’s see why the Big Money Index says stocks are on the rise . . . and why this rise may continue.
30+ Year Chart Of The Big Money Index
Here we find a 30+ year chart of the Big Money Index (BMI for short). Naturally, it doesn’t tell us much at first glance. And if I plot an index over it for 30 years, the time frame is too zoomed out to see anything meaningful. After all, the S&P 500 rose over 1,000% (1,048%, to be precise) in that time.
So, I dug into the data, because that’s what nerds do.
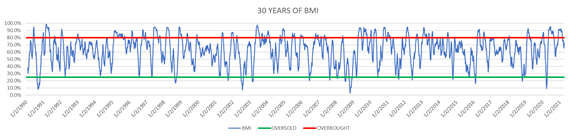
You don’t need to do the math. I did it for you.
What we can tell from that chart is that the BMI spent a vast majority of its time in the middle, between overbought and oversold. Out of 7,876 trading days (31-¼ years) the BMI was overbought 1,565 days – or 20% of the time. The BMI was oversold for only 292 days, or just 3.7% of the time. Those rare oversold instances are the golden tickets. That’s when you need to prepare to load up on outlier stocks.
Now, back to my question: Just because the BMI is rising, should we expect rising stock prices? It makes sense that we would, I mean, as big money rushes into stocks, they should go up on balance, right?
What I found was fascinating:
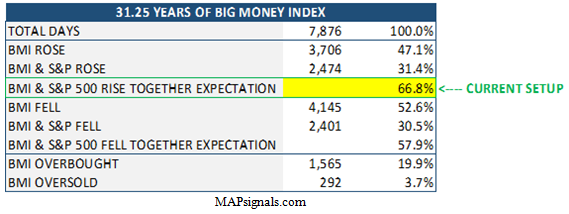
For 31-¼ years (7,876 days), the BMI rose for 3,706 days. That’s less than half the time, at 47%! But what’s eye catching is that on BMI up days, the S&P 500 also rose 67% of that time (2,474 days).
In contrast, the BMI fell 53% of the 31-year span (4,145 days). And on days where it fell, the index fell with it for 2,401 of those days or 58% of the time.
Fast forward to 2021. So far, the BMI only spent 25 of 67 days rising, or 37%.
Lastly, let’s take into account that the 31.25-year average for the BMI is 63%.
So where are we?
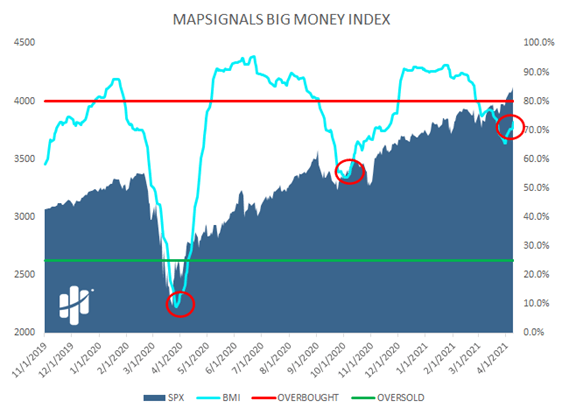
This year so far, the BMI is below average in terms of time spent rising. But it is rising now. And as it rises, we can expect nearly 70% of the time that stocks will rise too.
It's Time To Be Bullish
Now before you skeptically tell me that “indexes usually go up,” check this out. The S&P 500 index rose only 53.5% of the time or 4,218 days of a possible 7,876. Those are good odds for a casino, but hardly great odds when assessing flying through a yellow light unharmed.
But a 70% chance that stocks rise? Those are great odds in the market. Right now, the BMI says higher highs are coming. And my approach is to find the leaders – or outliers that do even better than the market.
Nothing is certain, but using BMI history as a guide, it’s time to be bullish. The light is turning green.
Humans risk life on a split-second probability check, but we can be paralyzed when it comes to money. It seems like our priorities when it comes to money would be to be patient and purposeful and to prioritize.
As Stephen Covey put it, “The key is not to prioritize what’s on your schedule, but to schedule your priorities.”


