Reading Information Correctly
Every week, the precious metals market sees such a number of data points that it would be impossible to put an exact number on them. This is due to the basis of the market itself, which is the sum of billions of those who participate in it and even those who don’t. This number of people is made up of individuals who all believe, think, and typically err on the side of caution in order to protect their investment. Even with this shared similarity, they ultimately behave in a mostly unique ways.
If we were to attempt to pinpoint these various reasonings from all of these people who are located all over the world it would inevitably lead to information overload. The market is comprised of a massive number of people buying and selling gold, silver, currencies, stocks, and bonds. It is our belief that such an amount of information overload could be even worse than information “underload”.
To avoid this pitfall, we focus on the creation of charts that encompass the specific data point that matters the most and shows the place where all of the billions of participants come together, which can be summed up simply into the price. Whether you are a stacker, trader, investor, manipulator, spectator, or regulator, all sides come together on the price. Price gives us the total of all those decisions being made at any given point in time. We will not always agree with that total, and in fact, our making a profit is based off disagreeing with it, but it is undeniably the most powerful piece of information.
We make the study of technical analysis focus on price, as that is what we consider to be the most crucial element. This focus allows us to put on our blinders and avoid being bogged down by the incredible amount of extraneous data involved in this market.
You will notice that a portion of our posts will look at fundamental analyses, but you can rest assured that these are posted to help explain our chart observations and not vice versa.
Update on Gold
To wrap up the week in sum, gold closed as of final trade on New York COMEX at $1333, a value that decreased by $2, or 0.1%. Keep in mind that COMEX is always a futures market, so it is expected for spot prices to be a couple dollars behind its prices, and physical prices will always have a 3% increase or more, depending on the specific product.
It is absolutely our expectation that an interim peak is in the process of forming and from this a decline that should bring gold back to within the zone in green shown on the chart below. We expect this to occur by late Q1 or early Q2.
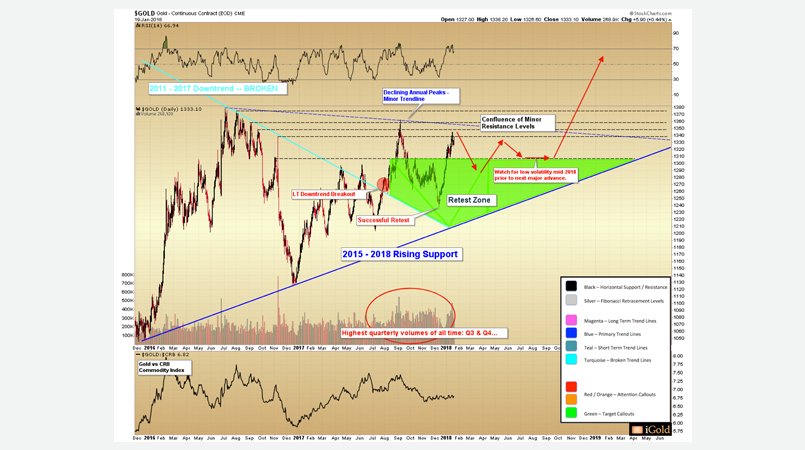
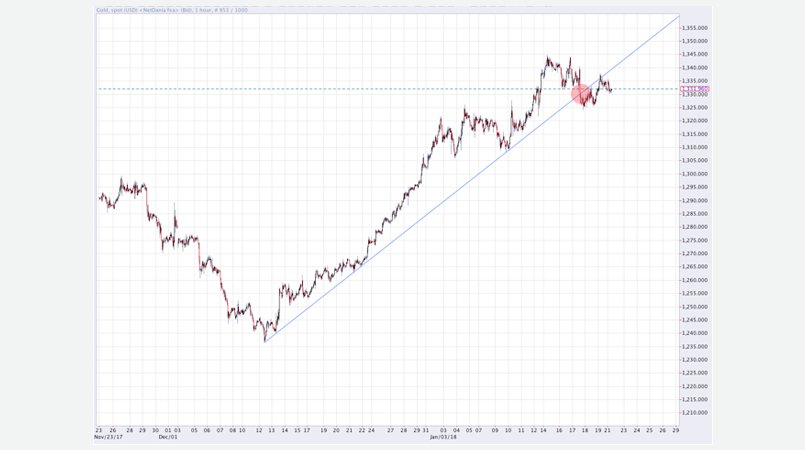
To take a look at the very near future, we are seeing signs of the top settling in through a break below the increasing trendline which set out the advance from the bottom reached in December. If you take a look at the red on the chart, you can see how gold broke the trend on January 17th to retest it from the lower side on the 19th, unsuccessfully. Although gold could remain close to this broken trend and creep higher, the signature generally marks the transition to interim peaks:
Knowing all of this we are able to determine the Fibonacci retracement levels, including the entire advance reached in December and January, and use this to point out possible targets within the upcoming retracement. Take a look at the graph below and note the silver, this is the space to watch.
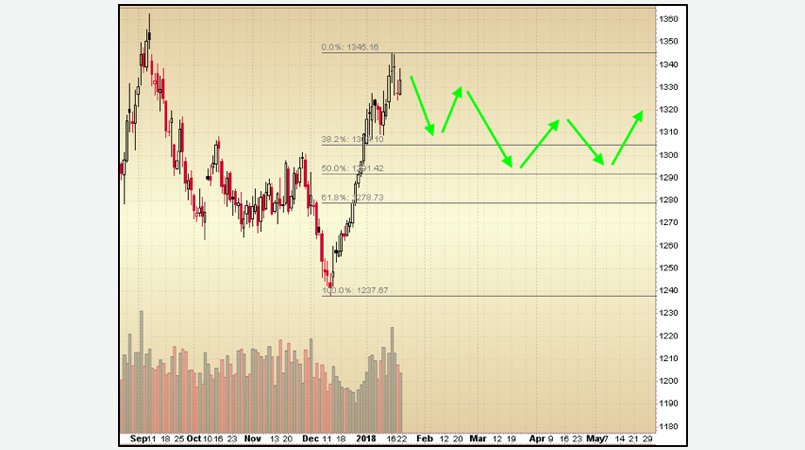
- 38.2% retracement: $1304
- 50% retracement: $1291
- 61.8% retracement: $1279
Breaking Down the Change in Gold’s Disposition
One last technical note to leave you on for the week: since the low reached in 2015, gold, on average, has experienced a series of large advances and quick corrections every one to three months. This series has left a number of investors suffering from whiplash, and unable to continue their participation in this volatile market.
Traders must learn to expect these price swings every few months, it is the nature of the market. However, it is also important to know that as soon as you expect something to happen in the market, a surprise is probably waiting for you around the corner. One possibility is that this surprise could be a lower volatility for the precious metal.
An example of this would be that we know that in a correction it is possible for gold to fall back to the 50% Fibonacci retracement ($1291) in the slow, creeping manner that we’ve seen recently instead of a quick fall followed by a rebound. Another likely possibility is a pending low featuring a steady advance.
If you are a short-term trader, think on this information. It is possible that we may see fewer tradable highs and lows in the coming quarters, especially when compared to the last two years.
Gold: Takeaway
This market has experienced significant surges and retracements over the course of the past three years. Market behavior is not something you can count on to continue on the same course. As soon as you make a prediction for a new high or low to be reached it could be the point when gold breaks out of its recent behavior and surprises you. This is evidenced by the significant break of the highs reached in 2016 that we fully expect to occur later this year.