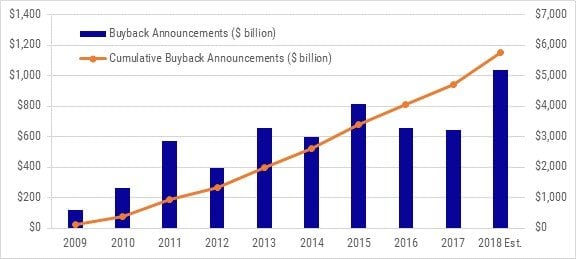
2018 has been a record-setting year for buyback announcements. As of December 6th, U.S. companies have announced $969.93 billion in buyback authorizations, the most for any year on record. As we near the $1 trillion mark, there are no signs of slowing down. In fact, data indicates that we may be in for another strong year of buyback authorizations in 2019.
The last set record for buyback authorizations was in 2015, at just over $800 billion. We surpassed that number in October of this year and it is still continuing to accumulate as of this mid-December writing. As such, estimates for 2018 now stand at just over $1 trillion ($1,040 billion). 2018’s volume will endure through to the next year for several reasons.

Q3 hedge fund letters, conference, scoops etc
First, the industries buoying buyback announcements this year have significant opportunity for expanded participation in the future. The technology sector, for example, led the way this year with $370 billion in announcements. Historically, tech stocks range from 14% to 30% of the overall year’s announcements. But with a more favorable buyback environment driven by tax reform and a steadily improving economy, we’re at 38% this year through November. This is also after an unusually slow start in October, and with Q4 on pace for the slowest quarter of the year due to the trade war rhetoric and its potential impact on technology stocks. As more clarity comes to this topic, it could be favorable towards this sector. Even if the trade war concerns drag on, the tailwinds for the technology sector should continue into 2019.
Financials and industrials have also been big drivers of buybacks in Q4. Companies like Wells Fargo for instance, which announced over $20 billion in buyback authorizations, bolstered the total amount of buybacks for the year. Like the technology sector, financials dropped in Q3 this year, only to bounce back this quarter. Industrials, on the other hand, have tracked an upward trend, with no signs of slowing down next year. This is likely driven by the fact that trade war concerns from earlier in the year created more opportunistic buyback opportunities that industrials companies can continue to leverage into next year.
| Buyback Amounts by Sector ($ billions) | |||||
| Q1 2018 | Q2 2018 | Q3 2018 | Q4 2018 | 2018 | |
| Information Technology | $62.5 | $154.5 | $110.4 | $43.0 | $370.4 |
| Financials | $30.3 | $124.7 | $6.1 | $39.2 | $200.3 |
| Health Care | $31.3 | $44.4 | $9.7 | $16.1 | $101.5 |
| Consumer Discretionary | $27.3 | $37.8 | $7.2 | $9.2 | $81.5 |
| Industrials | $7.8 | $13.2 | $20.3 | $21.7 | $63.0 |
| Consumer Staples | $27.1 | $19.5 | $2.6 | $3.0 | $52.2 |
| Communication Services | $11.2 | $27.9 | $1.0 | $0.3 | $40.4 |
| Energy | $8.5 | $3.8 | $13.7 | $2.7 | $28.7 |
| Materials | $3.2 | $7.6 | $4.9 | $7.9 | $23.6 |
| Real Estate | $3.3 | $1.4 | $0.4 | $0.8 | $5.9 |
| Utilities | $1.0 | $0.0 | $0.1 | $1.3 | $2.4 |
The trend of several large announcements, from a smaller number of companies, is another important influence on the future strength of buybacks. At the peak of buyback authorizations in 2015, 820 companies made a total of 1021 buyback authorizations. This equates to an average of 1.25 buybacks per company per year.
While 2018 holds a similar average – 1.27 – the number of companies making announcements was significantly less. 637 companies have made 809 announcements, compared to 2015’s 820 companies. Historically, it would have required about 1,300 buyback announcements to get to today’s $969 billion value, when in fact we’re only at about 60% of that number.
Furthermore, the actual number of companies announcing buybacks has also decreased, despite tax reform benefiting a significant number of companies. Out of all companies in the Russell 3000, only 637 have announced a buyback in 2018; again, lower than the number of companies per year in 2014-2016. The likelihood of additional companies considering authorizations next year, when some of the uncertainty clears, is high.
On average, buybacks per company per year dropped from 1.57 in 2011 to 1.13 in 2017. It has since moved back up to 1.27 in 2018. This represents the first upward trend in average buyback per company since 2010 and could also signify additional buyback opportunities in the future. Tax reform and repatriation have benefited some companies but others may still look to use buybacks if there’s a resolution for ongoing political concerns.
| Unique Companies | Total Announcements | Average/Company | Amount ($ billions) | |
| 2009 | 178 | 260 | 1.46 | $ 121.2 |
| 2010 | 335 | 449 | 1.34 | $ 260.7 |
| 2011 | 499 | 781 | 1.57 | $ 569.4 |
| 2012 | 509 | 791 | 1.55 | $ 393.2 |
| 2013 | 563 | 837 | 1.49 | $ 653.7 |
| 2014 | 726 | 959 | 1.32 | $ 599.2 |
| 2015 | 820 | 1021 | 1.25 | $ 813.4 |
| 2016 | 695 | 856 | 1.23 | $ 654.0 |
| 2017 | 584 | 662 | 1.13 | $ 643.4 |
| 2018 | 637 | 809 | 1.27 | $ 969.9 |
As this record-setting year for buybacks comes to a close, investors should expect continued growth in buyback authorizations. With excess cash on hands, companies will look for the best investment opportunities, and many may find that the repurchase of their own stock is in fact the best way to put that money to work.


