
Industry research has empirically proven different types of calendar anomalies. Most scholars have a difficult time rationalizing these phenomena, and many even dismiss them. In this series, we look to elaborate on these anomalies in the equity market and extend them into the options market.
We discussed the Day-of-the-Week effect in our last article, ”Examining Anomalies: Part 1 – What is the Best Day to Buy Stocks and Options?” and it’s natural to extend our research to investigate monthly anomalies.

Q3 2022 hedge fund letters, conferences and more
One of the main phenomena is the December effect (Santa Claus rally), where researchers believe the stock market tends to perform better in December than any other month of the year. Potential explanations include investor optimism fueled by holiday spirit, increased holiday shopping, or institutional investors going on vacation, leaving the market to retail investors who tend to be more bullish.
First, we aim to verify this phenomenon by utilizing OptionMetrics’ flagship IvyDB US database, which contains data for all exchange traded equities and derivatives since 1996. We calculate the monthly return of high market capitalization companies, such as Amazon, Tesla, Google, etc. starting from 2000.
Graph 1 shows the monthly average of equities return. As you can see on the right-hand side of the chart, the results dispel the Santa Clause rally narrative and, in fact, show that December typically has, on average, one of the lowest monthly returns.
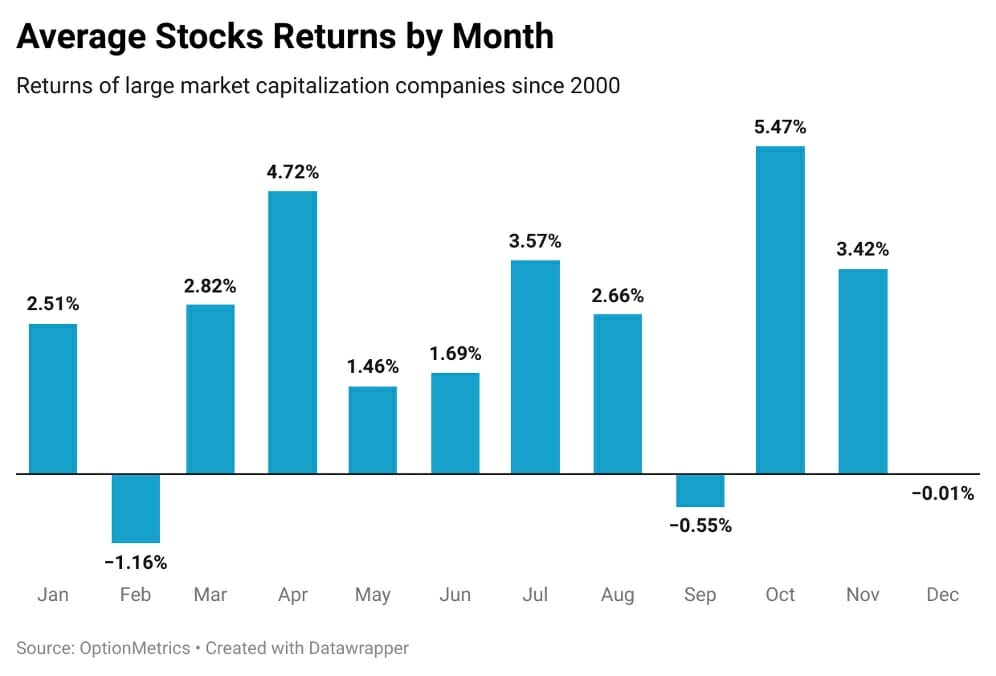
These results may also be used to highlight an interesting phenomenon: tax loss harvesting. Investors tend to intentionally trade positions at a loss at the end of the year in order to offset capital gains and decrease tax liabilities, commonly known as tax loss harvesting. This excessive closing of positions at the end of the year drives down returns, as selling pressure is high.
Is This Pattern Also Applicable In The Options Market?
For our study, we choose not to focus our attention on option returns, but instead on Variance Risk Premium (“VRP”). The realized VRP is calculated as the difference between implied volatility and realized volatility, and represents the premium investors are willing to pay for options.
Positive realized VRP represents implied volatility overestimated the actual volatility, meaning that volatility hedges were systematically overpriced and any long volatility positions were losers. Generally, the VRP is positive, but our goal is to understand whether the VRP is systematically higher during certain months. In Graph 2 below, we plot the average 30-day realized VRP on the SPY by month.
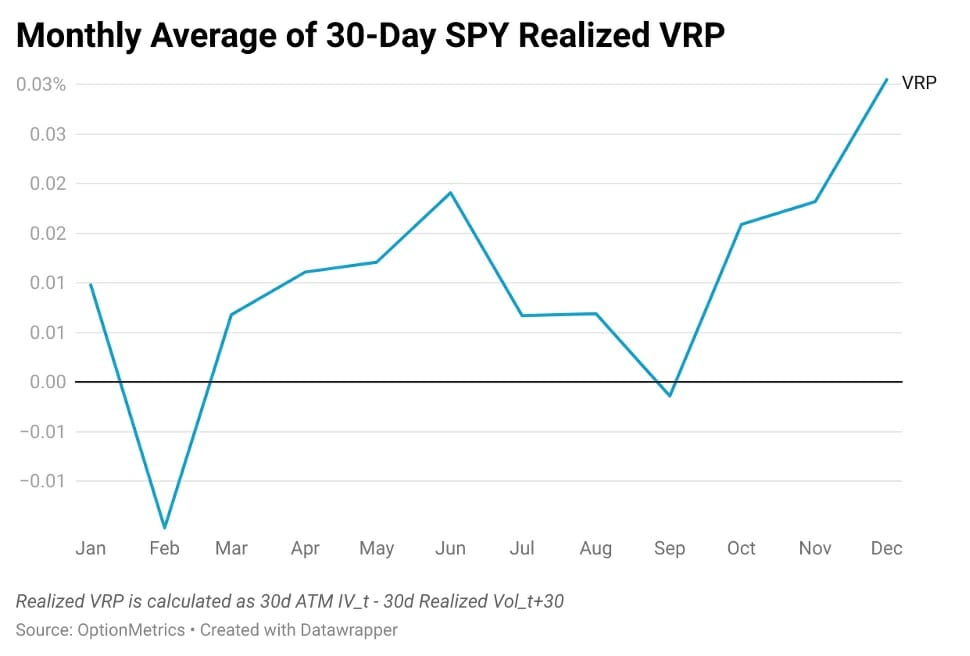
The results clearly show that realized VRP typically is highest in December, and usually increases as the year end approaches. Given that we have shown that December has, on average, one of the lowest monthly returns, we expect investors to utilize options to hedge downside risk.
A plausible explanation for a high realized VRP in December is that as investors hedge end of year volatility risk, market-makers increase premiums as a result of option demand, resulting in a high VRP. Investors may be able to potentially capitalize on this phenomenon by utilizing option strategies that sell volatility, such as straddles, in December.
From the research above, we can conclude that there is no true rally in the equity market towards the end of the year. There is, however, an increased demand for options towards the end of the year that leads to an increase in the VRP. Investors may potentially benefit from this overpricing of vol risk with instruments that take advantage of short volatility.
Article by Abhi Gupta, Anton Rotach, Oscar Shih, OptionMetrics
About the Author
Abhi Gupta, Anton Rotach, and Oscar Shih are with OptionMetrics, LLC. OptionMetrics is an options database and analytics provider for institutional and risk managers and academic researchers that has covered every U.S. strike and expiration option on over 10,000 underlying stocks and indices since 1996, in addition to providing databases for Europe, Asia and Canada and futures options data. It is online at www.optionmetrics.com.


