
Paul Gruenwald, S&P Global Ratings’ global chief economist, believes that sectoral GDP is a must-watch data point for 2021 and beyond as the COVID-19 recovery unfolds.

Q3 2020 hedge fund letters, conferences and more
While his full analysis is below, his main takeaways are fourfold:
- The unprecedented and uneven sectoral effects of the COVID-19 health shock and the likely structural changes over the coming years.
- The sectoral story also includes labor market outcomes as workers must reskill and relocate.
- Shifting credit outcomes, as changing sectoral fortunes mean shifts in profitability, credit quality, and firm survival and renewal.
- Firms will enter shrinking sectors and enter growing ones.
Oft-Overlooked Sectoral GDP is a Must Watch Indicator for 2021
Gross domestic product (GDP) is one of the most well-known and closely watched economic indicators. It aims to measure the amount of goods and services produced in an economy in a given time period.
Less well known is that there is more than one way to measure GDP. All measures should provide the same number, at least in theory; but owing to measurement error, this rarely happens.
The most common GDP measure is the expenditure approach: C + I + G + (X – M) = GDP.[i] We also have the income approach: wages plus profits.
The least utilized approach is sectoral or industry GDP. As its name suggests, this method builds up total GDP from the various sectors of the economy. It is also released much later than its more popular expenditure cousin. In the U.S., the sectoral GDP for a quarter is available at the same time as the third estimate of the expenditure-based GDP for the same quarter. For Q3 2020, these numbers were released in late December by the Bureau of Economic Analysis (BEA).
Despite being a bit of an also-ran in the world of economic indicators, we think that sectoral GDP is a must watch data point for 2021 and beyond the recovery unfolds: our latest global forecast is here. Given the unprecedented and uneven sectoral impact of the COVID-19 shock and the likely structural changes in the coming years, the sectoral story will be key. And this is not limited to GDP. The sectoral story also includes labor market outcomes as workers must reskill and relocate, and credit outcomes as changing sectoral fortunes mean shifts in profitability, credit quality and firm survival and renewal. The forces of creative destruction be at work as firms exit shrinking sectors and enter growing ones.
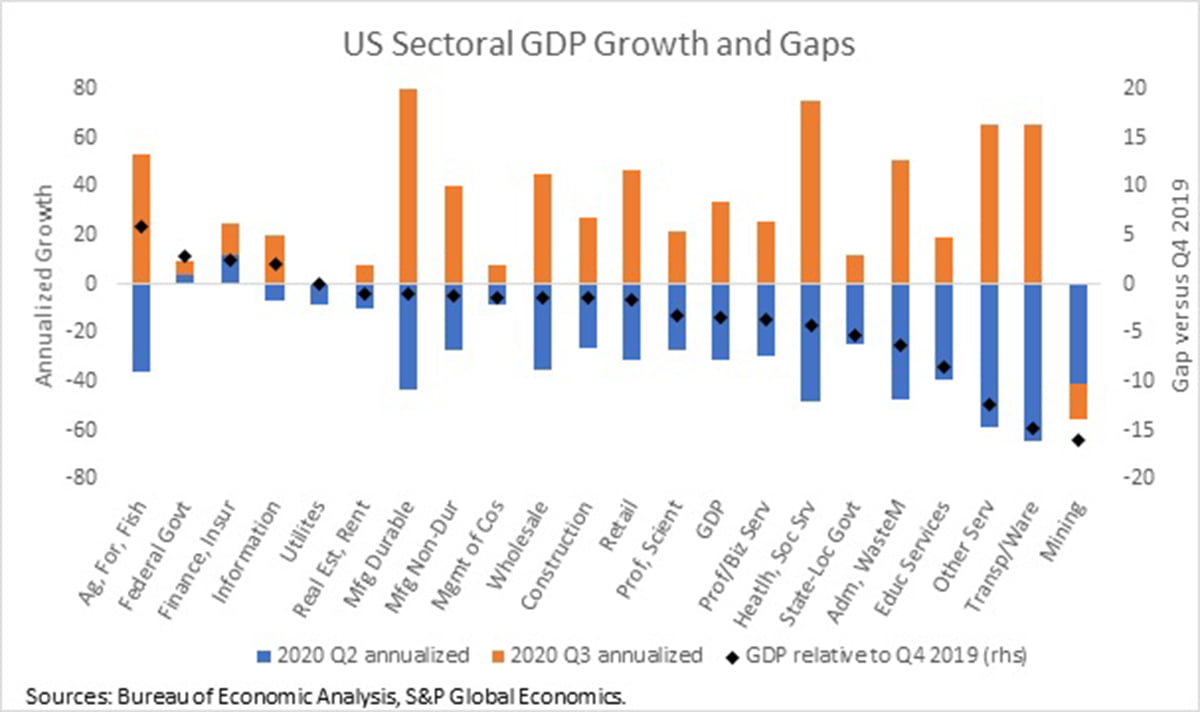
The chart shows the dramatic US sectoral GDP growth performance over the past two quarters.[ii] As we have argued elsewhere, levels matter more than growth rates in the current environment, so we have also calculated the gap in GDP in the most recent quarter versus the final quarter of 2019.
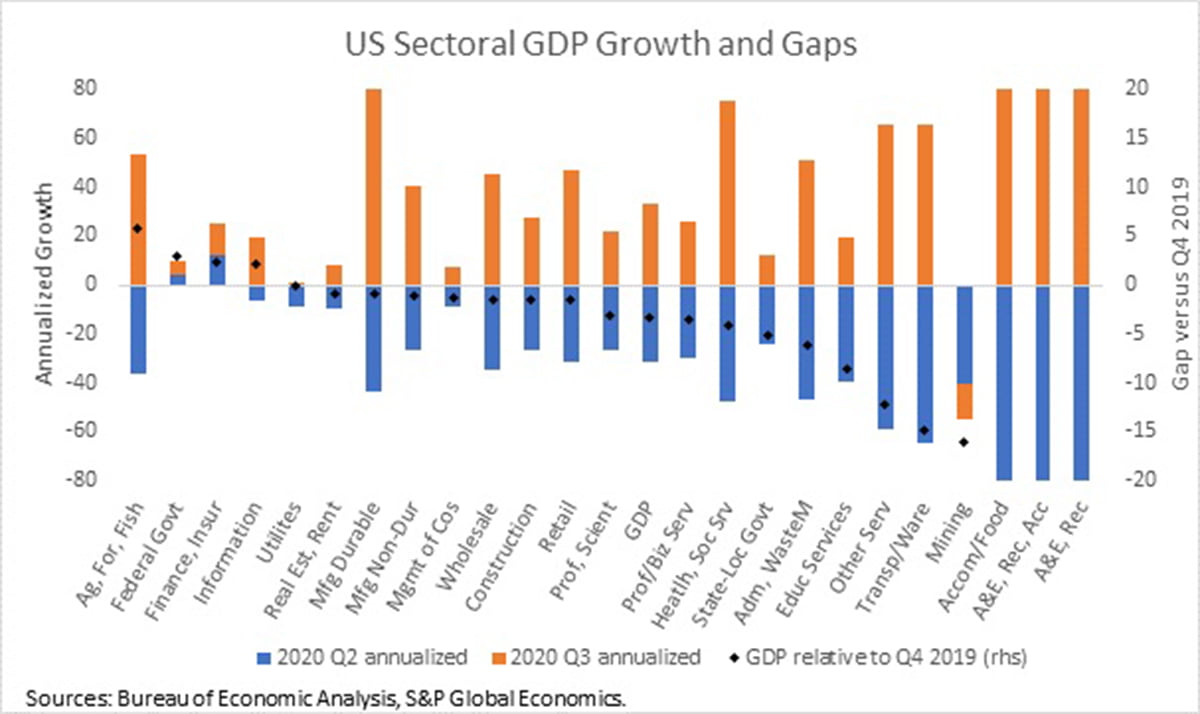
(The arts and entertainment, recreation and accommodation sector is omitted since it is literally off the chart.)
We have the following takeaways.
- Despite 33% annualized GDP growth in Q3, US output remains 3.4% below its pre-COVID level. BEA data also show that services continue to be hit harder than goods, which is atypical. Private sector goods GDP is 1.6% below its pre-COVID level while services GDP is 4.0% lower.
- The high beta (most sensitive) of all sectors is arts and entertainment, recreation and accommodation. Its GDP rose by a spectacular 333% in Q3 as lockdowns were eased. However, this followed a 92% drop in Q2, leaving the sector 28% below its pre-COVID GDP level.
- The other strong performing sectors in Q3 were durable goods (80% growth), health and social services (75%) and transport and warehousing (66%). Only the mining sector contracted in Q3.
- Only three of 21 private sectors have regained pre-COVID GDP levels: agriculture, forestry and fisheries (5.8% above pre-COVID GDP), finance and insurance (2.4%), and telecommunications (2.0%). At the low end are mining (16% below) and transport and warehouses (15%).
- In the public sector there is a big wedge between the federal government GDP at 2.9% above pre-COVID GDP levels and state and local governments at 5.2% below. For the latter, low tax revenues and (current account) balanced budget rules are constraining spending.
The issues for sectoral GDP in 2021 are twofold.
First, as the vaccines get distributed and mobility restrictions are eased (based on expert epidemiological advice we think this will happen around mid-year), how quickly will the most negatively impacted sectors return to something close to normal? Will those gaps be closed?
Second, as the economy moves into a post-COVID path, how will sectoral composition of GDP change or, equivalently, which sectors will grow faster than overall GDP in the transition to this path? We have identified these sectors in our work on the shape of the recovery.
Of all the available GDP measures, the sectoral method is best placed to answer these questions.
[1] C= Consumption, I = Investment, G = Government and (X – M) = Exports – Imports, or Net Exports. [1] Similar reports are available for other major economies and regions. The UK sector report is monthly and comes with the shortest lag.[i] C= Consumption, I = Investment, G = Government and (X – M) = Exports – Imports, or Net Exports. [ii] Similar reports are available for other major economies and regions. The UK sector report is monthly and comes with the shortest lag.


