A Survey of Pershing Square’s Security Selection and Market Timing via AbwInsights
Not all outperformance is true outperformance. There are many funds whose performance looks spectacular on the surface, but whose risk-adjusted performance is poor. This article takes a closer look at Pershing Square Capital Management, nominally one of the top performing funds throughout 2014 and over the long-term. We show that the risk-adjusted performance of Pershing’s reported long equity positions is, in fact, impressive. We also delve into sectors and factors behind these outstanding risk-adjusted results.
Risk-Adjusted Performance Defined
The AlphaBetaWorks (ABW) Performance Analytics Platform identifies risk-adjusted performanceas ??Return – performance relative to a passive replicating portfolio. ??Return consists of performance due to security selection (?Return) and market timing (?Return). ?Return is the return a fund would have generated if markets were flat. ?Return is the return a fund generated by varying its factor exposures.
Pershing Square – Risk-Adjusted Returns
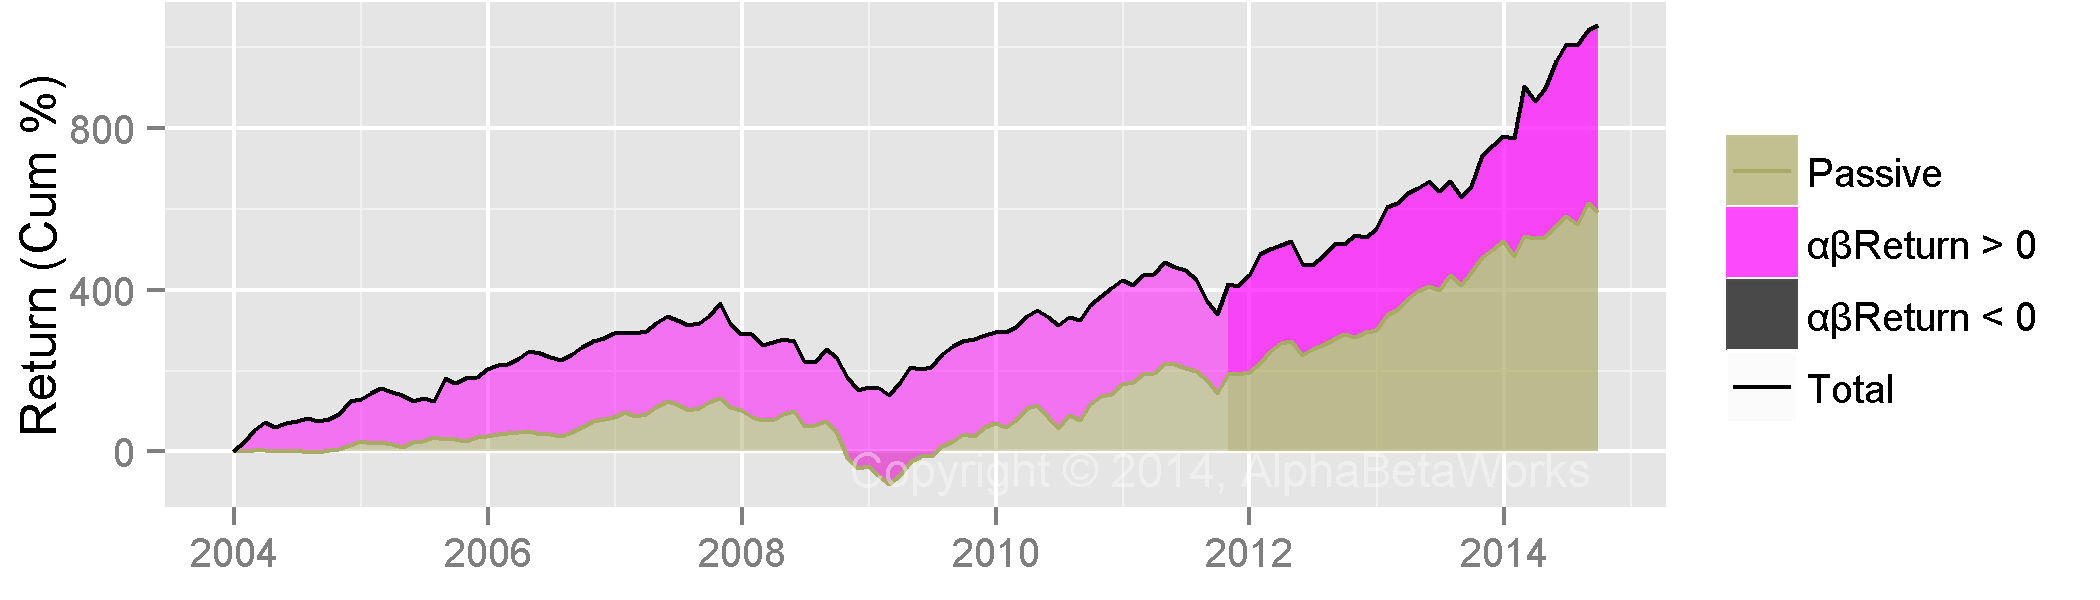
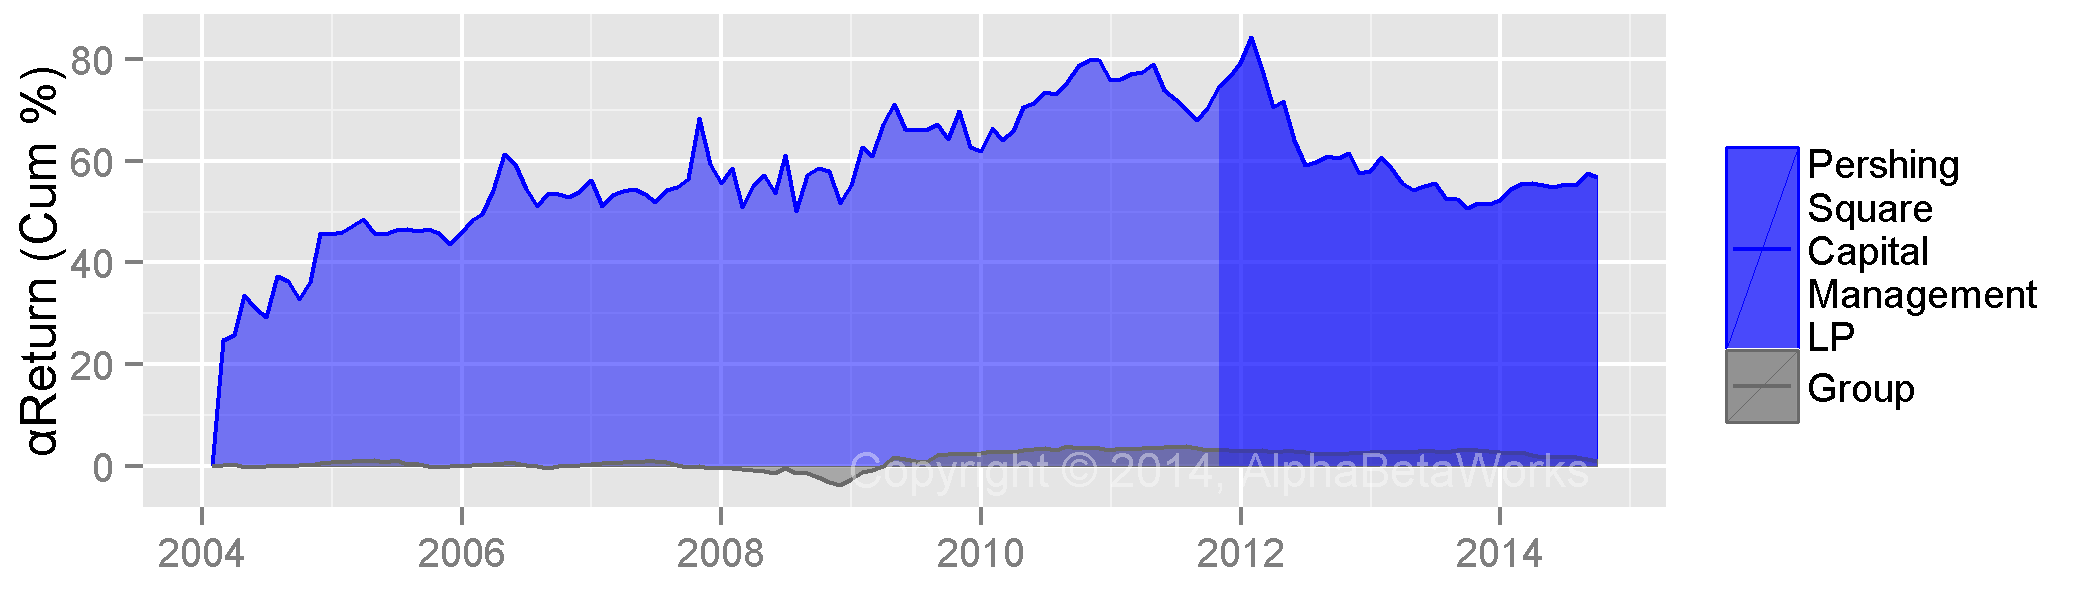
The fund’s 10-year long ??Return is around 300%, while passive long return is over 500%. Below we illustrate Pershing’s overall active return (??Return) and passive return over the past ten years. The purple area highlights cumulative positive active return; cumulative passive return is the gray area underneath:
Below we provide the components of Pershing’s estimated annual returns. Active returns (??Returns) are broken down into security selection, or stock picking, (?Return) and market timing (?Return). Most of the 2014 return is active: roughly two thirds from stock picking and one third from market timing.
| 2004 | 2005 | 2006 | 2007 | 2008 | 2009 | 2010 | 2011 | 2012 | 2013 | 2014 | |
| Total | 130.78 | 31.65 | 29.23 | -0.61 | -33.27 | 52.18 | 32.09 | 2.74 | 21.18 | 35.03 | 31.21 |
| Passive | 25.06 | 5.20 | 15.92 | 4.62 | -35.87 | 41.23 | 24.38 | 5.68 | 19.00 | 34.16 | 7.95 |
| ??Return | 105.72 | 26.45 | 13.31 | -5.23 | 2.60 | 10.94 | 7.71 | -2.94 | 2.17 | 0.87 | 23.26 |
| ?Return | 124.96 | 39.02 | 10.13 | -0.81 | 2.69 | 11.09 | 12.22 | -5.25 | -1.85 | -0.36 | 14.62 |
| ?Return | -19.24 | -12.57 | 3.19 | -4.42 | -0.09 | -0.15 | -4.51 | 2.31 | 4.02 | 1.24 | 8.63 |
We will now delve deeper into the sources of Pershing’s high risk-adjusted returns – the sectors and the factors that contributed most to ??Return.
Pershing Square – Long Equity Security Selection
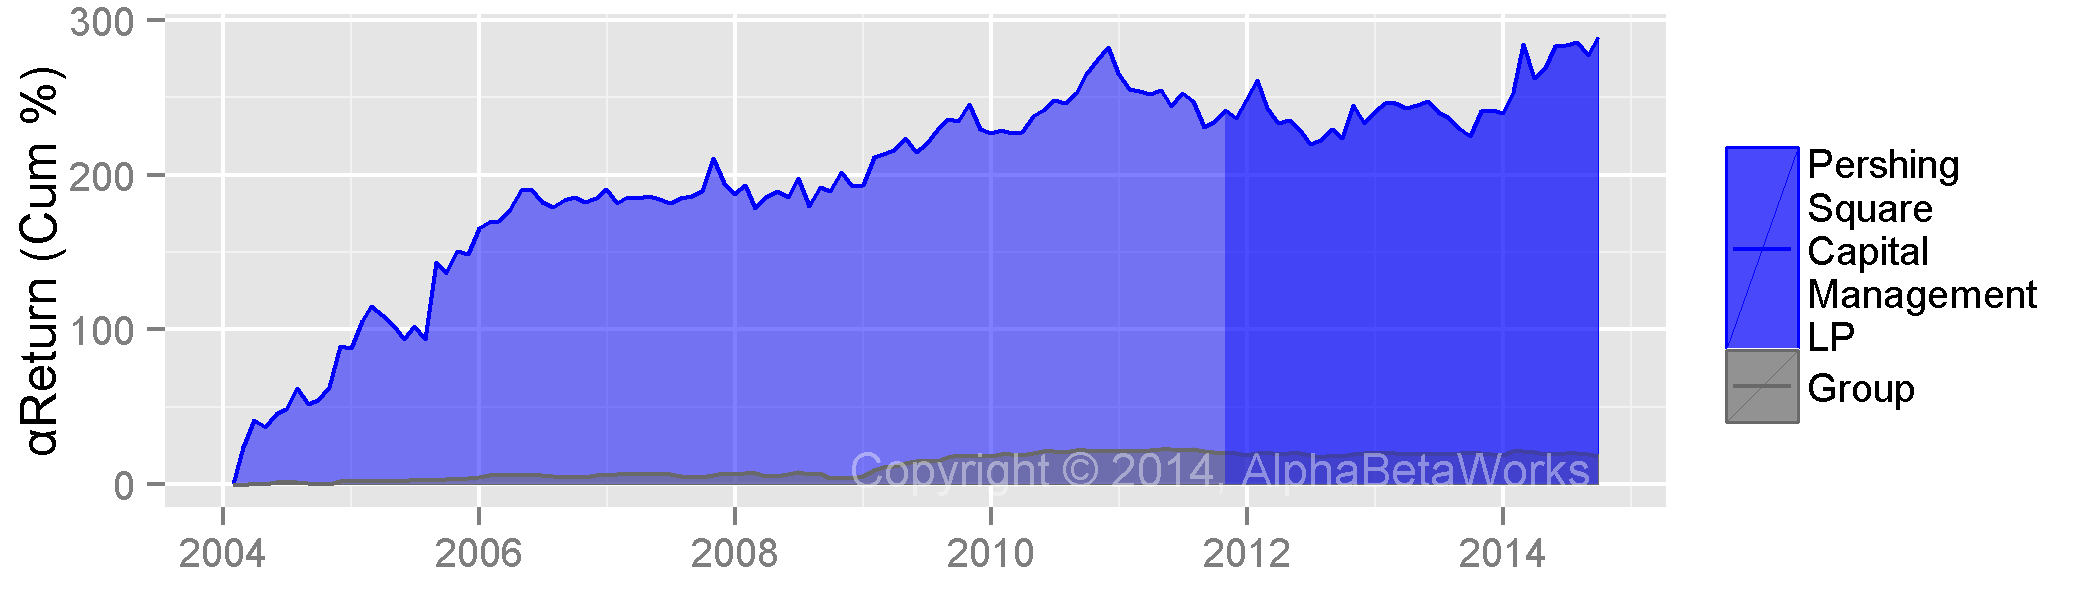
?Return is the risk-adjusted return from security selection – the return a fund would have generated if markets were flat. Pershing’s recent and 10-year results are stellar:
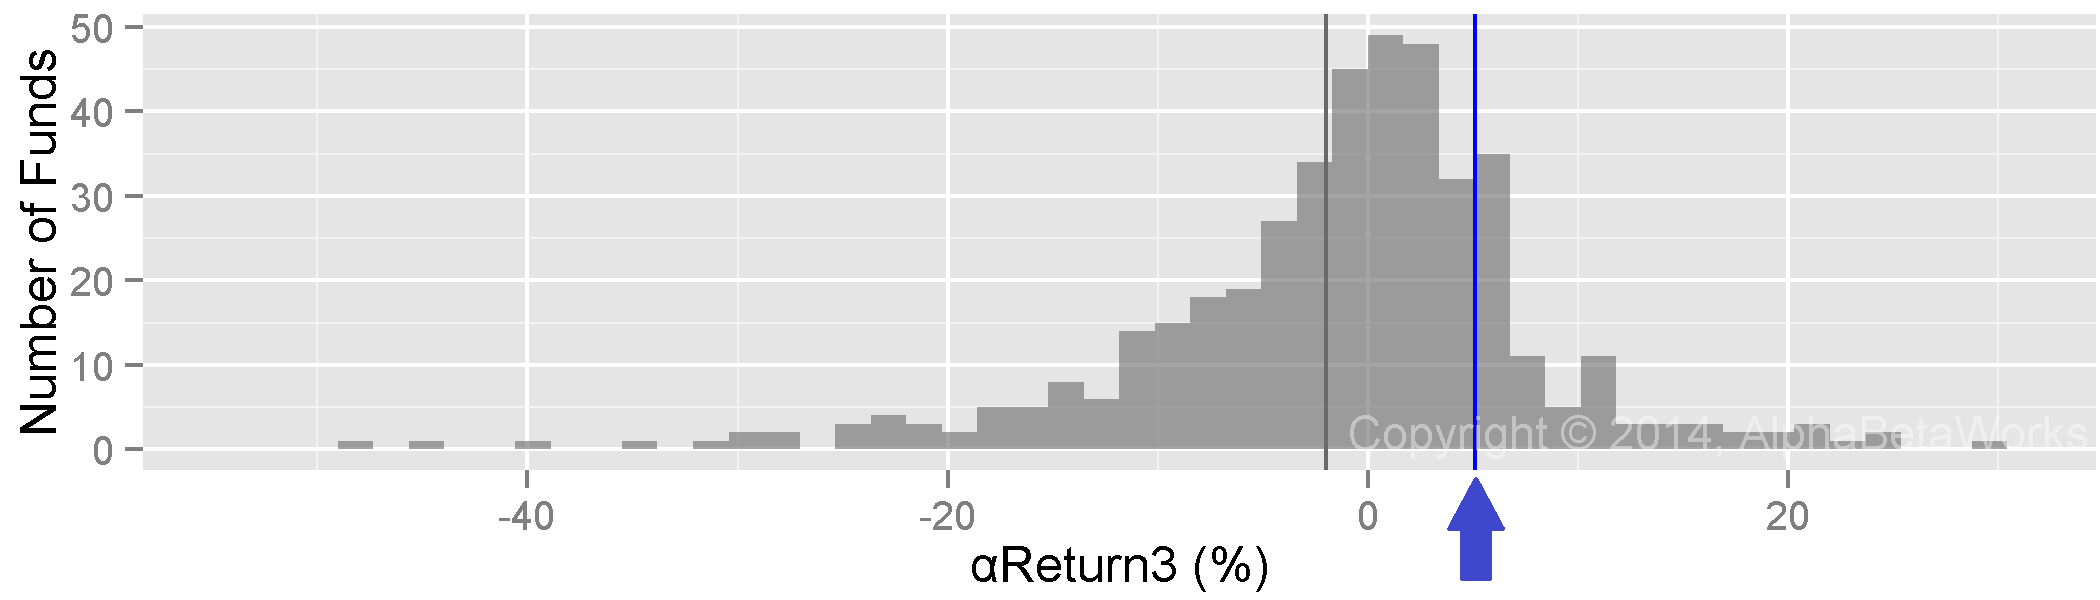
Furthermore, Pershing’s trailing three-year annualized ?Return of 5% exceeds ?Returns of 81% of its peers:
Sector Security Selection
Digging deeper, most of the 2014 ?Return came from the Industrial and Consumer sectors. Over history, there have been a few years of especially large positive (and negative) sector-specific ?Returns:
| 2004 | 2005 | 2006 | 2007 | 2008 | 2009 | 2010 | 2011 | 2012 | 2013 | 2014 | |
| Communications | 1.20 | 0.00 | 0.00 | 0.00 | 0.00 | 0.00 | 0.00 | 0.00 | 0.00 | 0.00 | 0.00 |
| Consumer | 60.30 | 0.21 | 7.63 | -0.18 | 0.75 | 2.75 | 8.74 | 1.01 | -14.08 | -3.97 | 3.11 |
| Finance | 63.47 | 38.81 | 2.50 | -0.46 | 0.64 | 3.88 | 3.51 | -10.26 | 2.67 | -3.43 | 1.35 |
| Health | 0.00 | 0.00 | 0.00 | 0.00 | 0.00 | 0.00 | 0.00 | 0.00 | 0.00 | 0.00 | 1.80 |
| Industrial | 0.00 | 0.00 | 0.00 | 0.00 | 0.00 | 0.00 | 0.00 | 3.96 | 9.55 | 7.03 | 8.37 |
| Miscellaneous | 0.00 | 0.00 | 0.00 | -0.17 | 0.00 | 0.00 | 0.00 | 0.00 | 0.00 | 0.00 | 0.00 |
| Technology | 0.00 | 0.00 | 0.00 | 0.00 | 1.30 | 4.47 | -0.03 | 0.03 | 0.00 | 0.00 | 0.00 |
The Industrial sector is an area of consistent strength:
Pershing’s recent long positions in the industrial sector are:
| APD | Air Products and Chemicals, Inc.; |
| CA:CP | Canadian Pacific Railway; |
| GB:PAH | Platform Specialty Products Corp. |
Pershing’s Consumer sector ?Return has been mixed over the past 3 years; it has been excellent over the long-term and in 2014:
Pershing’s recent long position in the consumer sector is:
| BKW | Burger King Worldwide, Inc. |
Additional security-selection insights, such as position sizing skill and the analysis of portfolio scalability/overcapitalization, are available but beyond the scope of this article.
Pershing Square – Long Equity Market Timing
?Return is the risk-adjusted return from market timing – the return due to variation in factor exposures over time. Positive ?Returns occur when a manager takes on larger exposures to factors that subsequently generate larger-than-typical returns.
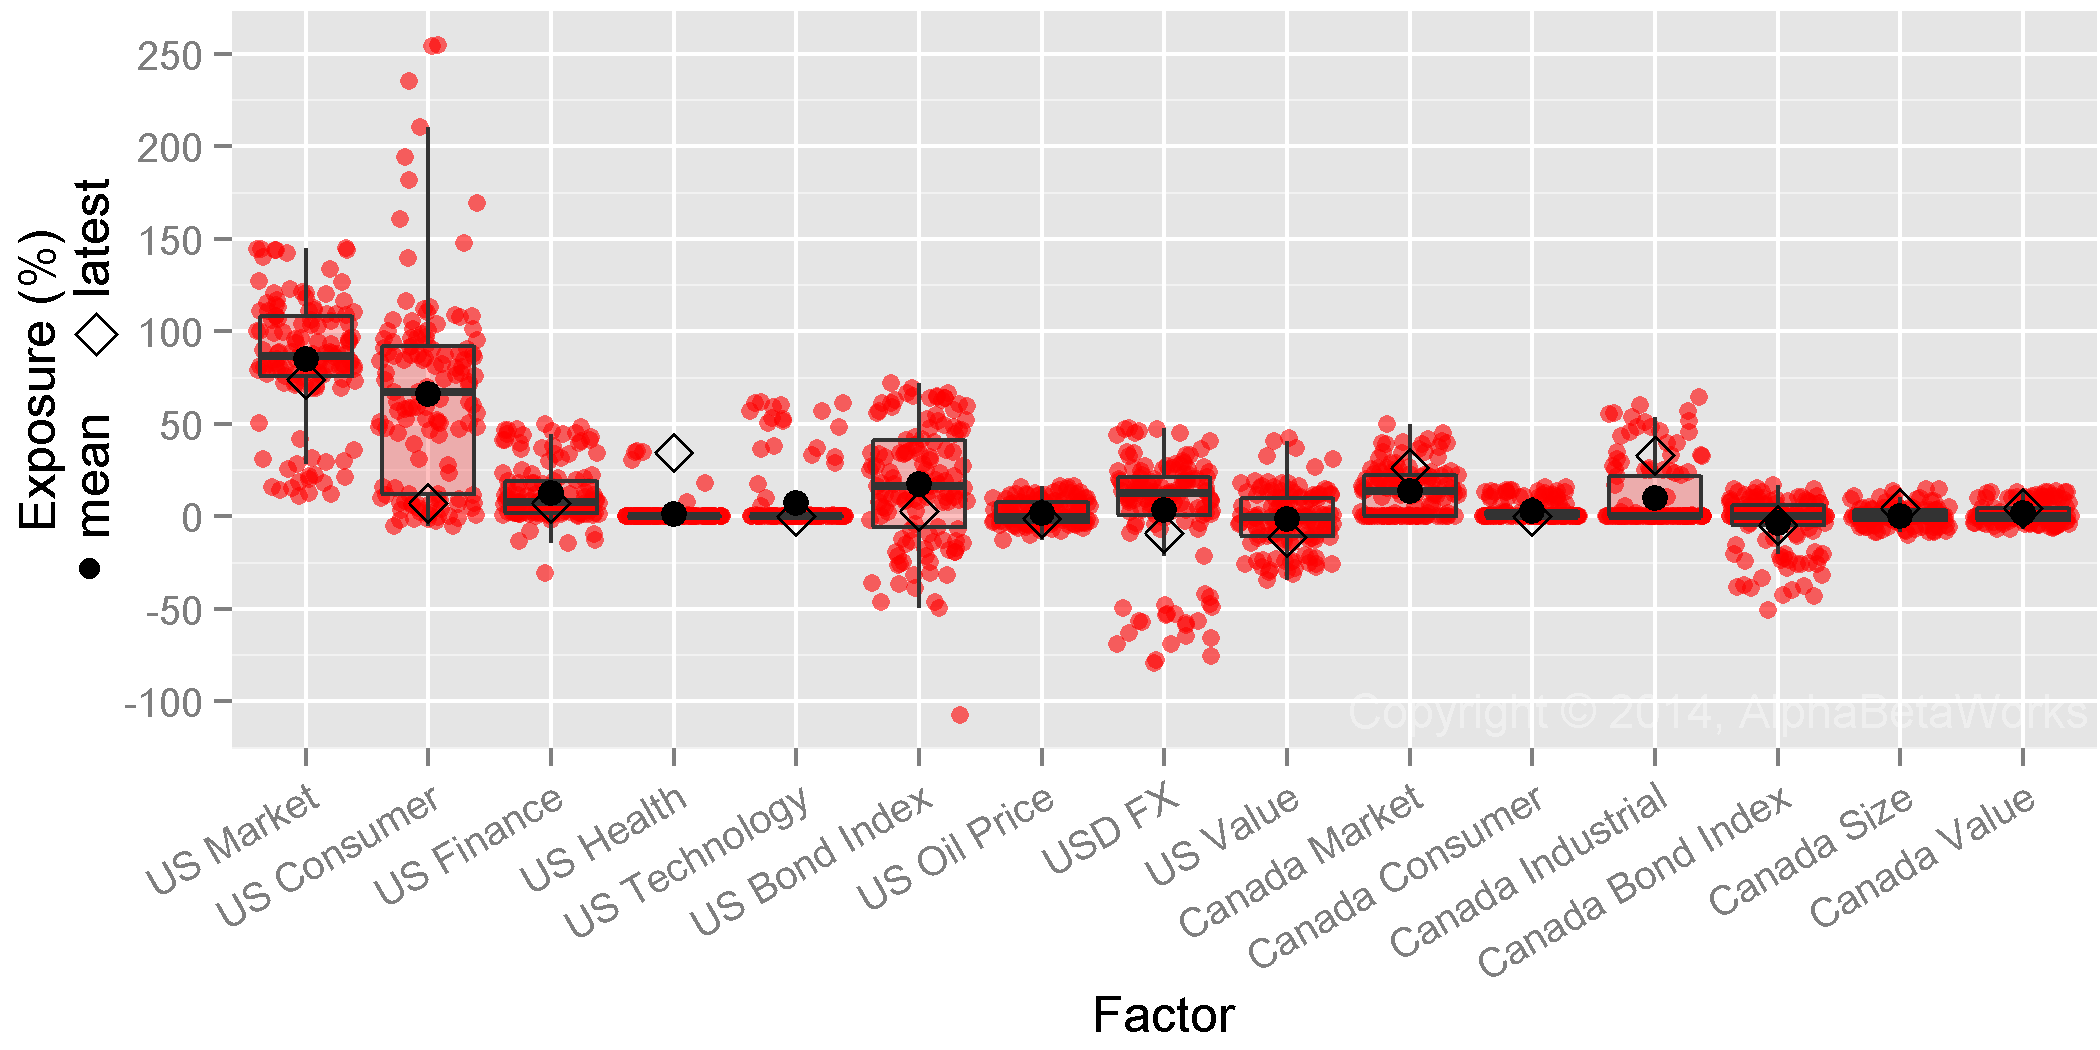
Pershing Square has varied factor and sector exposures dramatically over time. In the chart below, the red dots depict historical long portfolio factor exposures, while the diamonds show current exposures. Critically for skill evaluation, ABW’s non-market risk factors exclude all market effects, which enables sound performance attribution:
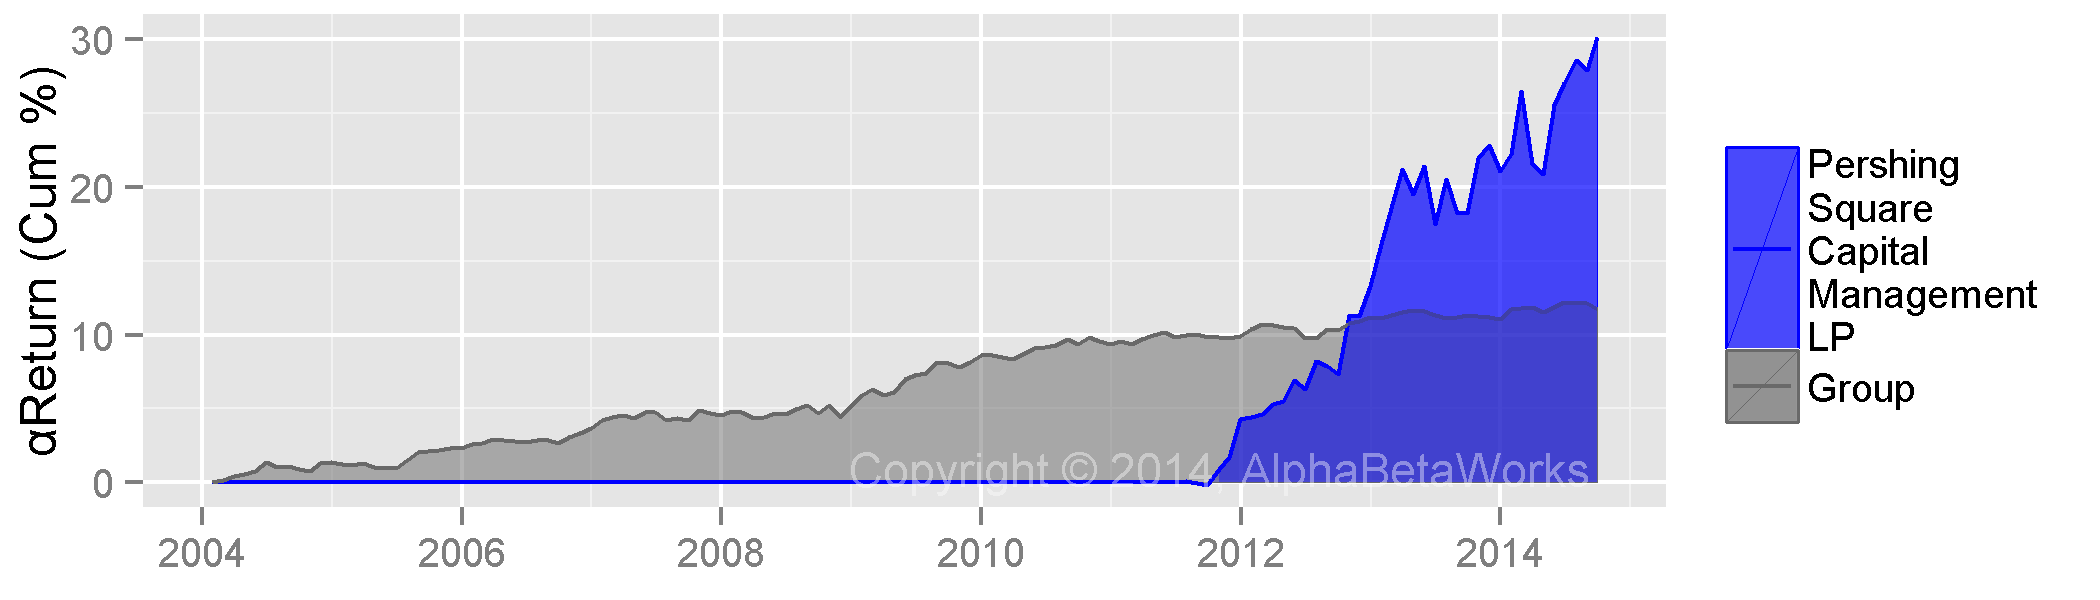
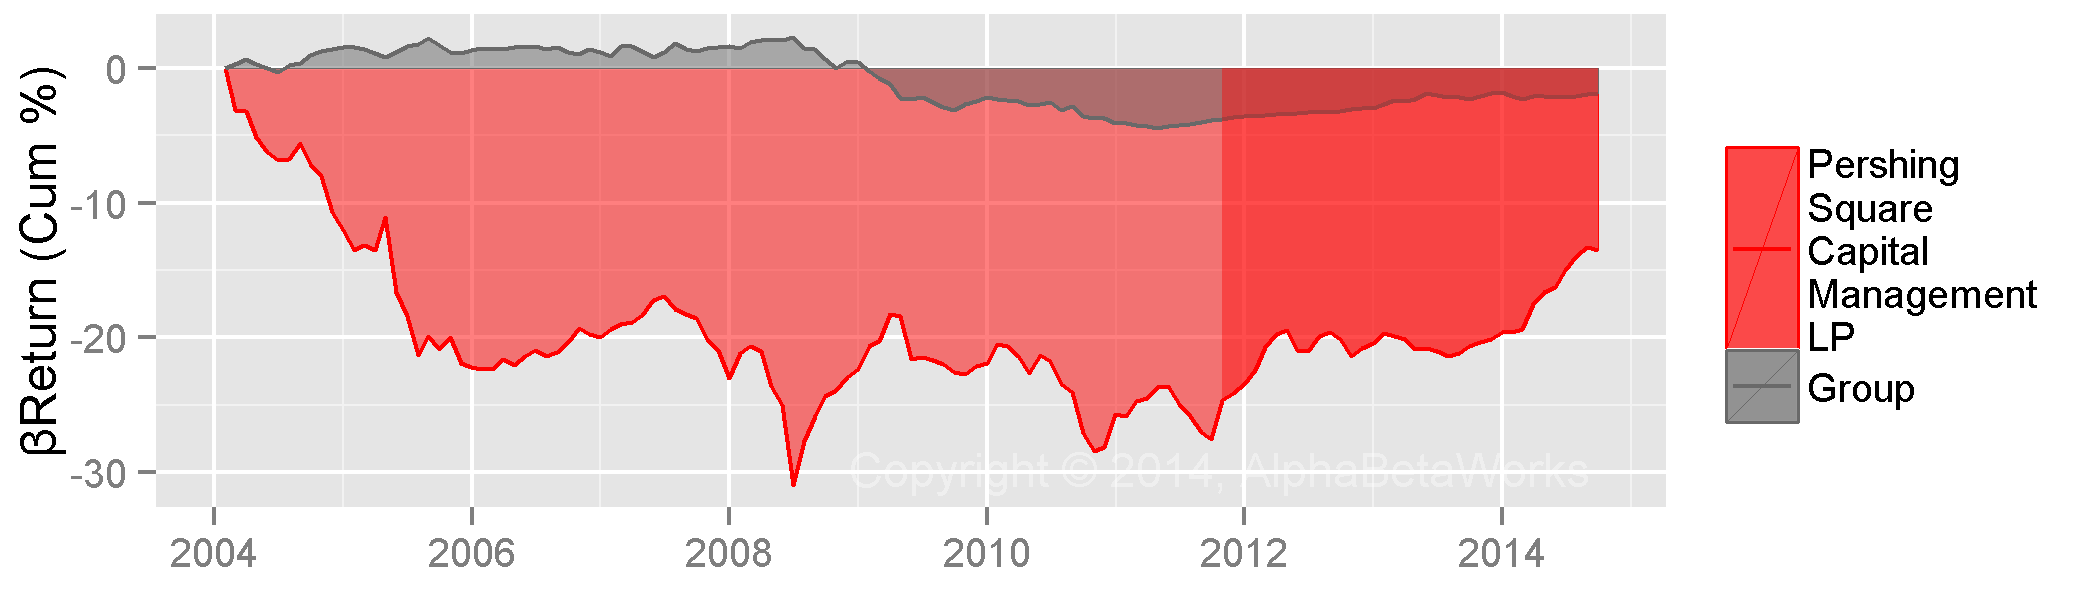
Pershing Square’s factor timing performance (?Return) was negative from 2004 to 2006, largely flat through 2012, and positive since 2012:
Similar to analyzing ?Returns by sector, AlphaBetaWorks analyzes specific sources of ?Return to identify which factors the fund has timed successfully, or unsuccessfully. For example, In 2014 Pershing’s positive market-timing returns were due to:
- Increased exposure to the U.S. Health, Canada Market, and Canada Industrial factors;
- Decreased exposure to U.S. Consumer.
Pershing Square’s significant ?Return components, by year:
| 2004 | 2005 | 2006 | 2007 | 2008 | 2009 | 2010 | 2011 | 2012 | 2013 | 2014 | |
| U.S. Consumer Sector | -2.33 | 3.61 | -0.57 | -3.48 | 1.25 | 0.13 | 1.56 | 2.88 | -0.47 | -1.69 | 1.70 |
| U.S. Health Sector | 0.03 | -0.07 | 0.05 | -0.06 | -0.02 | -0.04 | 0.08 | -0.14 | -0.09 | -0.23 | 2.11 |
| USD FX | 8.30 | -8.77 | -1.21 | -1.41 | -0.01 | 0.40 | -1.23 | -0.40 | 0.11 | 0.41 | -1.05 |
| Canada Market (Beta) | -4.19 | -3.70 | -2.07 | 0.53 | 0.55 | 0.46 | -2.37 | 0.98 | 0.61 | 4.18 | 2.40 |
| Canada Industrial Sector | -1.18 | 0.59 | 0.14 | -1.28 | -0.10 | -0.42 | -0.93 | -0.80 | 1.27 | 4.67 | 3.68 |
Conclusion
- Risk-adjusted performance is return above a passive portfolio replicating a fund’s typical risk profile.
- Pershing Square exhibited strong risk-adjusted return from overall security selection (?Return) and, recently, strong market/factor timing (?Return).
- Pershing Square recently exhibited especially strong risk-adjusted security selection returns (?Returns) in Consumer and Industrial sectors.
- Pershing Square recently exhibited strong risk adjusted market timing returns (?Returns) due to increased exposures to U.S. Health, Canada Market, and Canada Industrial factors, and reduced exposure to U.S. Consumer factor.
- Among its many advantages, our analysis provides allocators insights into manager core competencies. Portfolio managers, too, benefit from deeper understanding of their own – and their teams’ – strengths and weakness.


