Open Square Capital letter to investors for the second quarter ended June 30, 2019.
Dear Limited Partners,
We’re in a crucible. We’ve long been approaching it, guided by our decision to undertake an energy thesis based on the “wanton” notion that things that can’t go on forever will end. In the coming months we’re going to know whether we’re right, whether the decision to hold our investments after seeing the portfolio double and then retrace was sheer folly or uncommonly prescient. The surfeit of inventories and bearish headlines indicate the former, but our understanding of the underlying facts suggest the latter. Forget our nuanced analysis though, at least that’s what the market is saying. Forget the grey. In an energy world now dominated by computerized trading, inventory balances drive prices and that aggregate number represents everything. Perhaps that’s as it should be as the outcome for our decisions will certainly be binary.

Q2 hedge fund letters, conference, scoops etc
Some days it does seem like we’re squaring a circle, trying to do the impossible. We’re attempting to compile and understand a vast collection of data, knowing full well that the final mosaic will never be crystal clear. Couple that with the unknown unknowns, and you can quickly tumble down the fracked well of uncertainty. Yet, it should be hard shouldn’t it? The market is efficient enough to uncover most asset mispricings, and it’s certainly efficient enough to uncover those easily discoverable. There are simply too many analysts and money managers (professional or amateur) turning over the same finite amount of rocks. Still, when such mispricings stem from something esoteric or something obscure that’s where the market surrenders; it can completely abandon the asset and asset class because it’s suddenly “outside their circle of competence” or uncertain, which presupposes that circles aren’t meant to be expanded and certainty always translates to greater returns.
We’re not trying to square the circle because we’re biased to confirmation bias. There’s no nobility in blind perseverance and even less capital for it. We square the circle because most investors don’t, and over time we think that process will yield extraordinary results. It shouldn’t be easy because nothing worthwhile ever is, but attempting to do the impossible may actually broaden what’s possible.
At least that’s what we hope. For now, we’re in a crucible. We’re waiting to see if we’ve been right all along and the thread of time is short. These next few months will tell us whether our energy analysis has been spot on. Despite elevated inventories today, we see the data already beginning to turn. Perhaps demand isn’t as weak as the superficial analysis writ large trumpets and perhaps supplies really are constrained as capital dries up. Maybe . . . and maybe the market will believe it when it sees it. Until then, we’ll endure. If events shift the way we expect, we’ll emerge from the crucible in short order, tested, but well-rewarded.
Our Quarter
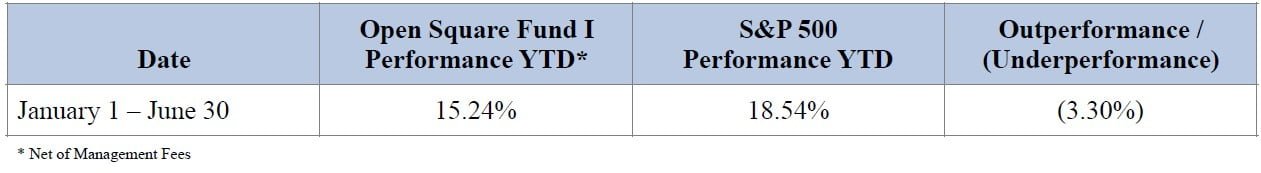
For the quarter, market volatility dominated. After initially falling due to trade pressures, market indices recovered and roared higher on the prospect of further monetary easing. The S&P 500 increased 4.3% for the quarter and finished the H1 2019 with an impressive 18.54% gain.
In contrast our portfolio retreated. Our energy holdings dragged on performance because investors bought the notion that despite the prospect of further monetary stimulus (which helps stocks), a slowing economy means lower oil demand. Thus, oil prices fell as the commodity again became the favored instrument to bet the slowing global trade thesis. From the end-of-Q1 to mid-June, Brent prices fell 11% from $67.58 to $59.97/barrel. It subsequently recovered its footing to end the quarter at $64.74/barrel because of geopolitical risks (Iran) and crude inventory draws that began appearing in late June. Despite this recovery, equity prices have yet to recover after swooning.
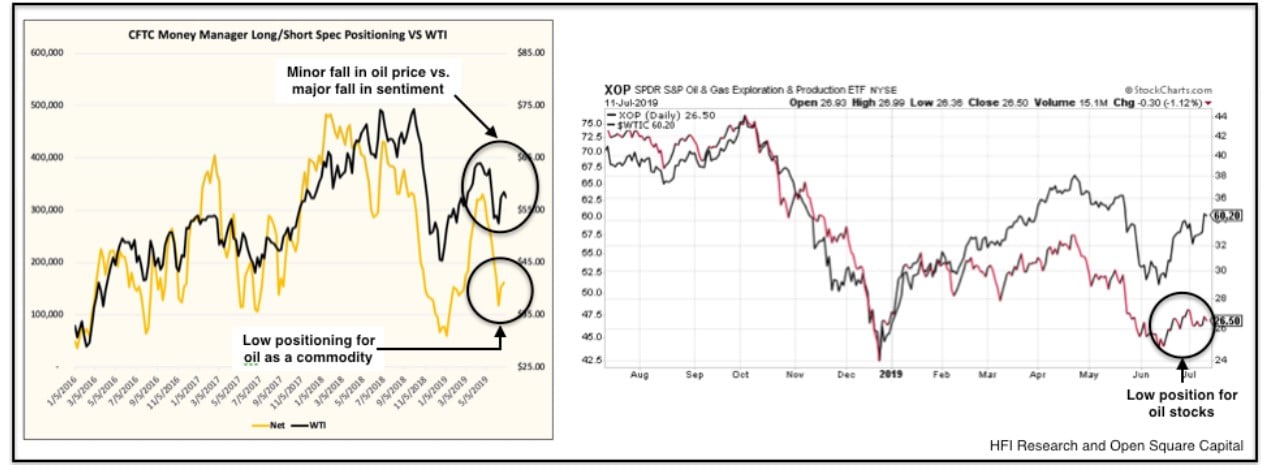
Oil prices are still flitting around $65/barrel while financial positioning in oil or energy related investments (stocks and bonds) are close to the lows. This is a testament to how tight the physical market is because even with the trade slowdown, oil prices remain relatively unchanged from Q1. As inventories draw, we’ll see the physical market force prices higher when users bid-up the barrel. Investors will then provide an additional uplift as they return. Again it’s only a matter of time before they do. Let’s review the macro-developments in Q2 and then walk-through inventories.
US / China Trade Relations
The conclusion of the recent Group of 20 (“G20”) meeting in Osaka, Japan saw the US and China agree to resume trade talks after negotiations deteriorated. The ceasefire was a welcome relief if not unsurprising as anything less would’ve sent shockwaves through the global financial system. As an olive branch, the US agreed to pause on applying tariffs to the remaining $300B of Chinese imports, but the 25% tariffs on $200B of Chinese goods will remain.
We still believe that the trade war will eventually come to some resolution before year-end. Initially we thought that the negotiations would finish by March and from reports the parties were close to a finalized agreement only to see China back away. The US then increased tariffs from 10% to 25% on $200B of Chinese goods, and both parties retrenched into their positions and the trade rhetoric turned caustic to stir domestic support. Despite the increasing trade hostility, the two need each other as their economies are too intertwined. Both are aware that further squabbling could derail the fragile global economy as the tit-for-tat tariff raising deters investments and trade flows.
Don’t believe a deal is necessary? Well let’s ask the question. Do we think President Trump, in his first term with few tangible successes beyond the recent economic and stock market gains, would willingly enter the 2020 re-election campaign with a trade war that directly harms his core constituents? Doubtful. To believe otherwise means accepting the premise that he is more concerned with longer-term issues such as IP transfers, business competitiveness and containing China’s rise as a global power, than he is about winning re-election. A far reach. What little stability this administration has shown, it’s at least been consistent on one point, short-term wins matter. We question whether he’d be willing to arm his political rivals with campaign fodder in the swing states when the Democratic primary begins in 2020. Why else does he keep tweeting about getting the Chinese to purchase more US agricultural products? For the President, pragmatism and perception will trump political ideology.
China
Similarly, for all of China’s bluster 25% tariffs do matter. The initial 10% tariffs on $200B of goods was arguably a nuisance, but tariffs are real costs. Some US companies forced their Chinese manufacturers to absorb the costs by shrinking their margins while others passed it along to their consumers. Deciding which approach to apply depended on the industry dynamics and the specific product.
25% tariffs? Now it just got real real. Real enough for US companies to ask for price concessions, or broach serious discussions about remapping supply chains. Real enough to consider producing iPhones outside of China. For contract manufacturers, these discussions impact not just the people in the factories, but the ancillary businesses that support the companies and their employees. So the pressure builds. Outwardly, China can strike an unyielding nationalistic pose, but manufacturing businesses that compete on costs can’t subsidize patriotism for long. As business sentiment deteriorates, the government is forced to ease monetary policies and increase fiscal spending/corporate subsidies, all of which creates more leverage in the system. Necessary now, but undesirable in the long-term. After spending 2018 deleveraging their system, 2019 has seen the opposite, and we surmise it’s not a path the political elite in China is keen on heading down.
China recently added a senior diplomat Yu Jianhua to the negotiating team, and we believe he will serve as a counterweight to US Trade Representative Robert Lighthizer on the technical issues. The addition of a senior official with heavy technical experience tells us that China has decided to negotiate hard, but craft an acceptable trade agreement (i.e., vague) that they could eventually skirt (i.e., cheat). Even if the parties agree, it comes down to follow-through and enforcement. Such things, however, are outside of the timelines of either teams, which is all the more reason to settle now and let others deal with the fallout years later. In the end, US/China need each other, they need a deal, and they need it relatively soon, which is why we’re betting on it.
OPEC+ Agreement and the US
Now that’s the macro landscape affecting demand. As for producers on the supply side, they continue to do their part. OPEC+ recently agreed to extend their original 1.2M bpd production cut to Q1 2020. As a sign of Russia’s heightened influence within OPEC, it was Russia and Saudi Arabia who jointly announced an extension of the OPEC+ Agreement at the G20 meeting. Shortly thereafter, OPEC met in Vienna and rubber stamped the extension. The cartel also formalized its cooperation with Russia by signing a charter to govern the new partnership, a coupling that OPEC Secretary General Mohammed Barkindo called a “Catholic marriage” that would last for “eternity.” So Putin now has informal control over half of the world’s oil production . . . delightful.
As for the cartel’s production/exports, both continued to drift lower as US sanctions on Venezuela and Iran began to bite. Saudi Arabia maintained its overcompliance with the production cuts to further constrain inventories. In Q2, OPEC production and exports were 1.6M bpd and 2M bpd lower YOY, respectively. So who’s stepped in to replace this decline? Well about the only producer who’s been able to grow production in 2019, the US.
US Production Trend
US production continues higher, but as we analogized in our Q4 2018 letter, it’s a rocket that’s likely reached apogee.
"The world’s entering 2019 riding a US production rocket ship, counting on it to escape the pull of global declines and supply shortages. We’re saying that’s unlikely because as the industry becomes capital constrained in this lower environment, its main engines will lose some power."
The YOY growth for the US appears to be large (1.5M bpd), but that’s because last year, production started at a much lower base. The recent trend is much more revealing. Here’s an updated look at US production in the past few months.
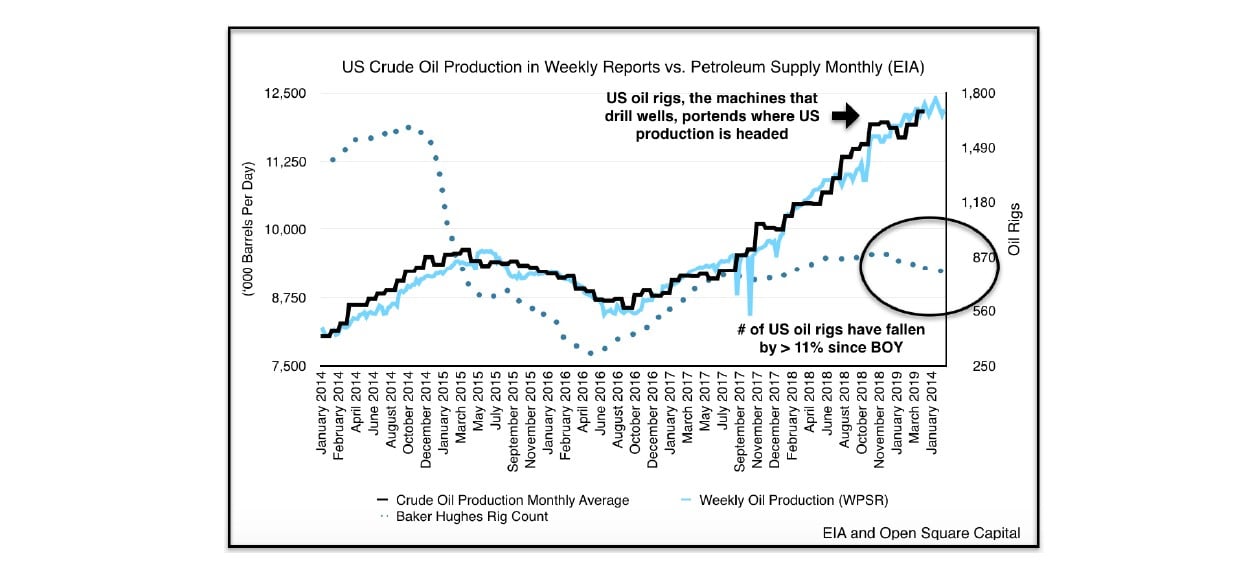
From December 2017 to December 2018, US production grew by 1.7M bpd. From January to June 2019? 185K bpd. We predicted the growth rate for US production would slow dramatically in 2019, and so far that’s true. Stalling growth for just 6 months means producers must spend even more to arrest higher decline rates and fuel growth. In a capital constrained environment? Completely unrealistic.
Cheap capital has long been the drug of choice for a shale industry addicted to drilling wells with production profiles that resemble coke mixed with mentos. No more, as the terrible performance of energy stocks coupled with the high interest rates asked by lenders means very few investors are willing to finance oil companies. According to a recent Wall Street Journal article
"...there hasn’t been an issuance of public equity by a fracking company since late last year, the longest gap since 2014... Meanwhile, bond issuances by shale companies are on pace to reach their lowest levels in more than a decade..."
Unable to borrow or sell stock, companies are now forced to live within cash flow and prove that they can generate a decent return for investors. As Scott Sheffield, CEO of Pioneer Resources stated “we lost the growth investors. Now we’ve got to attract a whole other set of investors.” Exactly, it’s a group that now expects a return on their investment.
The above is really only referring to public companies. For private operators (accounting for approximately 20% of shale production), the liquidity issues are even more severe, and we’ll see their production flatline and potentially decline. The prospect of US production stalling further has become increasingly likely as we’re already half-way through 2019 with rigs counts lower than last year and productivity issues acting as a headwind. There’s little chance management teams faced with a low share price, high borrowing costs and low oil price would propose to their Board of Directors that outspending cash and growing into H2 2019 amidst macroeconomic uncertainty makes sense. So expect US production to stay in this range as the capital screws turn tighter.
Inventories
Now despite the bullish supply backdrop, you’d expect inventories to decline right? Wrong, or at least we were. As we headed into the heart of the slow season, inventories increased due to a spate of factors. Now remember our analysis is telling us that we should be seeing tight inventories (i.e., flat/counterseasonal draws in the slow months and a rapid decline in the heavy demand season) and that just didn’t happen.
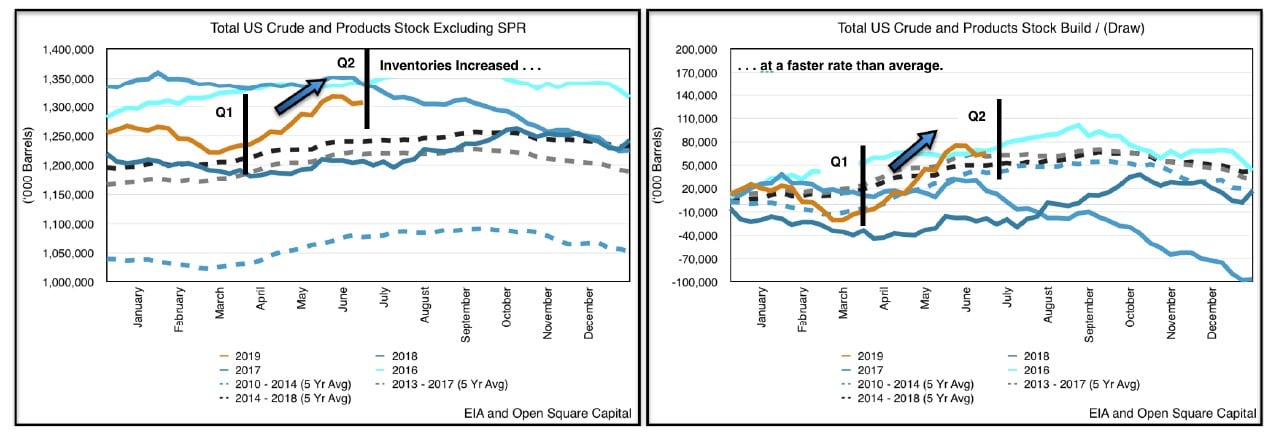
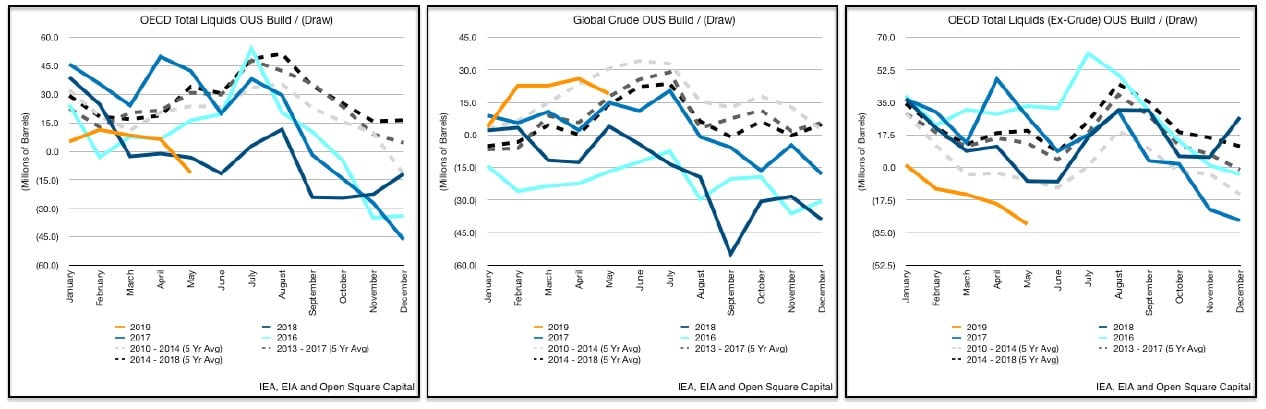
So where’s the disconnect between what we forecasted and what the data showed? Well let’s dive into the US figures since that’s the dog wagging the tail. On a high-level, US commercial inventories of total liquids (i.e., crude and petroleum products) are almost half of global OECD stocks. So where the US goes, the world will likely go. In Q1 we saw US inventories decline at a higher rate than the 5-year average, but completely reverse in Q2.
In turn, we can see the US build affect global inventories (OECD figures to May).
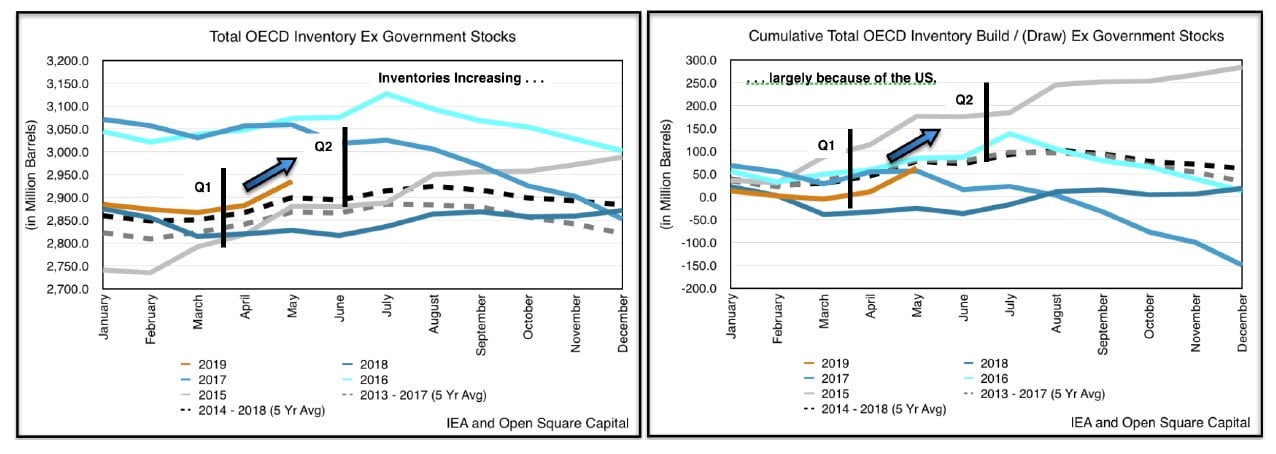
While the US build did increase global inventories, it wasn’t fully felt. In April/May, US inventories of total liquids increased by 79M barrels, more than double the 5-year average of 35M barrels. In contrast, total liquids in OECD countries increased by only 39M barrels, which means that total liquids drew by 40M barrels outside of the US. So we had a situation where US inventories were rising, but non-US inventories were falling.
Crude Can’t Plan for Unplanned Outages
What’s accounting for the dramatic increase in US inventories? Refinery outages. Severe weather and flooding in the midwest coupled with refineries pulling forward maintenance to prepare for new fuel oil standards resulted in lower refinery demand (utilization).
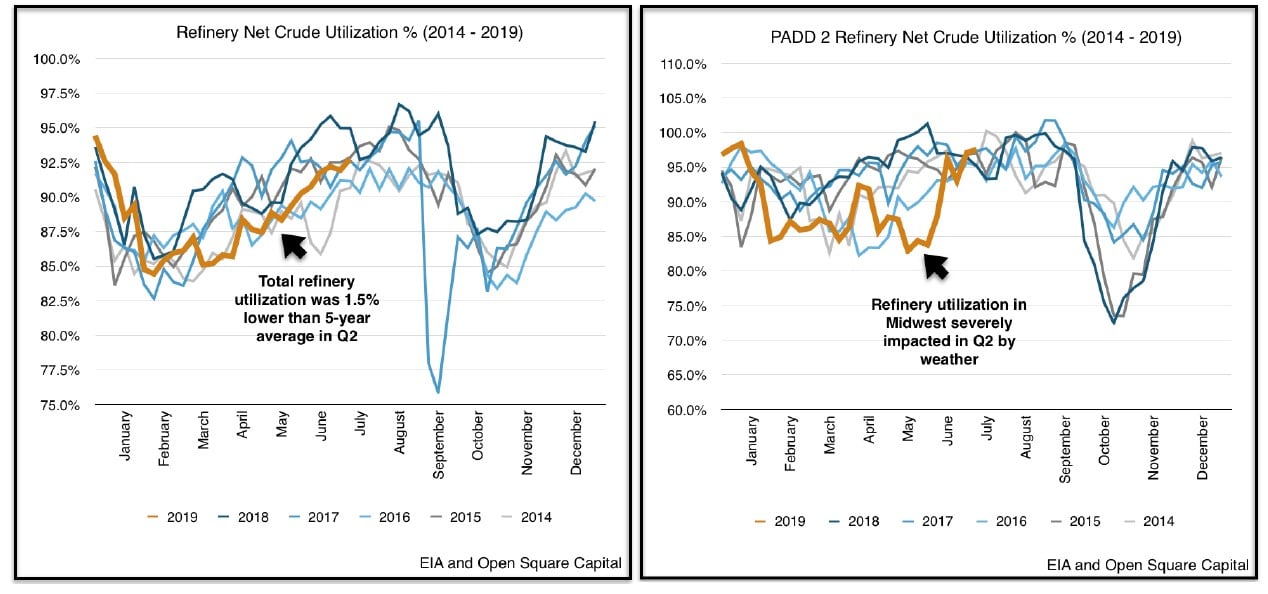
Refinery utilization was ~280K bpd lower than the 5-year average in Q2, which means ~25M barrels of crude demand stayed offline. In Q2, crude inventories increased by 19M barrels, or 28M barrels more than the 5-year average. Thus, we can see that lower refinery demand played a key role in rising crude inventory levels. Said another way, this means most of the crude build in US stocks were due to transitory issues. As the flooding and heavy maintenance subsided, we expected refinery utilization to recover and in the past month they have. We further expect refineries to run harder into year-end as they’ve already completed the requisite maintenance typically scheduled for H2.
Products NGL/NGPL
This leaves us with the remaining build of 59M barrels (when the 5-year average build for Q2 is 44M barrels). For simplicity, we tend to separate petroleum products into fuel that moves things, heats things, or makes things. Diving into the numbers, it isn’t the fuel that moves things that’s the issue. Inventories for the “Big 3” (i.e., gasoline, jet and diesel) drew heavier than average, so demand is healthy there. The real issue was natural gas liquids (“NGLs”) such as propane, ethanes and butanes (i.e., the things that make things).
We believe only a portion of the NGL build was due to transitory factors. For instance, a tank farm fire in Houston temporarily restricted the shipping channel and impacted ~9M barrels of exports. Moreover, flooding in the midwest reduced planting, dampening agricultural demand for propane used to dry grains and operate machinery. Mostly though, we suspect that the increase in NGL supplies was caused by lower demand for petrochemicals as the trade wars heated up. About 60% of NGLs serve as feedstocks in the bulk chemical industry, which include olefins and aromatics. In turn, olefins and aromatics form the basic building blocks for adhesives, solvents, detergents, plastics and polymers, so hence things to make things. In Q2, inventories of a subcategory of such liquids (NGPLs) ballooned by 46M barrels, and accounted for a material piece of the 59M barrel build as a whole.
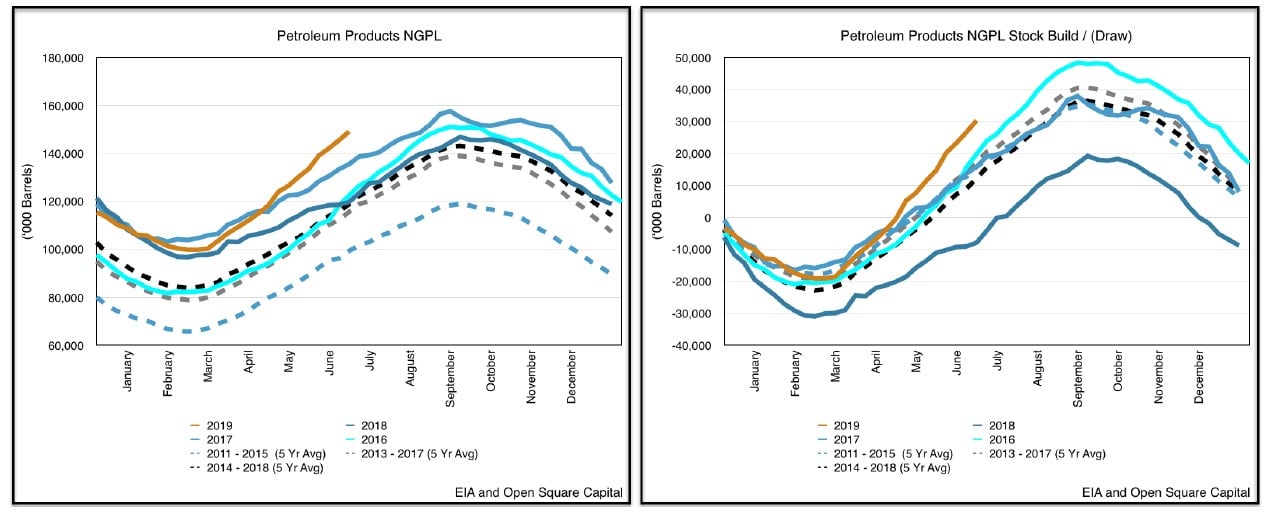
NGL production has increased by 10-15% YOY, but demand and exports haven’t kept pace, especially as the trade war intensified and Asia, the main growth market for NGLs, suffered the consequences. Products supplied, an indicator of implied demand, turned negative in Q2 as manufacturers hit pause to see how the trade war progresses. We’d surmise, however, that the détent at the G20 and eventually an actual resolution means that pent up demand for manufacturing should reenergize NGL demand. For now though, this is something to monitor.
Demand
So where does that leave us? Well our takeaway for Q2 is that as the market shifts from worrying about supplies to worrying about demand, the data quality becomes murkier. Demand figures are rarely timely and even when available they’re implied. We can look at inventory draws, crack spreads, product prices and economic indices, but most, if not all of these figures are imprecise. Inevitably, when the data becomes cloudier, narratives (i.e., storytelling) begins to dominate because the uncertainty needs to be explained.
We can see it in the narratives surrounding even the US data. Increasing crude and product inventories must mean demand has fallen off, right? Well what if most of the crude build and some of the product builds in the US were weather related? What if the reasons behind the builds were really transitory? What if we again told you that although US inventories increased by 79M barrels in April and May, OECD inventories outside of the US actually drew by 40M barrels in those months? Frankly that’s what we’d anticipate seeing. If the US is the last bastion of crude supplies, we’d expect either crude inventories and/or products outside of the US to draw. If so, that means the structural reasons for a shortage continue to apply.
Supplies have continued to fall in areas where we’ve predicted they should, and inventories are tracking below average outside the US. Even if we lowered our demand figures, our supply/demand model remain bullish.
Now global growth has certainly slowed, that’s undeniable, but notice that we wrote “growth.” Despite the trade turmoil, demand continues to increase. While demand may be uncertain, a conservative assumption should buffer our base case. Even with that, a decline in supplies looms large once the temporary headwinds fade. Inventories will draw harder in H2 than most analysts are predicting.
Parting Thoughts
In the end it’s not easy carrying a contrarian thesis as the market continuously tells you that you’re wrong. As my son Mason recently reminded me, even with the best disconfirming evidence, sometimes the market’s perception is your reality.
Mason: Daddy, do you want a cookie?
Me: Aw buddy sure, that’s nice of you. Thanks!
(He pretends to feed me, but pulls away at the last second)
Mason: Hahaha Daddy, I April Fools’d you!
Me: But it’s June???
Mason: Still! (runs away squealing with delight)
Me: . . . but . . . it’s . . . June.
Sometimes it just doesn’t matter what you believe. All the market sees is elevated inventories, and regardless of the reasons, it’s simply evidence that we’re wrong. We know well that there’s a fine line between explanations and excuses; and we know providing the former means inventories will need to prove-up our conclusions. We’ve little doubt that they will do so soon as refiners exit maintenance season in the summer months and global demand rises. If we’ve been correct in assuming that demand growth has outstripped supply growth, inventories will trend lower. We may have been “April Fools’d” in Q2, but it is June . . . err July.
Still.
As always thank you for investing and please let us know if we can explain any of our ideas above in more detail.
Sincerely,
Nelson Wu
Managing Director
https://valuewalkpremium.com/2019/07/open-square-capital-2q19-commentary/


