Stanphyl Capital’s letter to investors for the month of Novemeber, 2019.
Friends and Fellow Investors:

Q3 2019 hedge fund letters, conferences and more
For November 2019 the fund was down 0.8% net of all fees and expenses. By way of comparison, the S&P 500 was up 3.6% while the Russell 2000 was up 4.1%. Year-to-date 2019 the fund is up 5.5% while the S&P 500 is up 27.6% and the Russell 2000 is up 22.0%. Since inception on June 1, 2011 the fund is up 73.5% net while the S&P 500 is up 179.1% and the Russell 2000 is up 115.5%. Since inception the fund has compounded at 6.7% net annually vs 12.8% for the S&P 500 and 9.5% for the Russell 2000. (The S&P and Russell performances are based on their “Total Returns” indices which include reinvested dividends. The fund’s performance results are approximate; investors will receive exact figures from the outside administrator within a week or two. Please note that individual partners’ returns will vary in accordance with their high-water marks.)
On a macro level the economic data (and thus the fund’s positioning) continues to be bearish despite the Federal Reserve’s $60 billion in monthly money-printing and the federal government’s $1 trillion in annual deficit spending. Because of all that printing & spending, annual U.S. core inflation is holding steady at 2.3% and I think there’s a real chance it accelerates into 1970s-style stagflation. We’re thus (since late October) short long-term U.S. government bonds (by being short TLT) and (as more of a “negative-yield bubble play” than an “inflation play”) non-U.S. sovereign debt (by being short BNDX)—please see more about those positions later in this letter. Meanwhile, here’s why I remain economically bearish and thus don’t want to be broadly long stocks…
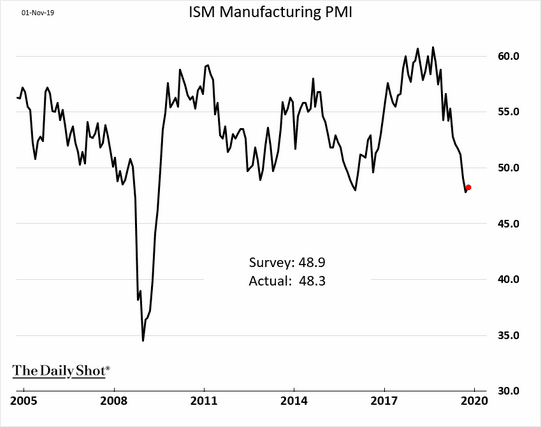
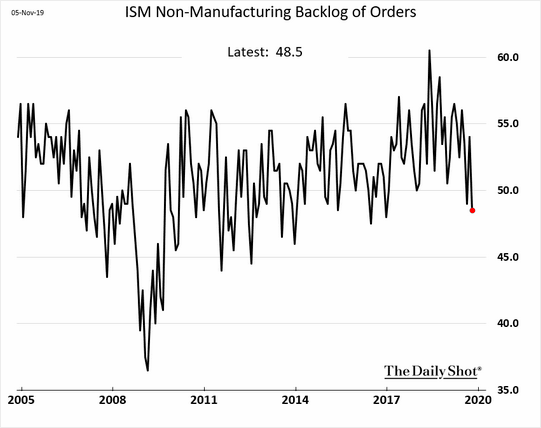
Although economic data was somewhat mixed this month, with bearish ISM PMIs:
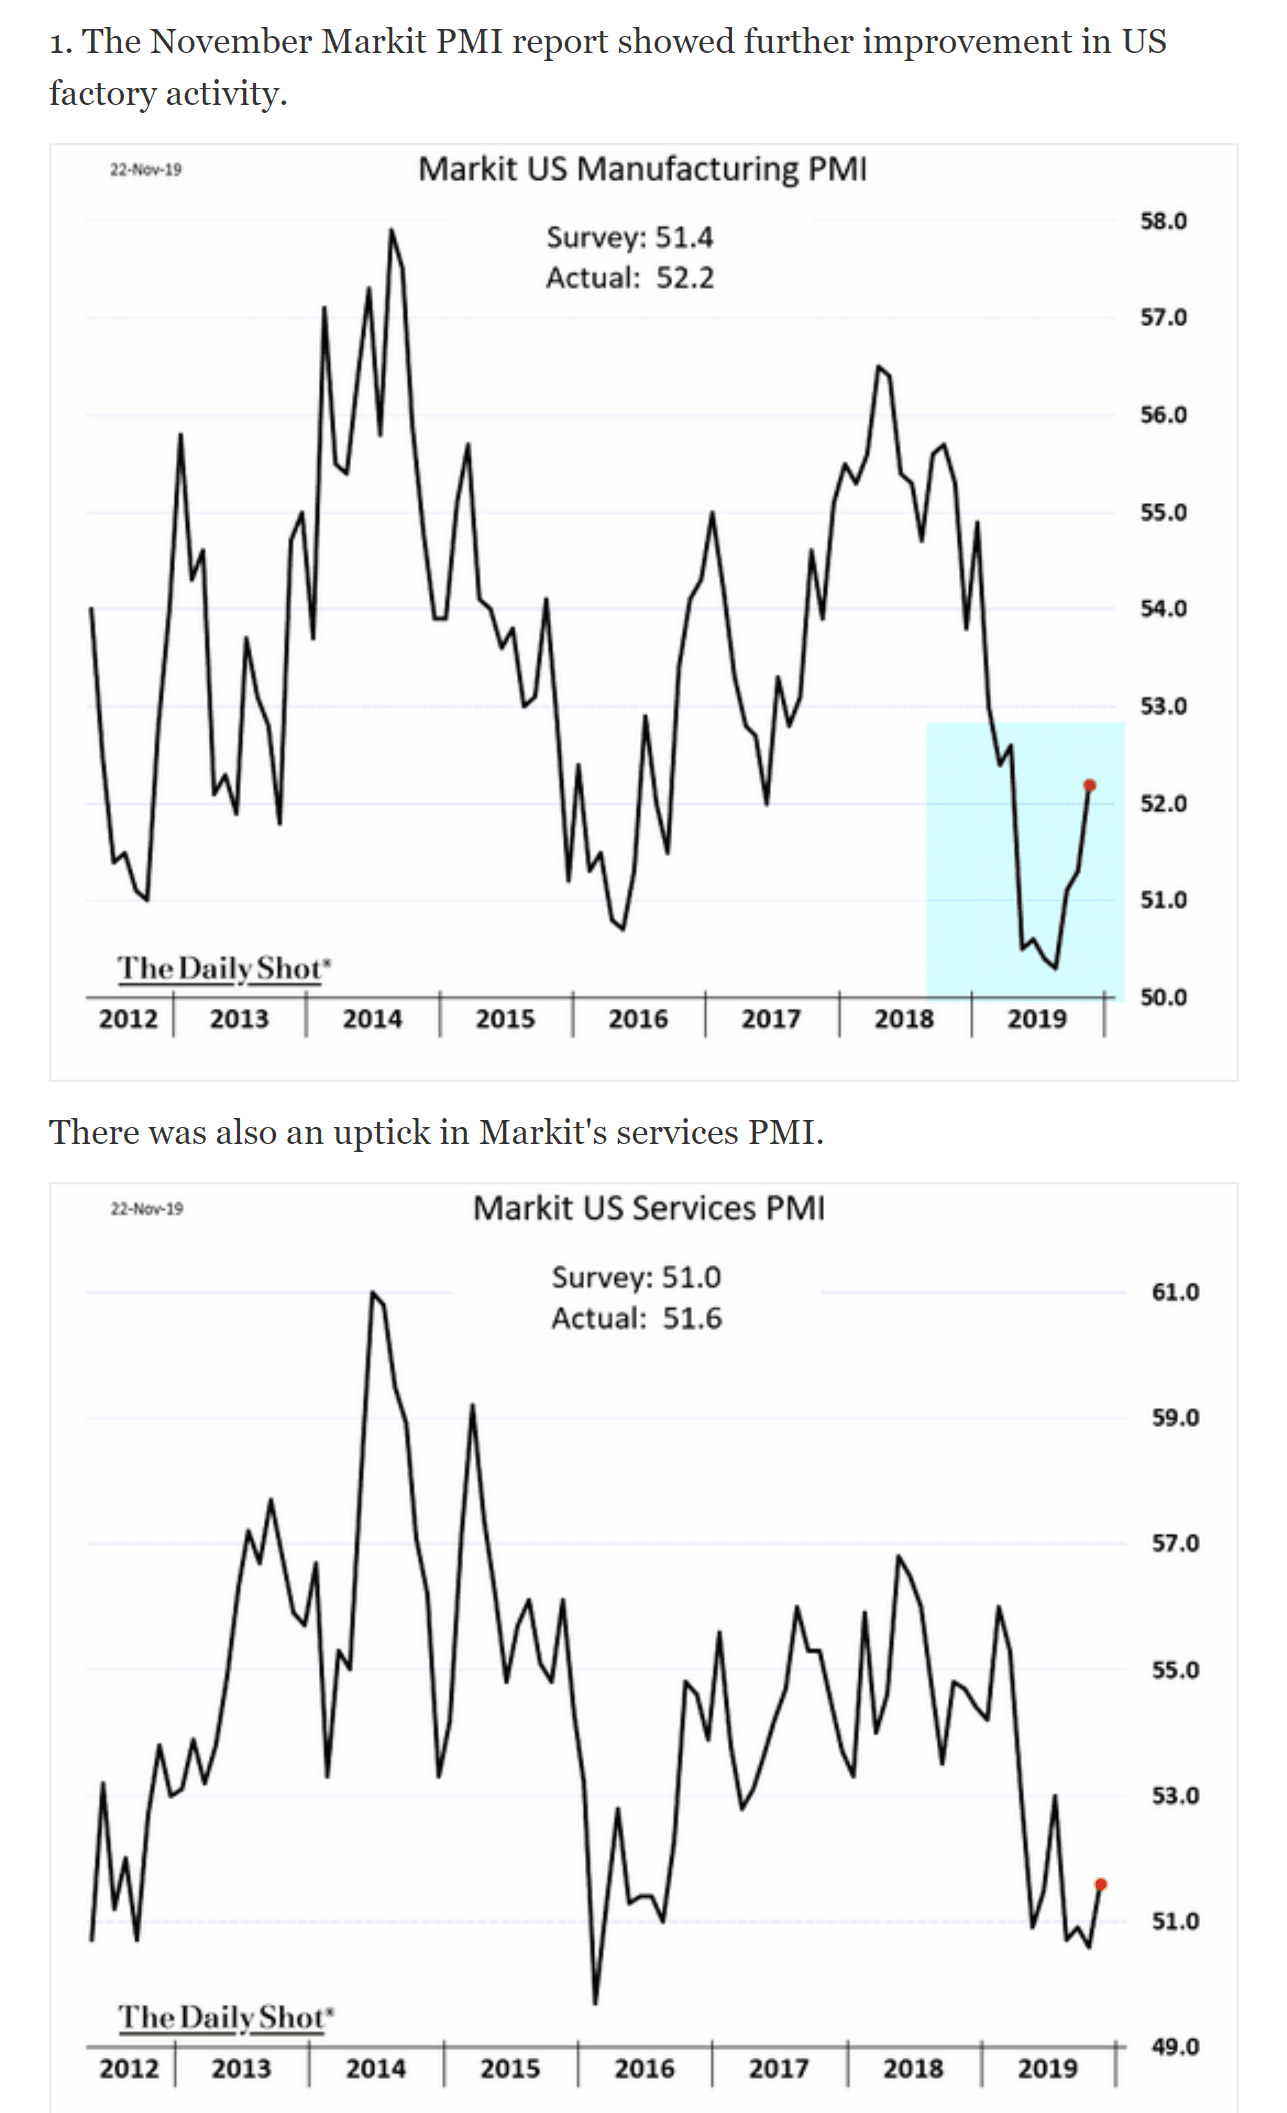
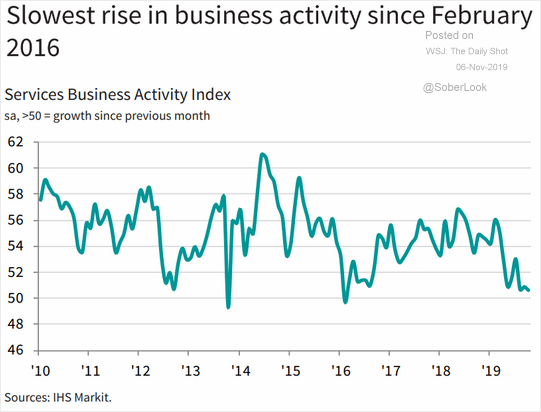
…but bullish PMIs from Markit:
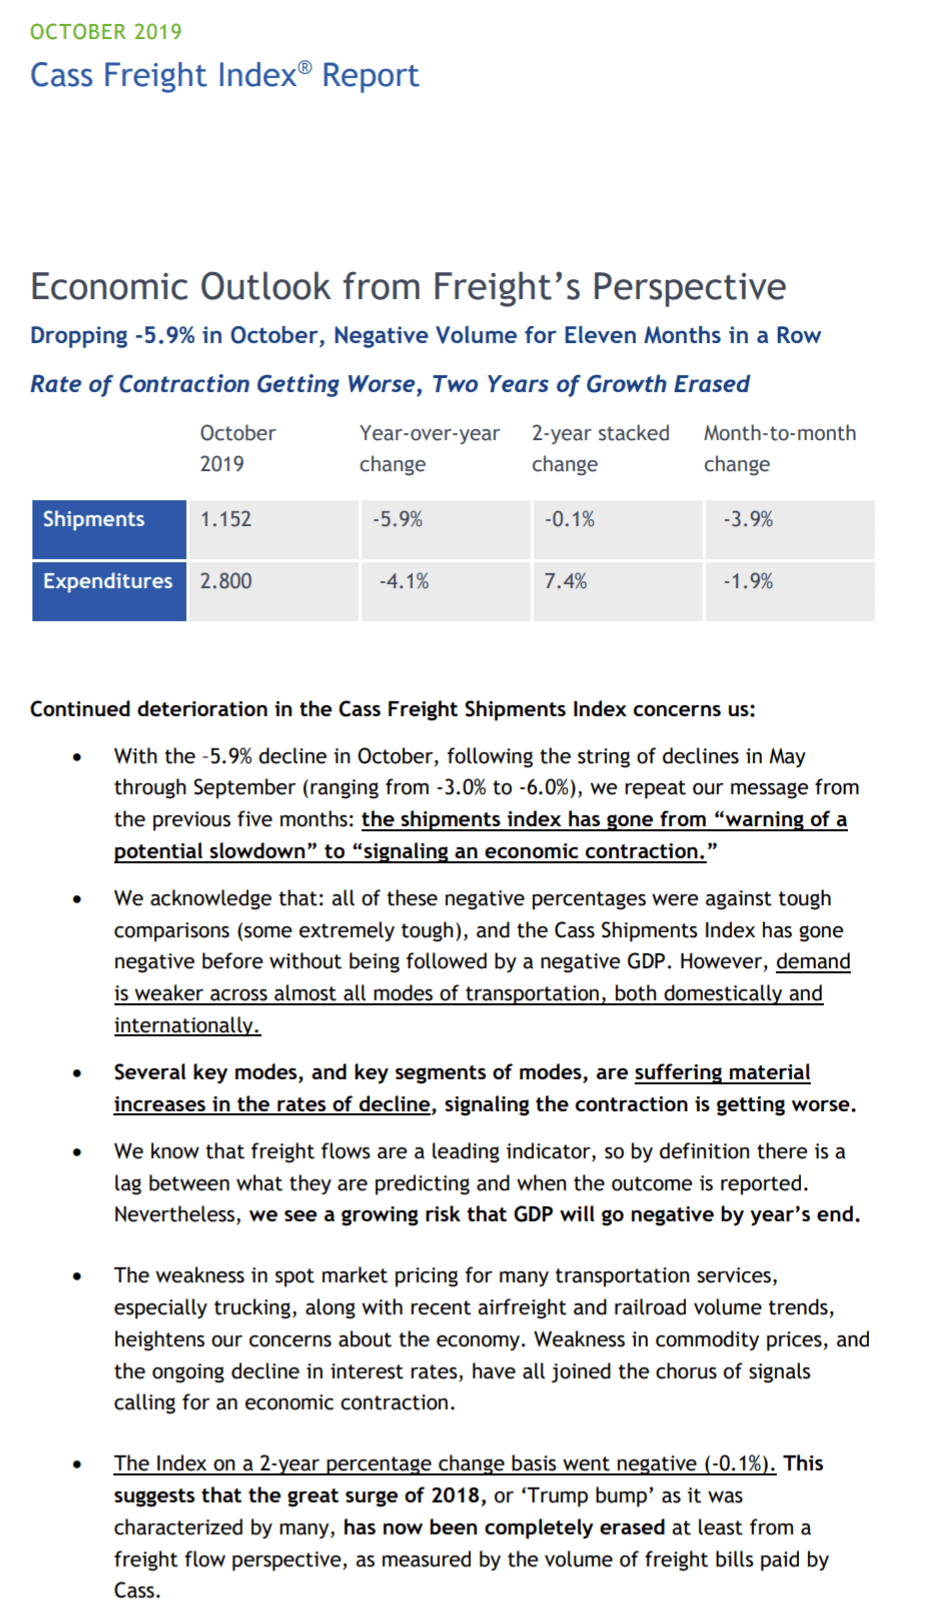
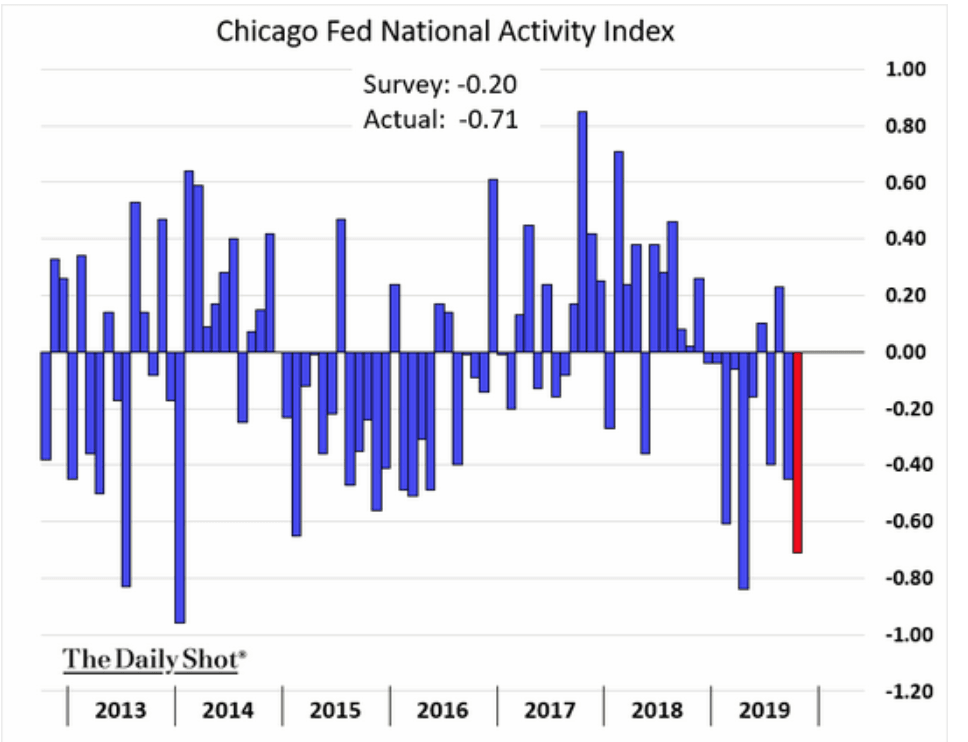
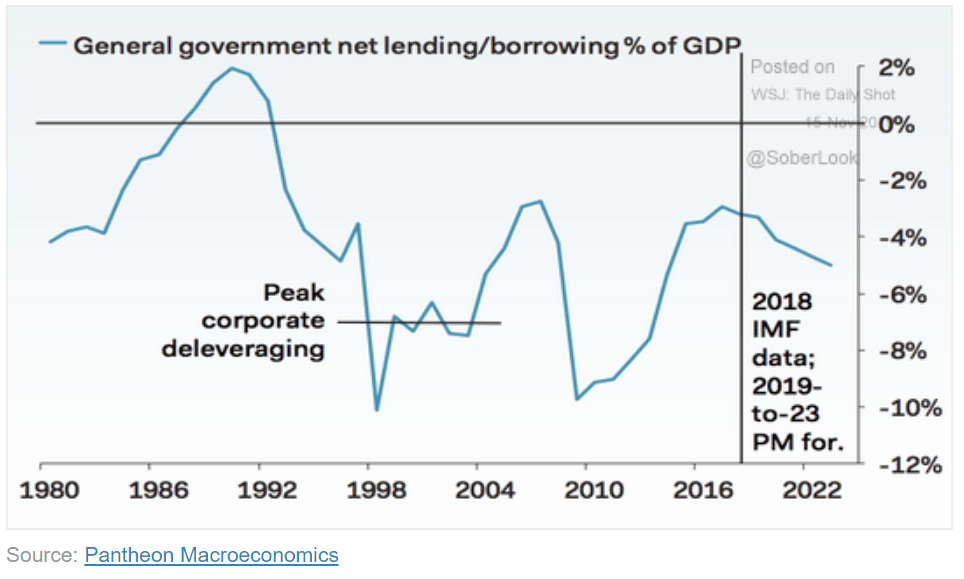
…the rest of the data was pretty much all bad:
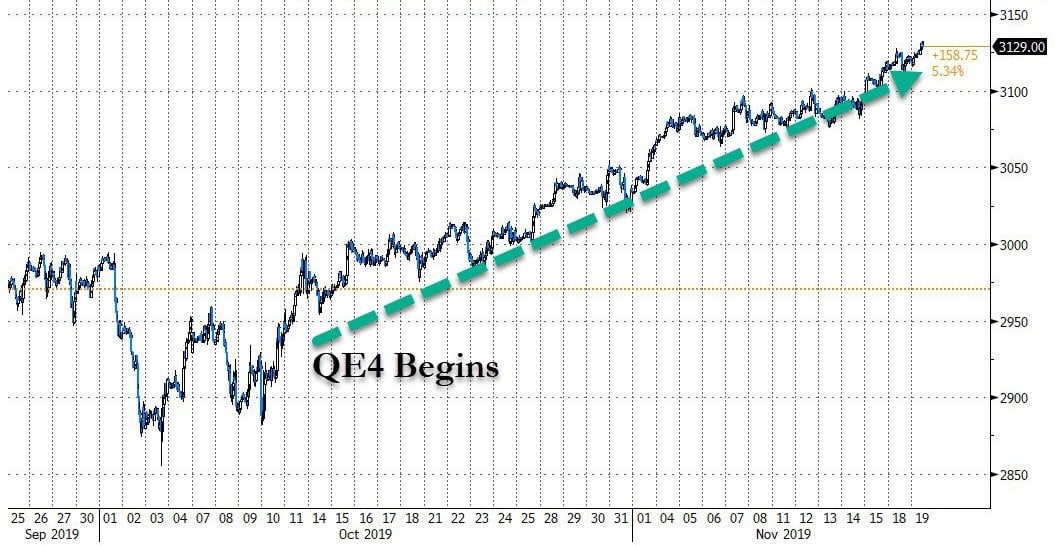
Yet stocks keep going up. Gee, do you think this might have anything to do with it?
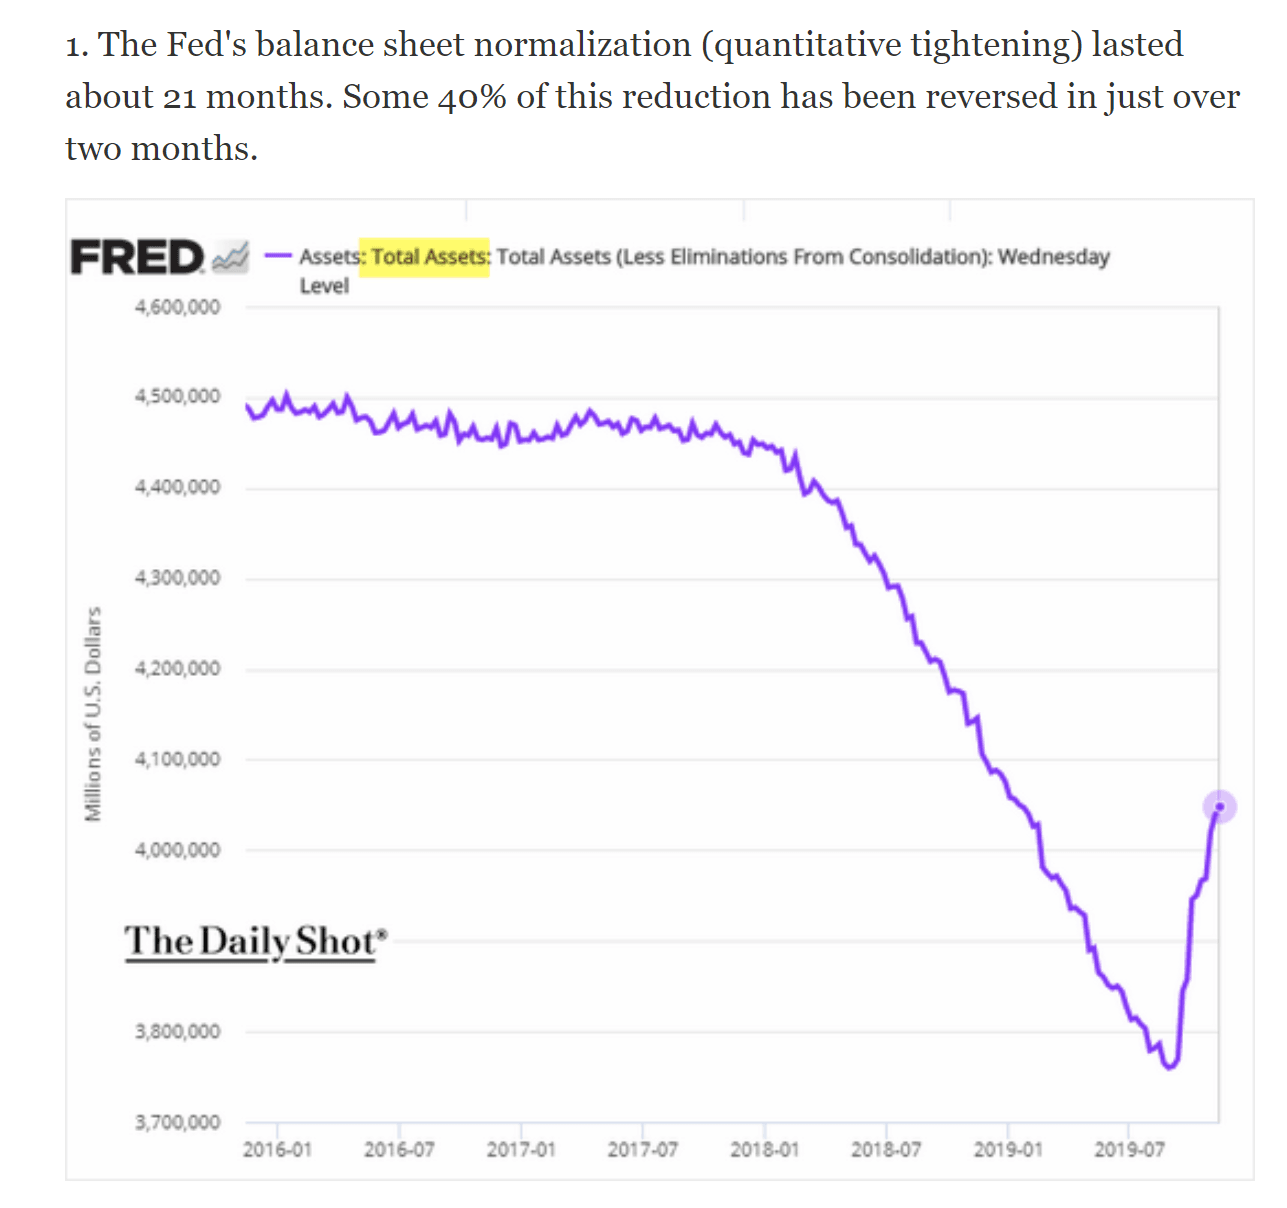
Why yes, I believe it does (chart courtesy of @zerohedge):
One of our losers this month was our long position in Westell Technologies Inc. (WSTL), which in November reported a horror-show of a quarter, with a 25% year-over-year revenue decline and a large GAAP loss driven only in part by a one-time inventory write-down. About the only good news from Westell was that it ended the quarter with $21.7 million in cash and no debt, and as burn going forward should be “only” around $1.2 million/quarter, the company still has at least 18 quarters of cash runway to return to break-even (it’s projecting to do so in five), and obviously many more than that if it can cut the burn along the way. Following the report and projection of break-even being reached in five quarters, the CEO stepped up and bought stock in the open market, so if nothing else, at least the guy’s putting his money where his mouth is; the company simultaneously posted a new investor presentation. We continue to own this company because it’s a $30 million/year, 38% gross margin business with over $1.25/share in cash yet it currently sells for just 1.04/share. Assuming 15.8 million shares, an acquisition price (by a cost-eliminating strategic buyer) of just 0.5x revenue would (on an EV basis) be around $2.20/share. Preventing such an acquisition is that Westell suffers from a dual share class, with voting control held by moronic descendants of the founder who refuse to sell company despite the stock’s horrible descent. However, I’m hopeful that someone will knock enough sense into their small brains to inspire them to salvage what’s left here, and thus walk away with at least something from what they’ve squandered. If they do that it should be at least a double from here, and likely more. In other words, it’s too cheap to sell but the board of directors is too incompetent to get me to buy more.
In contrast, our best performer this year by far has been Communications Systems, Inc. (ticker: JCS), which we accumulated over the summer at an average price of $3.05/share and which closed November at $7.79. (We slightly reduced the position in late-November in the $7.90s due to the price surge.) JCS is an IOT (“Internet of Things”) and internet connectivity & services company (the company’s multiple divisions are best explained by the slide presentation from its annual meeting and this terrific Seeking Alpha article), which in October reported fantastic Q3 earnings of .19/share with a 42% gross margin and $2.20/share in net cash. JCS is now making an annualized .68/share (based on the first nine months of the year, so as not to overemphasize one great quarter), however we should tax-adjust that to .54 as it’s been minimizing taxes by utilizing its NOL carryforwards. A 14x multiple on that plus the cash plus a $3 million valuation on $15 million of NOLs would value the stock at around $10/share. Additionally, the company is in contract to sell its headquarters building for $10 million; if we assume that closes, it would generate >$1/share in additional cash (although we’d have to reduce earnings by around .06/share as presumably it would then need to lease a facility).
We continue to own Aviat Networks, Inc. (ticker: AVNW), a designer and manufacturer of point-to-point microwave systems for telecom companies (here’s a great Seeking Alpha article describing the company), which in November reported a solid FY 2020 Q1. Although revenue was down slightly year-over-year there were significant improvements in both operating income and gross margin and the company’s guidance promised similar improvements for the full year. Additionally, Aviat has over $400 million of U.S. NOLs, $8 million of U.S. tax credit carryforwards, $212 million of foreign NOLs and $2 million of foreign tax credit carryforwards; thus its income will be tax-free for many years, so GAAP EBITDA less capex essentially equals “earnings.” Valuation-wise, if we assume $14 million in FY 2020 adjusted EBITDA (first-half guidance is $7.5 million) and remove $1.7 million in stock comp and $6.1 million in capex we get $6.2 million in earnings multiplied by, say, 14 = approximately $87 million; if we then add in approximately $32 million of expected year-end net cash we get $119 million, and if we divide that by 5.4 million shares we get an earnings-based valuation of around $22/share. Alternatively, if we look at Aviat as a buyout candidate its closest pure-play competitor, Ceragon (CRNT) sells at an EV of approximately 0.5x revenue, which for AVNW (assuming $240 million in 2020 revenue) would be 0.5 x $240 million = $120 million + $32 million expected year-end net cash = $152 million. If we value Aviat’s $400+ million in NOLs at a modest $10 million (due to change-in-control diminution in their value), the company would be worth $162 million divided by 5.4 million shares = $30/share.
We continue to own a small position in the PowerShares DB Agriculture ETF (ticker: DBA), as agricultural products remain the most beaten-down sector I can find that isn’t a “buggy whip” (something on the way to obsolescence) or cyclical from a demand standpoint. Perhaps “Phase 1” of Trump’s China trade deal plus recent harsh weather in the farm belt will finally be able to move it higher.
And now for the short positions…
We continue to hold a short position in the Vanguard Total International Bond ETF (ticker: BNDX), comprised of dollar-hedged non-US investment grade debt (over 80% government) with a ridiculously low “SEC yield” of 0.5% at an average effective maturity of 9.9 years. With Euro area core inflation at 1.3% and—due to the ECB’s money-printing ultimately headed much higher—I believe this ETF is a great way to short what may be the biggest asset bubble in history. Currently the net borrow cost for BNDX provides us with a positive rebate of 0.5% a year and I think it’s a terrific place to sit and wait for the inevitable denouement of this insanity.
Similarly, we remain short the long-term U.S. Treasury bond ETF (TLT), because as our federal budget deficit escalates (it’s now around $1 trillion a year), I think the market will raise long-term rates because of the Fed’s reticence to do so. The net cost of carry on this position is only around 1% a year, and when I see the money-printing craziness* beginning all over again, I consider that to be cheaply bought peace of mind. If you’re unfamiliar with the topic, read up on the insanity misleadingly called Modern Monetary Theory, because it’s happening right now.
*The short-lived era of net “quantitative tightening” among the big three central banks (the Fed, ECB and BOJ) is over. The Fed’s balance sheet contraction stopped in August and >$60 billion/month of Treasury buying resumed in September (allegedly only to meet short-term liquidity needs—a nonsensical “explanation” for debt monetization that enables D.C.’s profligate spending), while the ECB resumed €20 billion/month in QE and the BOJ continues printing.
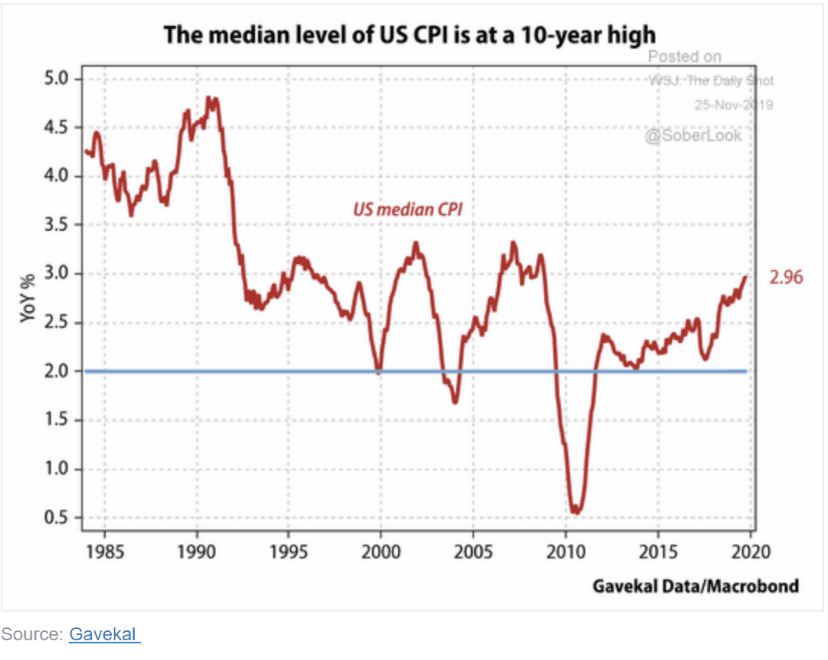
And meanwhile, with the 30-year Treasury bond yielding just 2.2%, inflation is already here:
We continue (since late 2012) to hold a short position in the Japanese yen via the Proshares UltraShort Yen ETF (ticker: YCS) as Japan (despite having substantially tapered its QE) continues to print over 3% of its monetary base per year after quadrupling that base since early 2013, and is now eyeing yet another “fiscal stimulus”! In 2018 the BOJ bought approximately 67% of JGB issuance and in 2019 it anticipates buying 70%! In fact, the BOJ’s balance sheet is now larger than the entire Japanese economy…
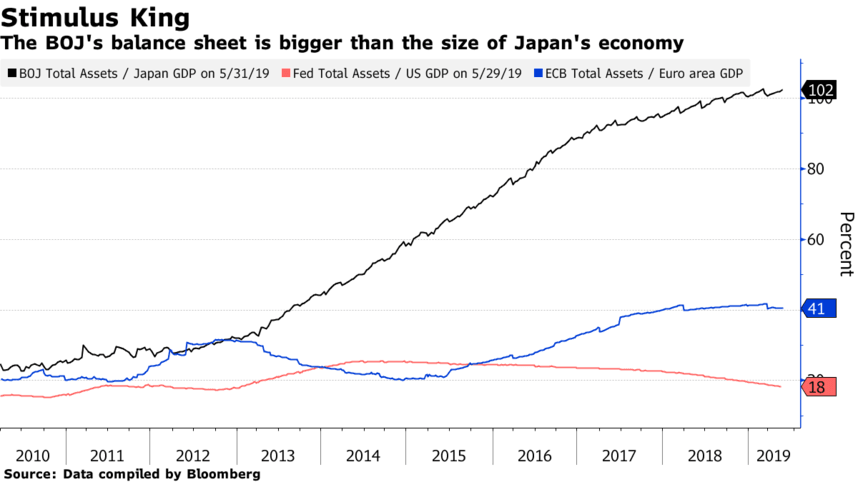
…as it owns nearly 45% of Japan’s debt and nearly 80% (!) of its ETFs:
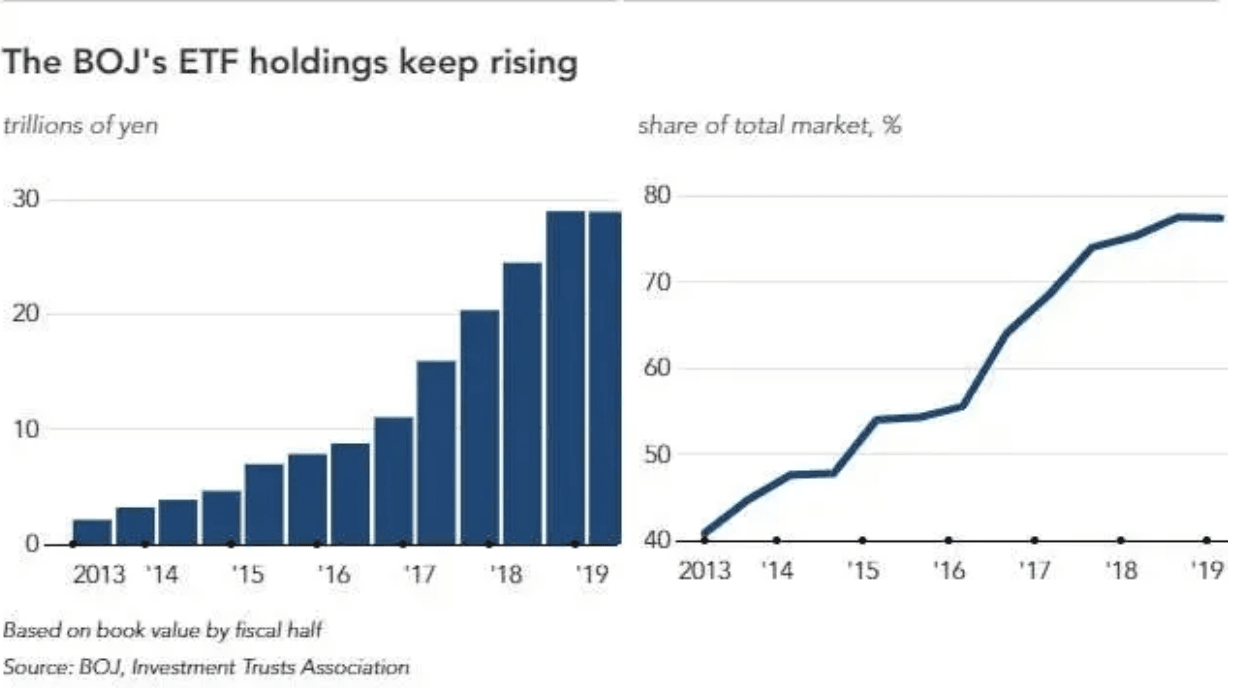
Just the interest on Japan’s debt consumes 8.9% of its 2019 budget despite the fact that it pays a blended rate of less than 1%. What happens when Japan gets the 2% inflation it’s looking for and those rates average, say, 3%? Interest on the debt alone would consume nearly 27% of the budget and Japan would have to default! But on the way to that 3% rate the BOJ will try to cap those rates by printing increasingly larger amounts of money to buy more of that debt, thereby sending the yen into its death spiral. And meanwhile, that budget deficit is expected to worsen…
When we first entered this position USD/JPY was around 79; it’s currently in the 109s and long-term I think it’s headed a lot higher—ultimately back to the 250s of the 1980s or perhaps even the 300s of the ‘70s before a default and reset occur.
We also hold continue to hold short positions in Netflix (NFLX) due to its egregious valuation within the context of terrible cash burn and increasing competition (particularly from Disney), Square (SQ) due to its egregious valuation and a stock-dumping CEO who so effusively praises (and enables) Elon Musk that I suspect he’s equally untrustworthy (and indeed in June the company fired its auditor), Carvana (CVNA) due to a laughable business model with escalating losses, a founder with a sketchy past and insiders who dump stock steadily, Wayfair (W), an egregiously bad on-line furniture business with yet another team of insider stock-dumpers, Invitae (NVTA), a non-proprietary, money-losing genetic testing company showing negative scale and Roku (ROKU), an absurdly valued (almost 20x revenue, with increasing losses) company on the way to technical obsolescence (new Smart TVs don’t need its product) with tons of insider selling.
Thanks and regards,
Mark Spiegel


