Massif Capital commentary for the fourth quarter ended December 31, 2019.
Dear Friends and Investors,
The core portfolio of Massif Capital was up 3.7% during the fourth quarter of 2019, bringing the year-to-date performance to -3.9%. A detailed report on individual account performance will be provided to investors in the coming days.

Q4 2019 hedge fund letters, conferences and more
Resource Conversion - Alternative Perspectives Wealth Creation and the Capital Cycle
Our regular focus on the capital cycle has much to do with the industries we focus on. Businesses within basic materials, energy, and heavy industry are generally characterized by strong economies of scale and capital intensity. Firms typically have either high fixed costs or significant upfront capex that need to be earned back in cyclical markets that can have significant product price volatility. The investment cycles for major reinvestment often range from 10 to 40 years but the actual useful lives of the assets can sometimes stretch well beyond 40 years. Businesses of this nature lend themselves to capital cycle analysis because of the clarity of the investment cycle.
Another reason we tend to focus on the capital cycle is a result of our belief that operating earnings represent just one of many ways a firm can create wealth. Some of the other way’s management teams can create wealth include:
1) Opportunistic acquisitions and divestitures
2) Opportunistically launching/developing new projects
3) Having attractive access to capital markets
4) Taking advantage of asset mispricing’s
In short, creating wealth via the firm's balance sheet, as opposed to creating wealth through earnings and operations. Which is to say we view the firm as not just having the characteristics of a going concern, but also as an institutional structure with resource conversion capability, with the resource being the balance sheet. In this way, we share an understanding of the firm with investors such as the late Marty Whitman.
For Whitman, a going concern view of a firm was one focused on the creation of flows from operations (earnings or cash). Most businesses have going concern attributes, but such a narrow view of the firm limits the ability of an analyst to capture the value potential of a business fully. The balance sheet represents an important and often unappreciated component of a business’s wealth-building capacity. Internally we tend to think of our portfolio as comprised of three general types of investments: ballast positions, asymmetric return positions and income positions. For us, income positions tend to be businesses viewed primarily on a going concern basis. Income positions must pay a dividend, and so the primacy of flows generated from operations is essential. On the other hand, a resource conversion business creates wealth by putting resources (the balance sheet) to other users and thus can often result in a firm with asymmetric return potential.
Our understanding of resource conversion is slightly broader than Whitman’s, but the idea is similar. As an example, one of our most recent investments, Africa Oil, which is an asymmetric return position, is a pure resource conversion investment. The company has no going concern value; they have no flows of income or cash flow and do nothing that will result in recurring accounting earnings. Nevertheless, the firm has the highest expected return in our portfolio, and the reason for that is that the balance sheet contains ample resources that the management team has a sensible plan for deploying into acquisitions, investment actives, and if history is any guide, eventually a possible monetization of the entire balance sheet via a sale. Resource conversion, although trickier in some ways then operations, often has the potential for exponentially higher returns relative to the return that can be earned from flows.
In thinking about companies as resource conversion mechanisms, the capital cycle is clearly important as it presents opportunities for management teams to make resource conversion decisions. For example, the gold sector. We currently have three investments in the gold sector. The flow results (cash flows and earnings) for two of those investments are strong, but our significant capital appreciation in each case stems primarily from resource conversion:
1) Barrick Gold merged with Randgold and has divested several mines (current unrealized gain of 56%);
2) Continental Gold is selling itself to a Chinese firm (current unrealized gain of 39%);
3) Equinox acquired California gold assets at a discount and is merging with LeaGold (current unrealized gain of 31%).
All of these are examples of resource conversions. Continental demonstrates another interesting type of resource conversion that is unique to natural resources businesses: the conversion of natural resources into economic resources. Another way to think about it might be to say mining firms, or natural resources companies more broadly, are always looking to buy mineral rights or access to natural resources and infrastructure for development of those resources in an open market at a discount to the value of those assets when brought together under a single corporate umbrella. Management converts cash on the balance sheet, access to capital markets, and natural resources into higher-value economic resources.
When you combine the capital cycle with the view of a firm as a resource converter, the cycle takes on increased importance because we can directly link the cyclicality of capital flows with the resource opportunity set of management teams. Looking at the gold sector again, the reason we had a flurry of activity was because of where the industry sits in its capital cycle. The result is that companies with cash can find assets at attractive prices and are willing to accept some turn around risk (Equinox and Barrick) and those who have the prime de-risked balance sheet assets that are in high demand and short supply (Continental) are in a prime position to sell themselves at favorable prices.
So, as we enter a new decade, what should we be looking for in the markets? Where is capital constrained? Where are there businesses that have assets on the balance sheet that management can use to grow the NAV of the business? What trends will drive management teams to convert resources into other forms of greater value? One interesting area to watch in terms of guiding our search for such opportunities is the transition to a low carbon economy. There are multiple reasons for this, but the opportunity principally starts with the scale of the transition needed and the asset base of the current eco-system. The scale of the investment needed is estimated to be in excess of $40 trillion, meaning the capital investment cycle of many industries we focus on could soon go into overdrive, and the scale of the current eco-system of assets in the energy, basic materials and industrial sectors is also in the trillions, meaning there is significant material for management teams to work with as they seek to build wealth for shareholders.
Investing in a Transition to a Low Carbon Economy
The transition to a low carbon economy is going to be (assuming it occurs) a complex, non-linear, non-deterministic, and highly uncertain series of events. It is a ripe environment for active management. Tangible elements of the energy system of the industrial complex and the basic materials industry will need to change dramatically. The participants in the various businesses and their strategies and investment patterns will also need to change. There is also a high degree of regulatory and policy change that will accompany the transition. Volatility in these industries is going to be the general operating state for at least the next few decades.
The headlines and day to day discussion of the transition to a low carbon economy have also been woefully inadequate to educate investors. This is not a critique of coverage, but rather a reflection of complexity. The focus on electricity assets (utilities and renewable development) and the electrification of the transport industry (electric cars) means that the entirety of the transition is viewed through the lens of just two industries that represent the lowest hanging fruit of the transition.
This situation adds up to an opportunity in which a significant number of the participants in the transition are outright ignored (cement, chemicals, and glassmakers for example). Whole industries are attracting negative attention for their environmental footprint despite the fact their futures are often more robust and likely longer than forecasted (mining firms and oil and natural gas companies). Finally, there are many theoretical opportunities that don’t yet have investable companies (hydrogen, carbon capture).
The scale of the transition challenge is difficult to articulate, and as such, the opportunity set is difficult to draw a border around. If we assume that global energy demand increases at a CAGR of 1.7% pa, between now and 2050, or 40% slower than energy demand growth since 1900, and we assume the rate of investment in renewables trebles to $1 trillion a year, it will take 55 years for wind and solar to ramp up to just 50% of the worlds energy mix.1 This makes any claims of achieving quick decarbonization of the energy system in the next few decades with only renewables seem improbable. Nevertheless, many people believe it will occur; this false narrative alone creates opportunities on both the long and the short side. Of course, the scale of the problem does not actually capture the full extent of the challenge or opportunity set.
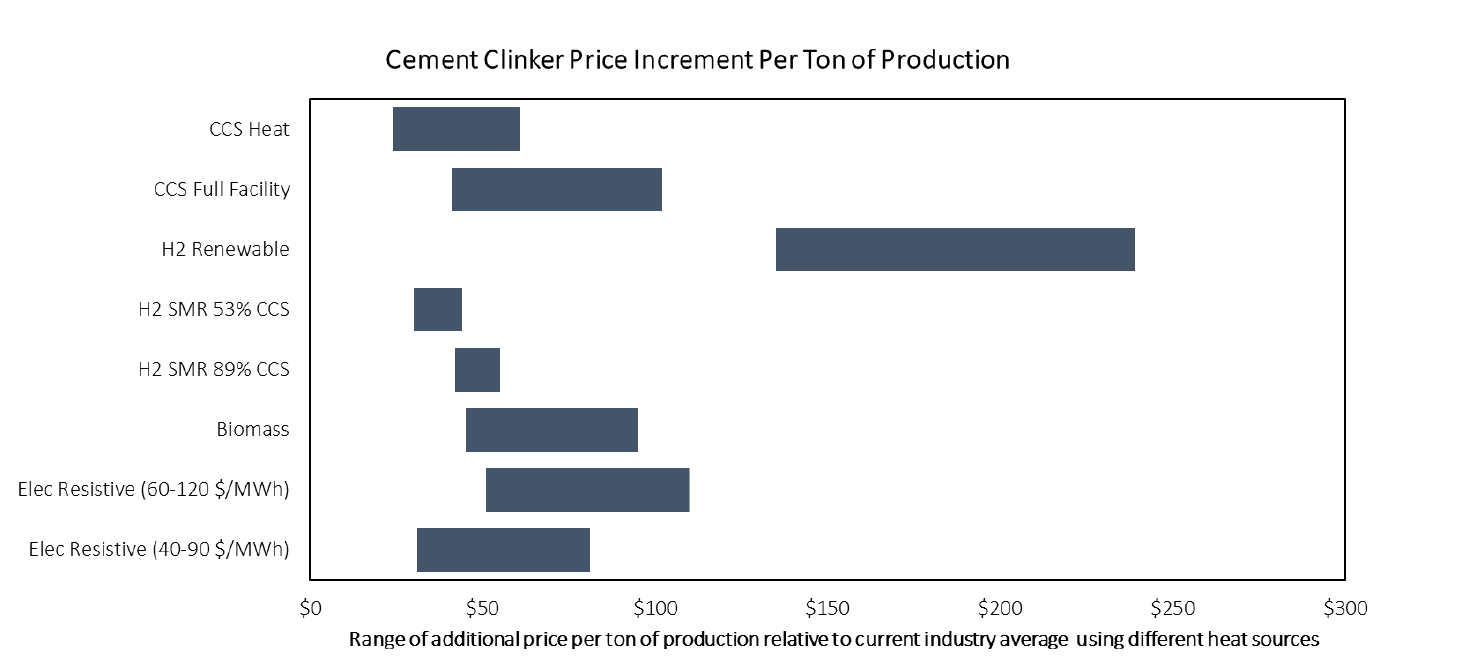
Most of the activists currently peddling solutions to climate change suggest we have all the tools we need. That’s not true. Take for example, heavy industry, a core competence for Massif Capital, and the source of roughly 22% of global CO2 emissions. To put that into perspective, all the world's cars and passenger jets account for roughly 8% of global emissions. Where do all the world’s heavy industry emissions come from? They come from a mix of processes but principally from the tremendous amount of heat most heavy industry requires to convert natural resources to basic usable materials. It sounds like an easy enough problem to solve, but it turns out not to be. Let’s take cement, a dull, unsexy, and mostly ignored industry, that, if it was a country, would be the world's third-largest emitter of CO2. It takes temperatures of 1,450○C to make cement. There are a couple of ways of producing those temperatures. They include electrical resistivity, burning biomass, burning hydrogen, burning natural gas, but generally, it's accomplished by burning coal. So, what does the transition from coal to a “green” source of heat due to the cost of cement:
The chart above comes from analysis conducte by the Combia Center on Global Energy Policy. Roughly 59% of carbon emissions from cement come from direct combustion to produce heat, with the remainder coming principally from chemical reactions associated with the process of making cement. A dry rotary clinker kiln (there are also less efficient clinkers called wet clinkers) requires heat of 1,450 C, a tempature that limits potential non-carbon heat sources to Hydrogn (H2), biofuel combustion, and electric resistive heating. The current industry average, presented in the chart above as the $0 line, is based on heat production from the combustion of coal, which is commonly used. The various heat sources presented above include:
CCS Heat: Traditional heat source with Carbon, Capture and Storage applied to heat.CCS Full Facility: Carbon, Capture and Storage applied to full process.
H2 Renewable: Hydrogen produced from renewables.
Biomas: Typically wood, cellulosic material or vegtables fats converted to fuel.
Electric Resistivite at different electrcity costs: Heat generated within material by passing a current through it, generally via the use of graphite electrodes.
H2 SMR 53% CCS & 89% CCS: Hydrogen produced from Steam Reforming Methane combined with various levels of Carbon Capture and Storage.
Source: Massif Capital, Low Carbon Heat Solutions for Heavy Industry, Columbia Center on Global Energy Policy
In going green, the average cost of cement will increase by more 100%. At the same time the UN Sustainable Development Goals, a global blueprint to achieve improved quality of life for the roughly 6.6 billion people who live outside the OECD club of rich countries (principally Europe, Japan, the United States and Canada), calls for $60 trillion in infrastructure investment. Most of which will require a lot of cement. As carbon taxes begin to be introduced in the developing world a significant advantage accrues to the producer who can figure out how to produce cement in a low carbon way. Carbon taxes have been introduced in various forms in 15 European countries, Canada and certain US jurisdictions. Carbon taxes are currently being discussed/in early stages of implementation in at least 6 major Asian economies including Japan, China and India.
The cement sector is thus facing a significant potential expansion, at the same time as emissions need to fall fast. From a technical perspective, it’s a significant challenge, and from a financial perspective, it seems like an even more significant challenge. After all, many of the world's largest cement producers survive on a return on invested capital of less than 5% and their consumers are usually price sensitive. According to a recent Chatham House Study2, the low expectations around the prospects for a breakthrough in cement emissions is reflected in the limited attention it is given in most low-carbon pathways. We have reviewed most of the pathway reports cited and find the following quote in keeping with how they deal with the sticky issue of difficult to decarbonize industries: Sectors such as cement, chemicals, iron and steel are areas “where emissions are large and significant, and reduction poses undeniable challenges.” End of discussion.
Not only is there no viable path to decarbonizing economy in short order (say the next decade) but the need for many of the firms we invest in that might be considered heavy carbon footprint businesses (steel, infrastructure, cement, chemicals, construction, etc.) will remain for decades to come, either in their current form or in new forms. Many of these industries not only lack viable paths to decarbonize but they have also attracted limited attention. In that lack of attention, there is an opportunity, and when the world finally gets around to shining a light on these industries, there will be another opportunity.
We would argue that the transition to a low carbon economy represents the single largest macro-economic tailwind for our portfolio since China first started making waves in our areas of focus in the early 2000s. Existing assets will need to be sold, repurposed, written off, or management teams are going to need to focus on maximizing asset returns on altered (sometimes shortened) timelines. By some estimates, there is as much as $22 trillion in high carbon assets that will need to be retired at an accelerated rate and $30 trillion in existing assets that will need to be made more efficient. New assets, perhaps as much as $40 trillion, are going to need to be constructed, new processes developed (especially in the industrial sector) and new firms will arise to replace the positions of those that have failed to adapt to the new and volatile environment.4 Disruption in the digital world is often viewed as creating opportunity, just wait until we start to see the returns possible from the disruption in the physical world, in industries that sometimes have not been significantly disrupted for a century.
For the reasons articulated above, viewing our industries through the lens of climate change represents an interesting and idiosyncratic approach to our search for opportunities. Addressing climate change and decarbonization creates various real-world constraints on business strategies. Constraints mean management teams must make new strategic decisions, sometimes significant ones. We believe that these pinch points create and will continue to create opportunities for investors going forward. Take, for example, oil companies. Management teams for oil companies must address multiple strategic questions at the moment:
1) How fast will the transition occur? A company’s view on this question will determine its response to transition challenges. Depending on how they answer that question, a firm may need to change their operating model from a focused operation to a more diversified operation. For example, Exxon Mobil has decided they are an oil company and are not diversifying their capital investments into other energy assets; they believe in a slow and evolutionary transition. Royal Dutch Shell has decided it is an energy company and is deliberately transitioning to a more diversified business model.5 They believe the transition will be quicker and more profound.
2) Will renewable power technologies and electrification be able to decarbonize the energy sector? If not, how much demand will there be going forward for oil/natural gas products? Again, a company’s stance on this question will determine where it looks to deploy capital for many years to come. Do they focus on liquids? Do they focus on gas? Maybe it's best to abandon upstream assets and focus on downstream assets.
3) Are existing technologies enough to accomplish the transition, and if not, where can management teams deploy capital to take advantage of the gap between energy demand and climate change targets? If a management team believes the transition will be slow, they might also believe that carbon capture technology is a good place to allocate capital. Of perhaps plastics is the right place to invest; 10% of daily global oil consumption is used in making plastics. The steam crackers that create the building blocks of plastics consume 40% of all the energy in the entire petrochemical industry. Perhaps low carbon approaches to making plastic are a good place to allocate capital?
The strategic challenges that management teams in the industries we focus on will be confronted with going forward are significant. The choices they will have to make to survive and thrive are also significant, and therein lies part of our opportunity.
Despite the growing political, societal, and financial market pressure to accelerate decarbonization, there are physical limitations as noted above. This creates a bifurcation between what is believed and “understood” by the investing public, and what is possible. The climate change narrative thus creates cycles of market sentiment that result in significant misallocations of capital on the part of the investing world because subjects like decarbonization and climate change do not lend themselves to sound bites and simplistic answers. An example of this might be the recent boom and bust in lithium during the 2016-2018 period. Everyone knew that electric vehicles (EV’s) where a fast-approaching future, that EVs needed batteries and that batteries needed lithium; as such everyone knew they needed to invest in lithium. We are now happily sifting through the wreckage of a popped lithium bubble in search of bargains.
Furthermore, because of the nature of the conversion, or more specifically, its lack of completeness, investors have tended to view their investment options as a choice between either investment in renewables and future “green” industries or investments in hydrocarbon and old economy industries. This is a false choice that fails to recognize the uncertainty surrounding not only the speed of the transition but also the end state of the transition.
Our belief is that a balancing of investments within the portfolio amongst companies that are seeking to maximize the return from their current limited life assets (old-economy and hydrocarbon businesses) and those positioning themselves for the transition and long-term survival (renewables, mining firms, and green industries) is the only acceptable way to invest in a world of transition. We would argue that neither a wait-and-see strategy (a portfolio heavy on oil and natural gas, traditional industrials, etc.) nor a hasty move to renewables and carbon light industry is a good way of positioning a portfolio for the transition.
We suggest gradual portfolio repositioning as new business models demonstrate themselves, and old businesses intelligently monetize the remaining assets on their balance sheet. A portfolio fly-wheel if you will, in which the profits of the old world and recycled into the business of the new world as they prove themselves and as the value presents itself. This comprehensive adaptation strategy avoids the shortcomings of so-called ESG
6 ETF’s and impact investing vehicles7 but also protects investors against the potential uncertainties associated with either a faster or slower transition.
Portfolio Review
We have recently begun accumulating a position in Africa Oil (AOI), a Canadian oil and gas exploration company that is trading at a 7.5% discount to the cash and equity investments on the books. As of this quarter, the firm’s liquid asset value is comprised of a 35% position in Africa Energy, an 18% position in Eco Atlantic, and a 30% position in Impact Oil & Gas, totaling ~ $185 million in equity investments. Combined with $436 million in cash, our remaining discussion of the firm’s assets is given zero value by the market today.
The firm is close to finalizing the purchase of 50% interest in a Joint Venture that has working interests in three of the 20 largest offshore producing oil and gas fields in West Africa and has a 25% working interest in the first major Kenyan oil development. It has size, two world-class deposits and is backed by the Lundin family. It is a very early stage company but adjusting for risk; we think the opportunity is compelling.
Of interest is the firm’s recent agreement with Petrobras to acquire a 50% interest in Petrobras Oil and Gas B.V (POG-BV), a Netherlands headquarters private subsidiary owned by Petrobras, BTG Pactual and Helio Investment Partners. POG-BV has stakes in the two offshore Nigeria fields, which as of 2017, had entitlement reserves of 204 MMbbl. The asset holds two of the four largest offshore producing fields in Nigeria: Akpo (OML 13) and Agbami (OML 127), which account for ~20% of Nigeria’s total oil production. Both fields have consistently exceeded production forecasts with >95% uptime and have low lifting costs of $6 per barrel and a strong track record of 2P reserve replacement. In addition, POGBV has an interest in Egina (OML 13) which is the latest large-scale offshore Nigeria field to start-up production (December 2018). Once it reaches plateau production, it will produce 200,000 bopd, approximately 10% of Nigeria’s production.
The original transaction value was $1.8 billion CAD, with a lockbox date set in January 2018. Management has informed us that about $1.3 billion CAD in dividends has been paid out of the POG-BV since January 2018. POG-BV’s cash operating costs per barrel averaged $9.7 CAD over the period of 2015-2018 with year FCF over the same period of roughly $530 million CAD per year. The transaction will be completed out of cash on the balance sheet and a $333 million CAD loan from BTG Pactual, one of the owners of the 50% of POG-BV that AOI is not buying.
Once completed, AOI will have a working interest in three fields producing more than 500,000 bopd. Assuming $50 oil, no field extensions at Agbami, and a somewhat punitive 15% discount rate, we believe this Nigerian equity transaction is worth about $806 million or $1.71 per share.
Tangible assets on the balance sheet are principally related to the ongoing development of the South Lokichar field in Kenya. This is the first-ever major oil production in Kenya with its first oil cargo export occurring this past fall. AOI has a 25% working interest in three production blocks with Total and Tullow sharing the remaining interests. The project is a multi-stage project with a final investment decision on the foundational phase expected in 2020-2021. The first phase is targeting 210 million barrels of oil over the life of the project with an initial production of 80,000 barrels of oil per day. Incremental development is expected to boost production to over 100,000 barrels of oil per day. At $50 per barrel oil, with no terminal value and a 20% discount rate, we believe the Kenyan assets are worth about $832 million dollars today, or $1.8 per share.
With $236 million of cash, $185 million in equity investments, $806 million attributed to a 50% interest in the Nigerian JV, and $832 million attributed to the Kenyan assets, we believe the firm is worth $1.7 billion, a 200% increase from the equity value at the time of this writing.
Traveling about 9,000 Km west from offshore Africa to the Atacama Desert in South America, we have growing optimism about several companies in the lithium market and are looking to build up to two positions in the industry over the next 12 months. We think patience serves us well, but believe we are close to several compelling entry points. While a severe price decline in equities is fresh in many investors’ memories, battery quality lithium chemicals still sell for almost double what they sold for in September of 2015. The equities of the companies selling the lithium on the other hand, sell for about the same price.
Limited cash margins for the marginal producers suggest we may be nearing a bottom. Current lithium prices of ~$9,000 per ton are approaching the cash costs of many Chinese producers that purchase and then convert spodumene to lithium carbonate at ~ $7,000-$9,000 per ton. From our vantage point, it appears that spodumene inventories remain elevated, which may continue to place downward pressure on prices in the short term. The midpoint of 2019 saw inventory levels reach 90 days, almost double the two-year average of ~50 days as new entrants from Australia hit the market in late winter and early summer. With spodumene now selling at ~$500 per ton, we are very close to the cash costs of many of the large Australian producers.
Our caution, and thus patience, stems from several factors:
1) Subdued pricing in the short term is going to make capacity additions a challenge. Pulling back on previously announced expansion plans, or any lack of volume growth is going to hurt equities but help the physical market. The second half of 2019 saw ALB and SQM scale back production increases, and we expect this continue through the first half of 2020. For the capacity to meet robust demand; however, long term pricing will likely need to include an incentive component on top of marginal cost. Lithium America, a junior miner we are following closely, has argued that a $10,000 per ton long term price is potentially conservative given the challenging financing environment for junior miners. Industry specialists, Benchmark Minerals, calls for a practical pricing floor of $12,500 per ton, a function of marginal cash costs of $7,000-$8,000 per ton, a post-D&A floor of $9,500 per ton and another $3,000 per ton incentive premium.
2) The financial situation of many chemical converters in China is worrisome. Seemingly in need of cash, many are selling a product below cost. The situation is unsustainable, but it is nonetheless unleashing another move down in carbonate and hydroxide prices, both in and out of China as these companies are looking to move products aggressively.
3) SQM continues to harp on regaining market share, which has increased its willingness to sell large quantities of lithium to China and subsequently pulled ALB into a similar selling pattern. We have seen this behavior twice from SQM since they began production in the 1990s. While claiming to build inventory and pursue a disciplined market approach, volume and pricing data suggests the opposite. This is not sustainable.
We have dipped our toe into the market and taken two small positions in our preferred producers. We will scale the positions up as the industry winds change, and we see further capacity curtailments. Our estimates suggest that a $1,000-$2,000 drop-in price puts about 30% of global capacity at risk. While pricing is opaque in the industry (both as a function of multiple end-use products, almost every battery requires a slightly different chemistry, and the limited visibility we have into Chinese manufacturing firms), we will continue to monitor SQM’s volume and pricing characteristics which we believe serve as a good proxy for the overall industry.
Finally, it will be important to monitor the earnings multiples that the market places on lithium companies over the next several years as a gauge of industry understanding by investors. We have seen lithium equities trade more in line with commodity chemical companies whose business models are heavily influenced by spot prices as opposed to niche chemical producers. Commodity chemical companies often cycle between a 5x-8x EBITDA multiple as opposed to niche chemical producers that trade at multiples between 8x-18x. We believe the lithium business is more akin to a niche chemical business. As the market comes to recognize the complication involved in producing battery quality lithium, we expect the sector to begin trading more in line with niche chemical producers.
Exited & Divested Positions
We exited our investment in Cobalt 27 with a 9.15% gain over six months. Although we were disappointed to exit this position so shortly after entering it and believe the private equity firm that bought the company shortchanged shareholders, we are pleased with the gain and pleased to be rid of the firm’s management team. Although we spoke with the management team several times before our initial investment and believed they were well-positioned to grow the business/close the value gap when we first invested, the events surrounding the sale of the company soured our opinion. They have been added to our list of management teams to avoid in the future.
On December 2nd, Zijin Mining Group, who had previously purchased Nevsun, an early portfolio position we exited with a 73% gain over two years, announced an all-cash offer for Continental Gold. Perhaps because of the hot gold market, the offer was a robust $5.50 CAD a share, very close to our expected full value of the business when their Columbian based mine started operations. As such, this was a welcome offer. Although the transaction has not yet closed, the purchase has the support of both the largest shareholder, Newmont, and the management team, and thus we expect the transaction to receive shareholder approval during a vote that will occur later this month. If/when the transaction closes, we will book a roughly 41% return on a 7-month investment. We have not yet identified the firm we would like to replace Continental in the portfolio, but our preference will be for another gold miner that is in pre-production, but we are entertaining several other gold opportunities as well.
Finally, we closed two of our energy positions this quarter, taking a loss on both. Our concluding thoughts on Teekay can be found in our 3rd quarter letter to investors, but to say we are disappointed in the outcome of this investment would be an understatement. Unlike Teekay, Diamond Offshore never seemed to right itself as a business since the oil market turn in 2014/2015, and as such the stock never seemed to gain any positive momentum. Drillship utilization in key geographies has not normalized keeping a lid on day-rates, and the management teams positioning of the firm as the leading provider of moored drilling ships does not appear as vibrant a strategy as we once believed. The tangible book value of Diamond’s assets remains elevated relative to the share price but the ability to management to put those assets to use in a way that realizes the value in a timely fashion is in question. Absent an abrupt normalization in day rates across a wide variety of offshore drilling rig classes, which is not our base case, earnings power and cash flow generation in the near term is very limited and the ability of the firm to convert the resources on the balance sheet into something more appear equally limited. Management looks almost uninterested in fact at trying to take advantage of the depressed market for rigs. After adjusting our thesis to account for these realities, our valuation approached current market prices and thus, the positions return profile was exceedingly poor. Given the opportunity set in the oil and natural gas space, which we view as significant, we believe we can put the capital to better use in short order.
Notes on Existing Positions
Two promising developments occurred within the mining segment of our portfolio over the fourth quarter. First, Equinox Gold announced an at-market merger of equals with Leagold Mining in December, creating one of the top producing gold miners focused exclusively on operations in the Americas. Second, Lucara Diamond released their underground feasibility study, materially increasing Karowe’s mine life and creating a positive outlook for the firm for many years to come.
The merger announcement between Equinox and Leagold in mid-December completely redefined the firm, taking it from a 200,000-ounce a year gold producer to a 1-million-ounce a year producer by 2021. Scale can matter in mining, and this deal brings forth several interesting catalysts. The new market capitalization is likely to result in EQXs inclusion in several prominent gold indices, increasing the institutional and retail exposure the firm receives. Following the merger, the new company will have a market cap of roughly $1.75 billion and a strong daily volume, as such EQX is likely to be included in the NYSE Arca Gold Miners Index and thus become part of the VanEck Vectors Gold Miners ETF, a positive tailwind for the firm’s open market price.
The increase in production and larger reserve base also increases the firm's access to capital markets at what we believe would be favorable rates. The combination of favorable capital markets access and exploration upside at several properties means management has an opportunity to create significant value with the drill bit. Our enthusiasm for the deal is shared by the Chairmen of EQX who will retain a 9% ownership position in the company and invested $40 million in an at-market private placement, a price roughly 9% higher than the average cost of Massif Capital investors.
As always, we appreciate the trust and confidence you have shown in Massif Capital by investing with us. We know that entrusting hard-earned capital to a young emerging fund is difficult and hope that you will never hesitate to reach out if you have any questions or concerns about what we are investing in.
Best Regards,
Will Thomson Chip Russell


