
Investing Is Neither Simply Science Or Math – “Davidson” submits:
Q3 2020 hedge fund letters, conferences and more
Investing Is Not Science Or Math
Investing is not science and math. It is far more judging management’s actions in the context of a fuzzy very broad view of human activity which we call economic activity. Coming to a perspective of the whole is always more a collage than pieces fitting snuggly together. Nothing is ever a perfect fit. What often is unsaid the ebb and flow of the background noise. By background noise, what is meant is the ebb and flow of market psychology which can have an economic impact of its own. Even if it is not long lasting, market psychology, if prolonged in one direction, impacts market behavior if enough believe in it. One has to always look through market psychology and decide if it is supported by economic trends even as it can have an impact on these trends. It is sorting out which information is most important and even in the face of building pessimism/optimism make decisions which are more contrary to consensus to locate the better risk/returns. The past 3yrs has seen an enormous amount of ebb and flow. Through it all, key signals have remained very positive.
It is never one indicator but a mix. Hindsight helps bring a better understanding than could had at the time. It is a tool one should deploy as often a one feels the need. It requires reviewing the indicators and their context at the time using outcomes not known at the time. One keeps track of what investors/advisors are thinking by saving articles which capture the mood of the current market drivers. Some days one will find 20+ which seem relevant at the time. Hindsight will always identify some as more important than was believed the first time one saw them. Information, especially investment information, is never as clear on the first reading. It always becomes clearer in hindsight.
The Interplay Between The CAB, TTI And IRI
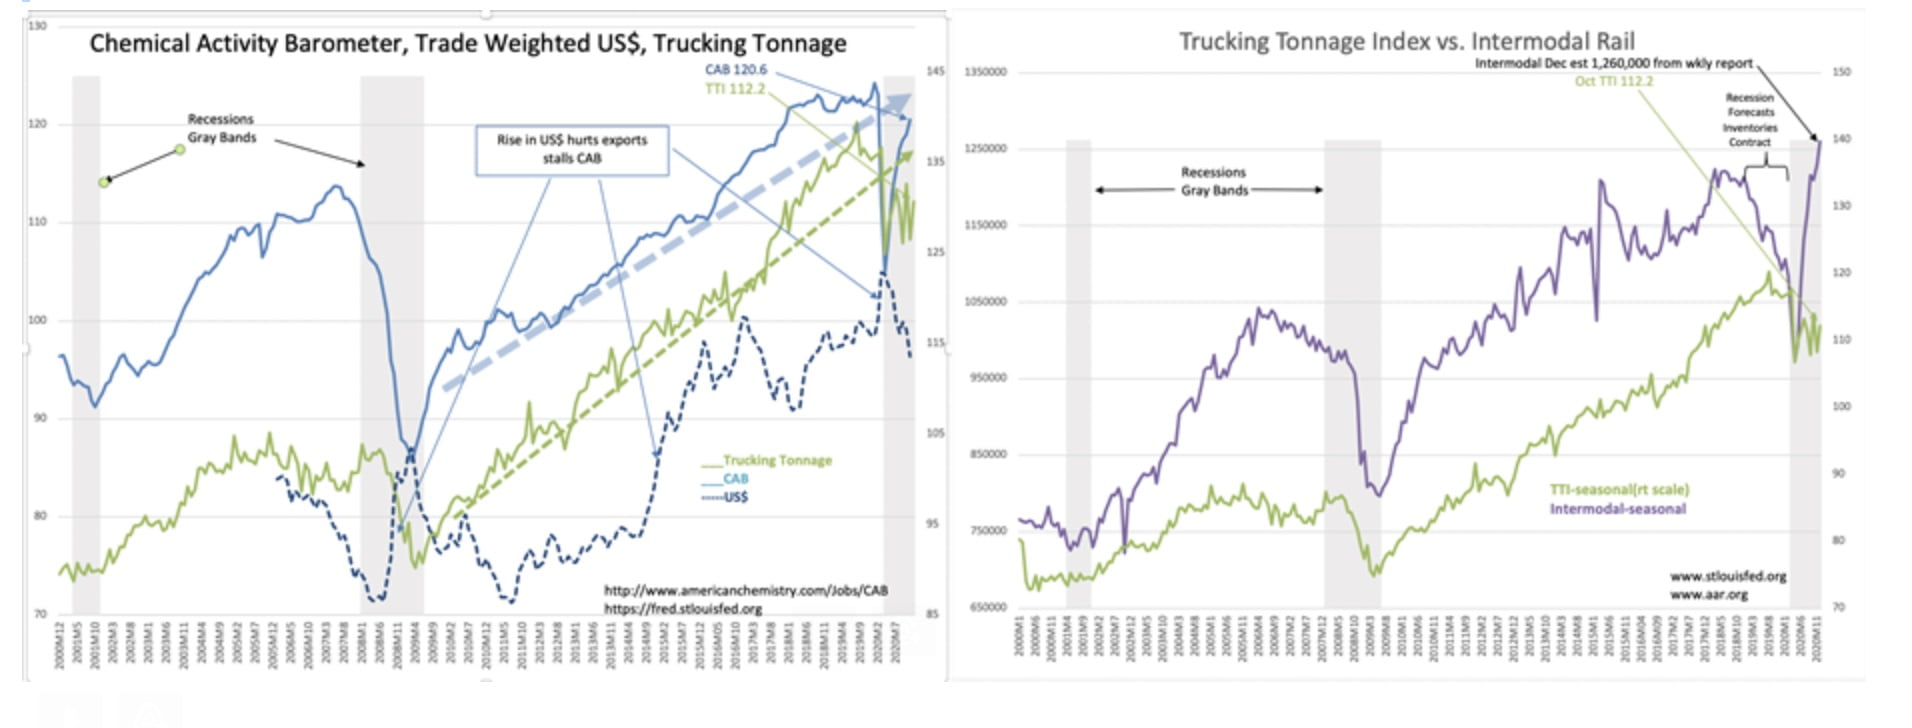
A good example is the interplay between the Chemical Activity Barometer (a measure of manufacturing activity) the Trucking Tonnage Index and the Intermodal Rail index (measures of goods transport and end demand) and the Trade Weighted US$ Broad Goods&Services Index(a measure sensitive to trade and capital inflows/outflows vs global environment). Little is simple. Why did Intermodal Rail plunge while Trucking Tonnage rise? They are usually well connected. Why did the flattening of the Chemical Activity Barometer not correlate with the other indices? We can make sense of it all only by examining investor thinking at the time.
Events relevant to today’s perspective:
- Beginning in 2014, the 10yr Treasury rate began to fall with the appointment of China’s President Xi.
- His consolidation of autocratic power drove considerable capital towards the US and other Western countries translating this influx of capital seeking safe haven into negative rate scenarios. The US$, a favorite safe haven, rose sharply. This rise continued through 2020. A strong US$ hurts exports and the Chemical Act. Barometer flattened, but had a period of recovery thru early 2018. Oil prices fell on traders’ fears of recession.
- Many using algorithms and historical trends took this to mean weakening economic activity when all other signals reflected economic strength.
- Early in 2018, many began to predict recession as rates fell. The Chemical Act. Barometer stalled with manufacturers not wanting to be caught with too much inventory. Retailers began to ship by truck with is more flexible in a recession so as to not have too much inventory. Intermodal Rail dropped off while Trucking Tonnage rose creating confusion. Rail is cheaper, but trucking can be turned on and off as needed.
- Many more called for recession in 2019 as rates inverted, a classic recession indicator since 1953. Markets plunged on a “1929” market-meltdown scare-but no recession even though heavily predicted occurred. Consumers and corporations at the time had the lowest debt delinquency rate in nearly 17yrs.
- Retail Sales, Personal Income and employment hit record numbers in Feb 2020 despite many calls for recession. Then, the COVID-19 lockdown began March 2020.
Learning Through Hindsight
The lesson to learn through hindsight is that even though widely believed market psychology did cause some changes in business behaviors as seen in the indicators, others more basic indicators, reflected continued economic strength. Today the Chemical Act. Barometer and Intermodal Rail are rising sharply reflecting a strong economic recovery as we exit the COVID-19 impact. Employment is recovering sharply with more required to return to pre-COVID levels. Retail Sales have held up with government financial support to those out of work. Many individual corporate reports, the core of the US economic activity, have positive surprises. The SP500 is at record levels, more reflecting abnormal strength of technology issues, the ‘stay-at-home’ issues than reflecting the earnings strength of core industrial production.
The current weakness of the Trucking Tonnage index vs strength of Intermodal Rail suggests we are in the middle of a return to what we see being normalized in Intermodal Rail patterns. The Trucking Tonnage Index should follow reflecting higher economic activity in the coming months in my opinion. The Retail Inventory/Sales Ratio remains at record lows indicating that many retailers need to restock. Trucking will be key. The US$ falling is positive for exports.
Anecdotal reports indicate the economic recovery continues stronger than many now expect. Trucking and logistics firms report strong levels of activity. Equity prices of the core industrial economy should trend higher while the ‘stay-at-home’ themed issues find less interest as people return to work.


