Today, the majority of Americans are worried a bear market is looming.
The good news: there are silver linings. Bear markets can present bargains for investors, thanks to inefficient pricing and fear in the market. Going further, many investing greats have made key investments during market downturns including:

Q2 2022 hedge fund letters, conferences and more
- Warren Buffett: Automotive sector during the 2008 Global Financial Crisis
- Shelby Davis: Financial sector during the 1997 Asian Financial Crisis
- Peter Bernstein: Gold during the 2000 Dot-Com Crash
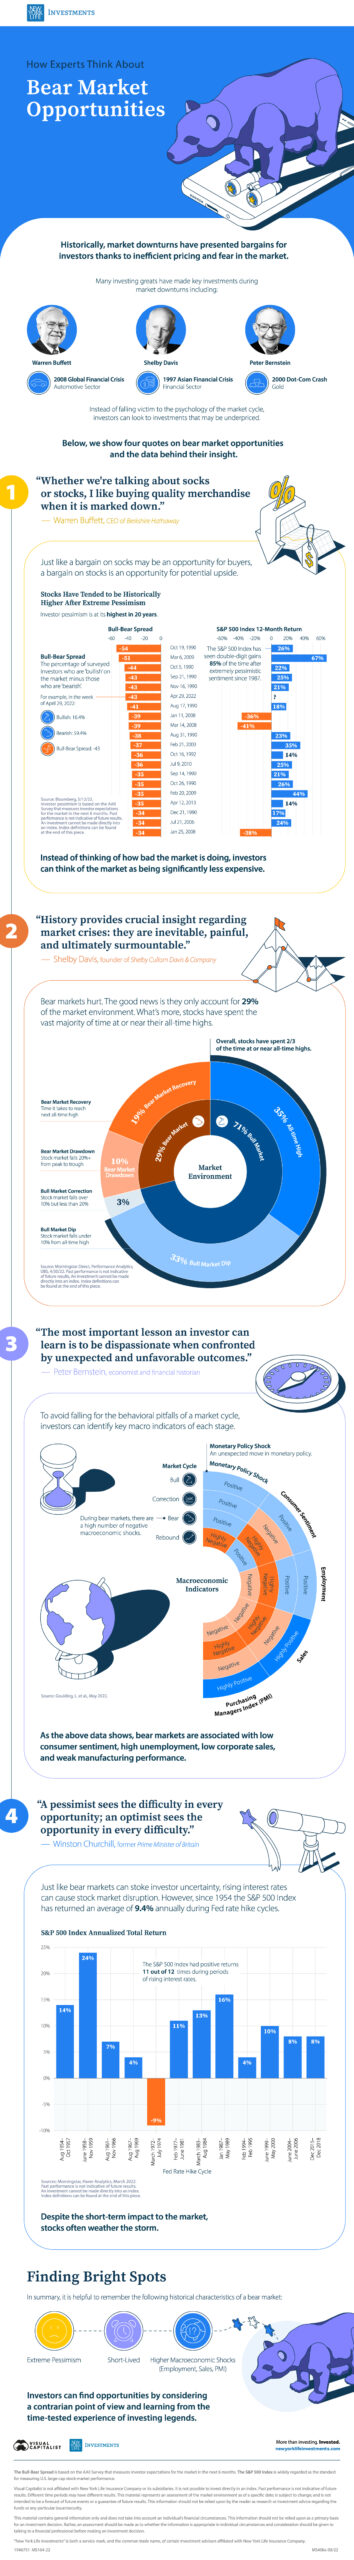
In this infographic from New York Life Investments, we show four quotes on bear market opportunities and the data behind their insight.
How Experts Think About Bear Market Opportunities
When faced with the challenges of a bear market, how do experts respond?
1. “Whether we’re talking about socks or stocks, I like buying quality merchandise when it is marked down.”
— Warren Buffett, CEO of Berkshire Hathaway
Just like a bargain on socks may be an opportunity for buyers, a bargain on stocks is an opportunity for potential upside. In fact, the S&P 500 Index has seen double-digit gains 85% of the time after extremely pessimistic sentiment since 1987.
Investor pessimism can be measured by a ‘bull-bear spread’. This is based on an AAII survey that measures investor expectations for the market in the next six months. It is calculated by taking the percentage of investors who are ‘bullish’ on the market minus those who are ‘bearish’.
For example, in the week of April 29, 2022:
- Bullish: 16.4%
- Bearish: 59.4%
- Bull-Bear Spread: – 43
Here’s how the S&P 500 Index performed after periods of extreme investor pessimism:
| Date | Bull-Bear Spread | S&P 500 Index 12-Month Return |
| 10/19/1990 | -54 | 26% |
| 3/6/2009 | -51 | 67% |
| 10/5/1990 | -44 | 22% |
| 9/21/1990 | -43 | 25% |
| 11/16/1990 | -43 | 21% |
| 4/29/2022 | -43 | ? |
| 8/17/1990 | -41 | 18% |
| 1/11/2008 | -39 | -36% |
| 3/14/2008 | -39 | -41% |
| 8/31/1990 | -38 | 23% |
Source: Bloomberg, 5/12/22
As the above chart shows, investor pessimism is at its highest in 20 years.
Instead of thinking of how bad the market is doing, investors may be better of thinking of the market as being significantly less expensive.
2. “History provides crucial insight regarding market crises: they are inevitable, painful, and ultimately surmountable.”
— Shelby Davis, founder of Shelby Cullom Davis & Company
Bear markets hurt. On the bright side, they only account for 29% of the market environment, with bull markets making up the lion’s share (71%). What’s more, stocks have spent the vast majority of time at or near their all-time highs.
| Market Environment | Description | % of Time in Market Environment |
| All-Time High | Stock market hits all-time high | 35% |
| Bull Market Dip | Stock market falls under 10% from all-time high | 33% |
| Bull Market Correction | Stock market falls over 10% but less than 20% from all-time high | 3% |
| Bear Market Drawdown | Stock market falls over 20% from peak to trough | 10% |
| Bear Market Recovery | Time it takes to reach next all-time high | 19% |
Source: Morningstar Direct, PerformanceAnalytics, UBS 4/30/2022. Based on monthly returns from 1945.
Overall, stocks have spent around two-thirds of the time at or near all-time highs.
3. “The most important lesson an investor can learn is to be dispassionate when confronted by unexpected and unfavorable outcomes.”
— Peter Bernstein, economist and financial historian
To avoid falling for the behavioral pitfalls of a market cycle, investors can identify key macro indicators of each stage. Below, we show the economic indicators and how they associate with each type of market cycle.
| Market Cycle | Monetary Policy Shock* | Consumer Sentiment | Employment | Sales | Purchasing Managers Index (PMI) |
| Bull | Positive | Positive | Positive | Highly Positive | Highly Positive |
| Correction | Positive | Negative | Positive | Negative | Negative |
| Bear | Positive | Highly Negative |
Highly Negative | Highly Negative | Highly Negative |
| Rebound | Highly Negative |
Positive | Negative | Negative | Negative |
Source: Goulding, L. et al., May 2022. *Represents an unexpected move in monetary policy.
As the above table shows, bear markets are associated with low consumer sentiment, high unemployment, low corporate sales, and weak manufacturing performance—with a high number of macroeconomic shocks.
4. “A pessimist sees the difficulty in every opportunity; an optimist sees the opportunity in every difficulty.”
— Winston Churchill, former Prime Minister of Britain
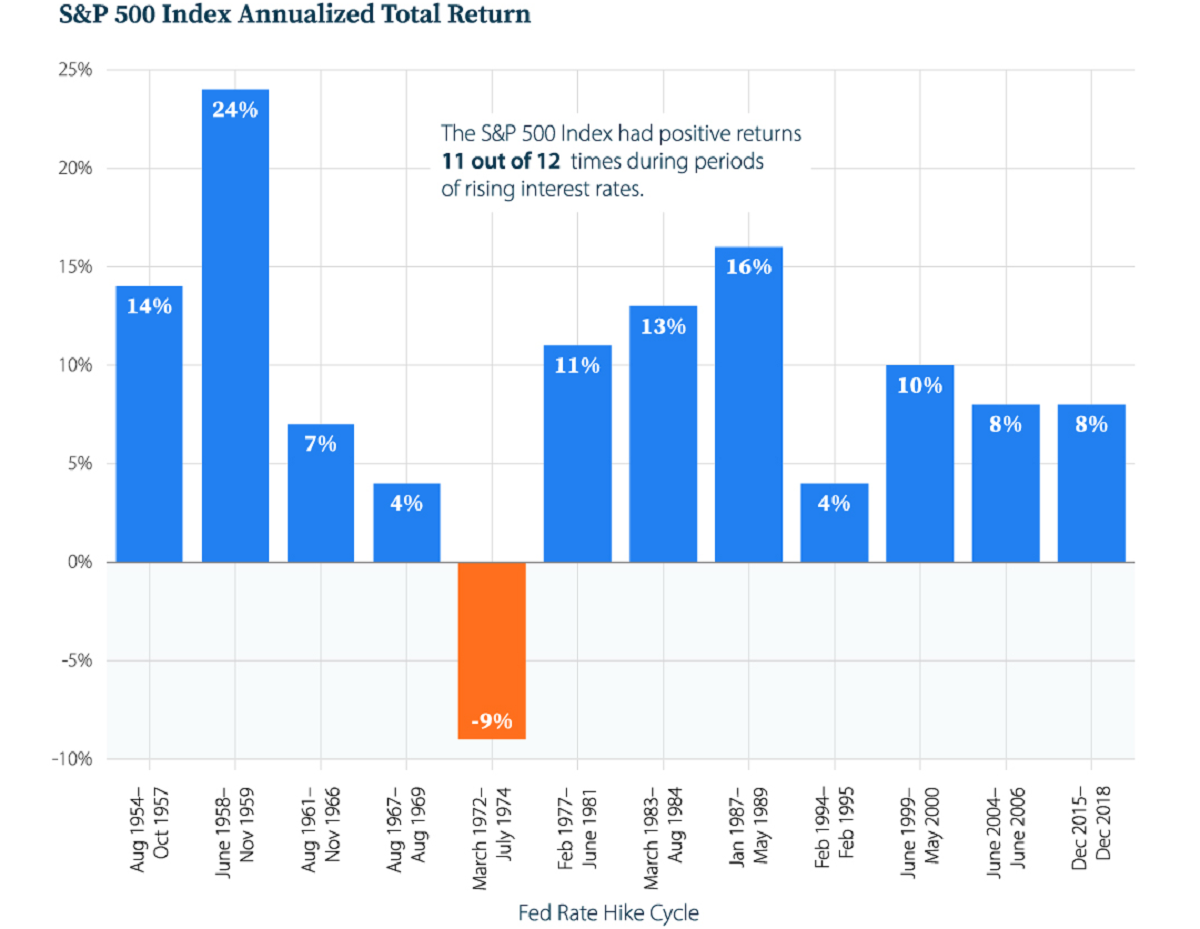
Just like bear markets can stoke investor uncertainty, rising interest rates can cause stock market disruption. However, since 1954 the S&P 500 Index has returned an average 9.4% annually during Fed rate hike cycles.
| Fed Rate Hike Cycle | S&P 500 Index Annualized Total Return |
| Aug 1954 - Oct 1957 | 14% |
| Jun 1958 - Nov 1959 | 24% |
| Aug 1961 - Nov 1966 | 7% |
| Aug 1967 - Aug 1969 | 4% |
| Mar 1972 - Jul 1974 | -9% |
| Feb 1977 - Jun 1981 | 11% |
| Mar 1983 - Aug 1984 | 13% |
| Jan 1987 - May 1989 | 16% |
| Feb 1994 - Feb 1995 | 4% |
| Jun 1999 - May 2000 | 10% |
| Jun 2004 - Jun 2006 | 8% |
| Dec 2015 - Dec 2018 | 8% |
Source: Morningstar, Haver Analytics, March 2022
Not only that, the S&P 500 Index has had positive returns 11 out of 12 times during periods of rising interest rates. Despite the short-term impact to the market, stocks often weather the storm.
Finding Bright Spots
In summary, it is helpful to remember the following historical characteristics of a bear market:
- Extreme pessimism
- Short-lived
- Higher macroeconomic shocks (employment, sales, PMI)
Investors can find opportunities by considering a contrarian point of view and learning from the time-tested experience of investing legends.
Article by Visual Capitalist


