CoreLogic has published a blog post further discussing the trends observed in this morning’s S&P CoreLogic Case-Shiller announcement.
New Data from the S&P CoreLogic Case-Shiller Index Reveals Reasons Behind Slowing Growth
By: Ralph McLaughlin
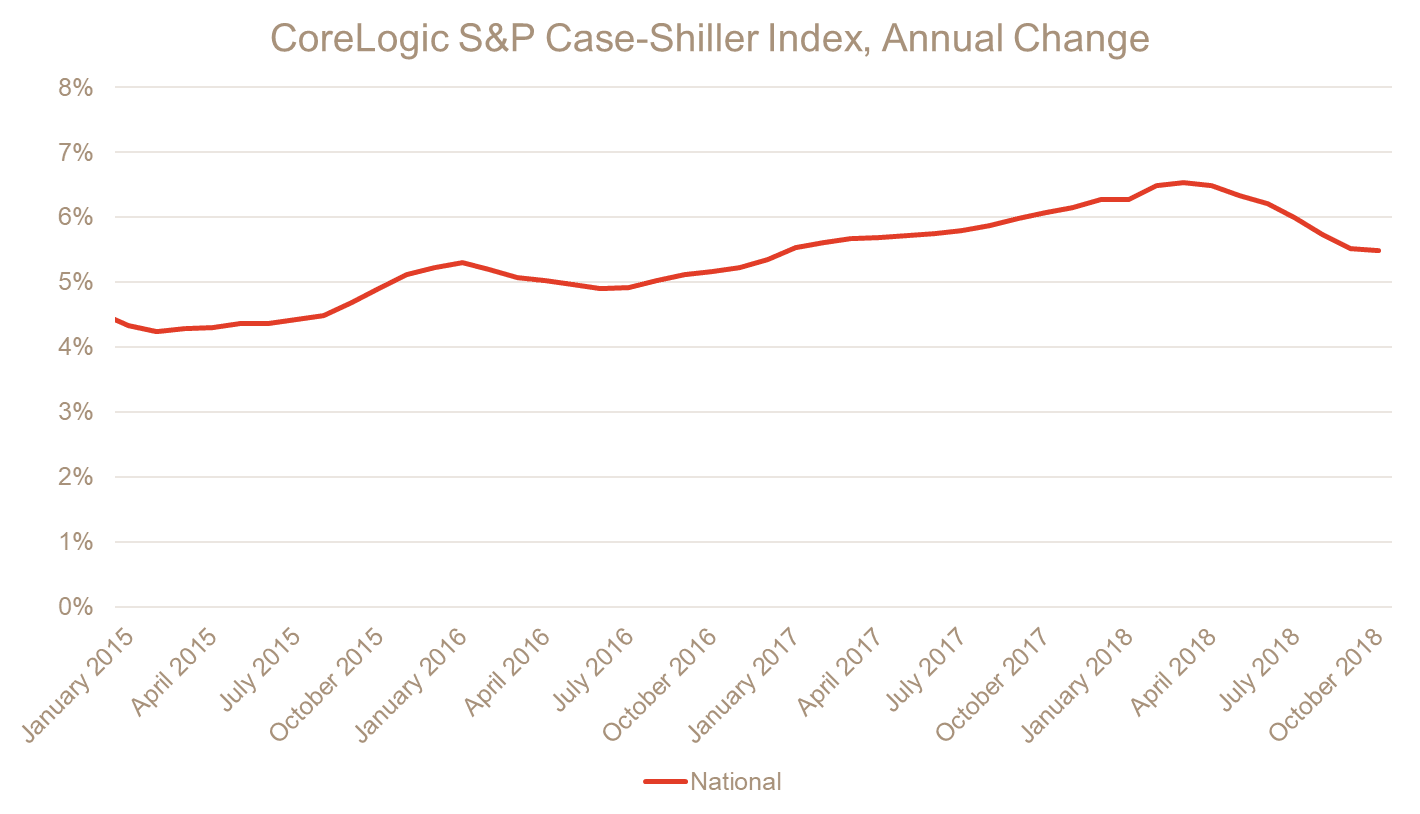
According to the latest S&P CoreLogic Case-Shiller National Home Price Index, home prices in the United States grew by 5.5 percent this October. This is the seventh consecutive month of slowing home-price growth, which is now at its lowest level since January 2017.
[REITs]Q3 hedge fund letters, conference, scoops etc
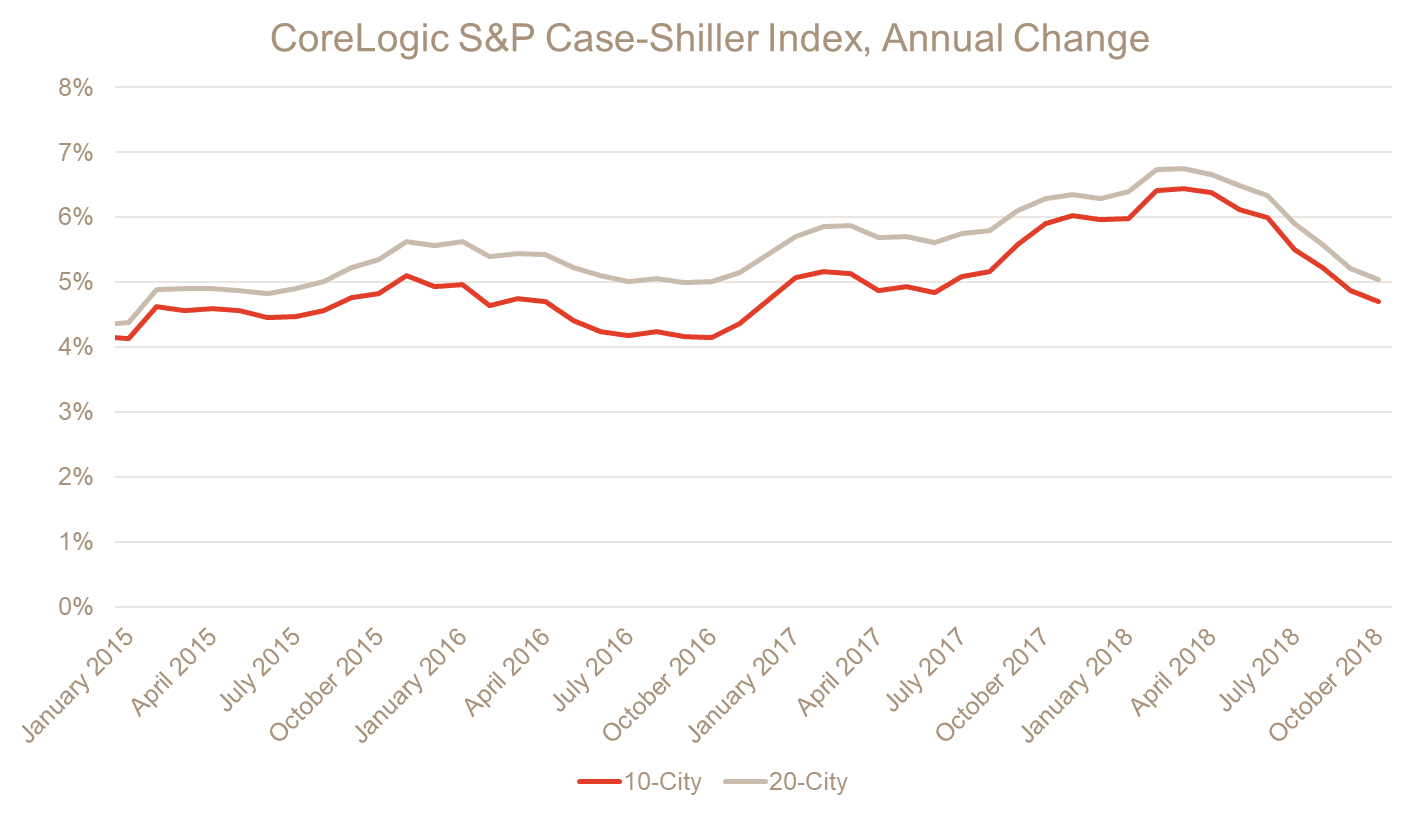
Average home prices for the top 10 metropolitan areas increased 4.7 percent, down from the previous month’s 4.9 percent increase. The top 20 metropolitan areas also posted a gain of 5 percent year over year, down from 5.2 percent in September. Furthermore, ten of the 20 metropolitan areas reported slower price increases month over month this October.
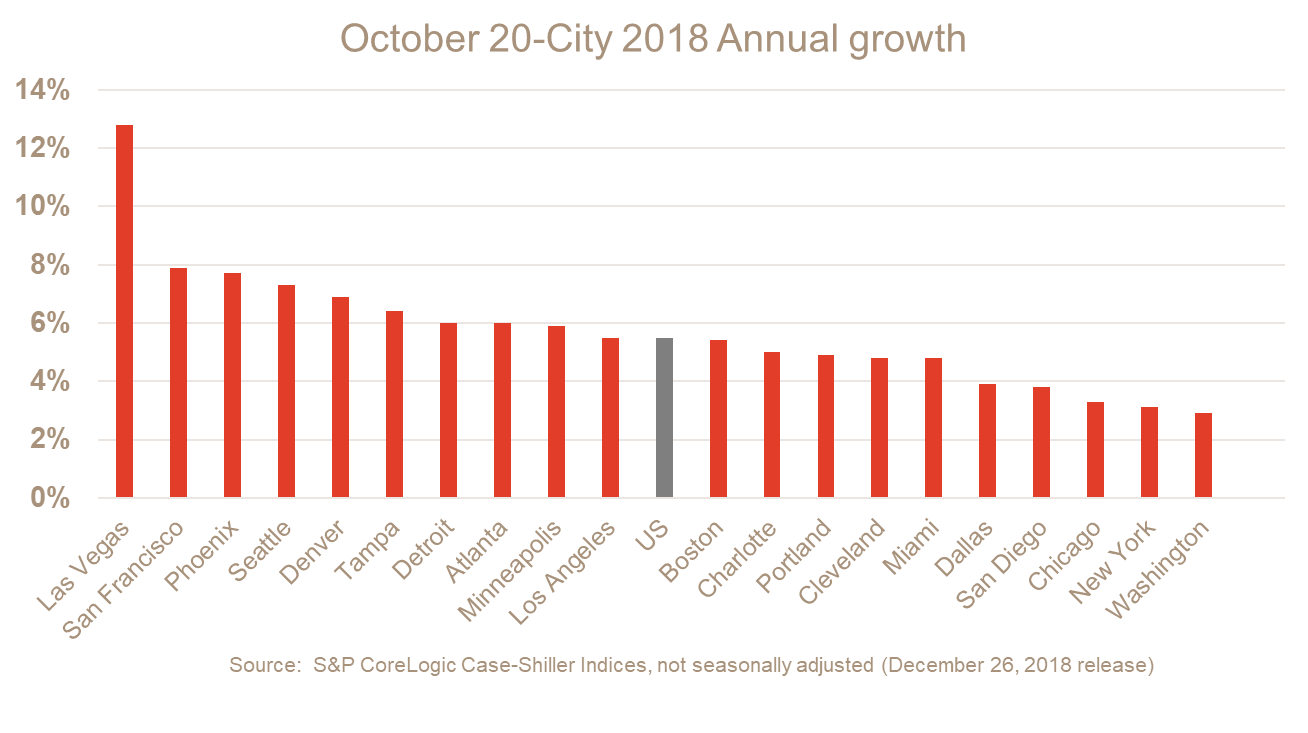
Home prices have continued to rise particularly fast in the West of the country, with Las Vegas (12.8 percent), San Francisco (7.9 percent) and Phoenix (7.7 percent) accounting for the highest year-over-year price increases.
October marked another month of slowing home-price appreciation, but recent signs point to a gentle softening of the housing market, rather than a crash landing. For example, existing home sales increased for the second consecutive month, new building permits ticked up to a seven-month high and mortgage rates are now at three-month lows. While the market is undoubtedly cooling, we believe it is a healthy respite for would-be homebuyers who have been stymied by increasing prices, falling inventory and rising mortgage rates over the past several years.


