To Anonymous Analytics, GT Gold Corp (CVE:GTT) is a no-brainer.

Q3 2020 hedge fund letters, conferences and more
The Quick And Dirty
- We believe that GT Gold is a C$1 billion to C$2 billion NPV asset that can be built for initial capital spend of C$700 million. Its durable economics work even at C$1,300 gold and C$3.00 copper prices.
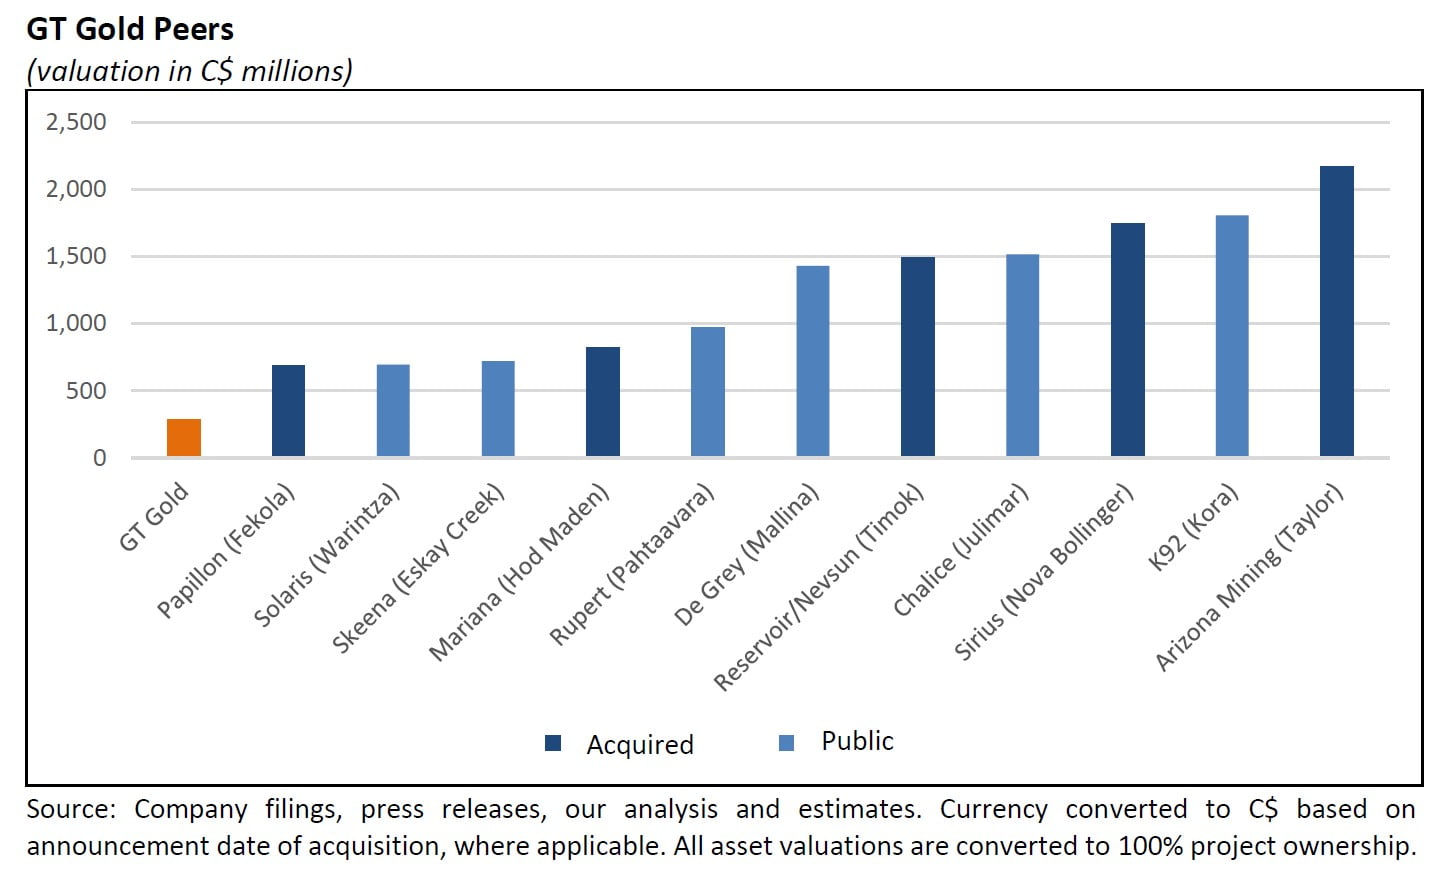
- GTT has a market cap of only C$290 million, when its peers who can claim similar economics either trade or have been acquired for between C$700 million and C$2.1 billion.
- GTT is trading as a depressed outlier when there is nothing to suggest it should.
Introduction
GT Gold Corp. (“GTT”) is a Canadian gold exploration company with a market cap of C$290 million, trading on the TSX Venture exchange under the symbol GTT.V. This is our third report on the Company, following our 25 June 2020 initiation report and our 14 July 2020 mineral resource estimate update. Since our initial report, the stock is up 28%.
Cool – just another 150% to go.
Ahead of the PEA, which is expected to be released this quarter, we dig into GT Gold’s valuation and show where it stacks up against peers. GTT’s rare mix of a stable jurisdiction, a project NPV we estimate at well over C$1 billion, expected initial CapEx costs of ~C$700 million with a short payback period, straight-forward resource and metallurgy, and Newmont’s 14.9% strategic stake, put it in a rare category of assets.
The problem is, new assets like this rarely get discovered or come to market, and when they do, it’s with a valuation to match. Investors seldom get the chance to purchase them at deeply discounted prices once they’ve taken shape. GTT checks all the right boxes, but is trading for a market cap of only C$290 million when its peers who can claim similar either trade or have been acquired for between C$700 million and C$2.1 billion.
To be clear, this is not a marginal asset that works because gold is at US$1,950 and copper is at US$3.60 – this is an asset with an NPV of C$1 billion even at US$1,300 gold and US$3.00 copper, as we show next.
To us, this is a no-brainer:
GT Gold Corp: NPV Analysis
GT Gold has two main assets, namely its Saddle North deposit and its Saddle South deposit:

Saddle North:
As established in our initial report, we envision the Saddle North deposit consisting of a starter pit, and a much larger underground mine.1
The Starter Pit:
This analysis considers a relatively modest 55Mt open pit at grades of 0.3g/t Au and 0.3% Cu and a low strip ratio of ~2:1. While a multi-hundred million tonne super-pit is also a possibility, we are skeptical any developer would pursue a super-pit option here given how it would cannibalize and defer the more valuable underground.
The Underground Mine:
The crown jewel. We expect +300Mt of economic rock will drive the bulk of the project’s economics. It possesses cohesive and distinct zones of grade that should allow the underground to be optimized to favor higher grades early on. This analysis assumes 220Mt of rock in the mine plan inclusive of internal and external dilution, at grades of 0.68g/t Au and 0.4% Cu. We believe a block cave will be the most likely method to extract rock at scale.
Saddle South Open Pit:
A completely forgotten and overlooked asset. Saddle South is unlikely to be able to sustain a stand-alone operation. However, in the context of a satellite pit to Saddle North it likely retains a large amount of value. This analysis assumes 14Mt of ore at Saddle South at an average grade of ~1.2g/t Au (~540K oz of gold) that fits with a pit at a strip ratio of ~2:1.2 We believe that Saddle South likely boasts the best starter-pit material. Although the Saddle South asset won’t be part of the upcoming PEA, the Company expects to release a mineral resource estimate for the deposit by year-end.3
We envision the Saddle South and Saddle North open pits will run concurrently to pay back the initial CapEx and finance the Saddle North underground development.
For our purposes, we don’t think a DCF model is necessary to value GT Gold. For a long-life asset with a short payback period, we can just take the first 25 years of production, because anything beyond that doesn’t really add much to the NPV. We then calculate the total revenue and total costs and taxes to arrive at the total net cash flow of the project.
Furthermore, while a DCF model takes the total net cash flows of a project and discounts them down, we can closely approximate that with a rule of thumb. For example, if the deposit can be sequenced to mine better grades earlier in the mine plan, a 7% discount rate will probably erode around 50% to 65% of the net cash flow. If the mine profile is likely to be flat, it will probably erode around 65% to 75% of the net cash flow. In this case, we think a 60% reduction works fine as a substitute to a full-fledged DCF model.
And finally, we assume GT Gold will mine and process 11Mtpa over its life-of-mine as outlined in our previous report.4 Over the first 25 years, that’s 275Mt of rock.
Below is our NPV calculation for GTT based on spot gold and copper prices of US$1,950 gold and US$3.60, followed by our durability scenario NPV calculation based on US$1,300 gold and US$3.00 copper:
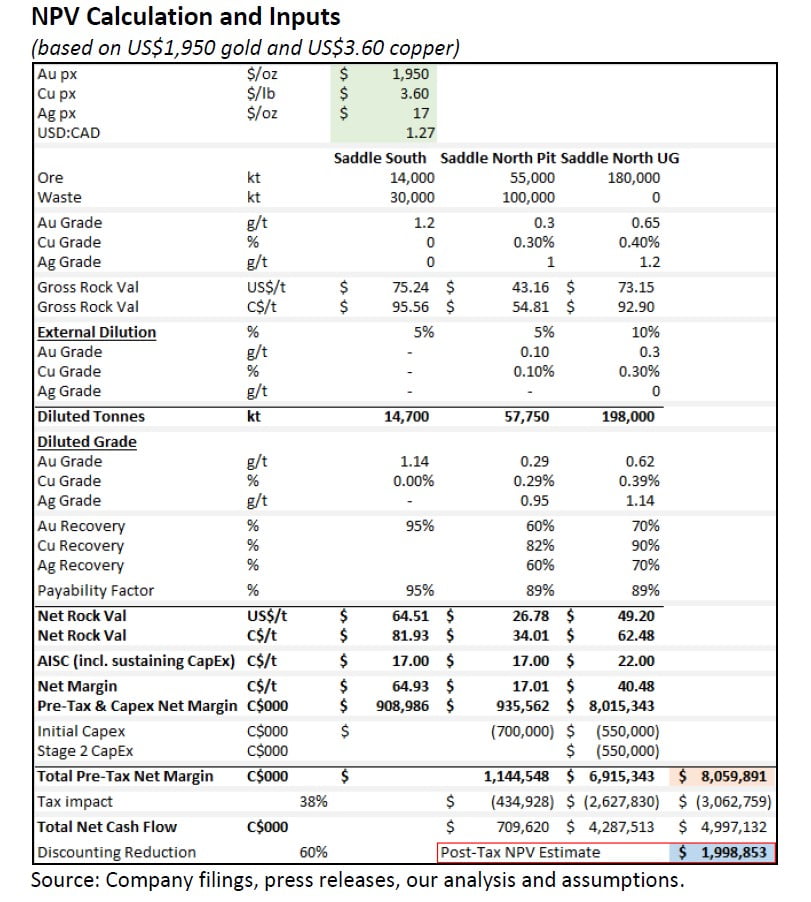

So, what does this all mean? In short, we expect GT Gold’s Saddle North and Saddle South to yield a combined C$1 billion to C$2 billion in post-tax project NPV on initial CapEx of approximately C$700 million. Furthermore, we believe that GTT’s Saddle projects are economically robust even at US$1,300 gold and US$3.00 copper prices.
In other words, this looks like a mine.
Read the full article here by Anonymous Analytics


