Tire and automobile service provider Goodyear Tire and Rubber Company (NASDAQ:GT) shares have fallen back towards pandemic levels driven by the benchmark indices sell-off. The country’s largest tire maker saw market share gains and top line growth from its merger with Cooper Tire and Rubber. However, inflationary pressures and supply chain challenges had a material impact on earnings. To offset the 31% rise in raw materials, the Company implemented price hikes, substituted materials, added new suppliers, and optimized distribution costs. Cost pressures are expected to persist over the next few quarters. The semiconductor shortage is still impacting its OE demand as it remains below pre-pandemic levels. The Company does see the supply of semiconductors improving despite auto production remaining “well below” consumer demands which will lead to more market share gains despite the uncertainty in OE volume. Electric vehicle (EV) tires are driving exceptional demand in the consumer segment. Prudent investors seeking a buy the dip opportunity in the country’s largest tire producer ahead of a reprieve in supply chain and chip shortage challenges, can watch for opportunistic pullbacks in shares of Good Year Tire.
Q4 2021 hedge fund letters, conferences and more
Q4 Fiscal 2021 Earnings Release
On Feb. 11, 2022, Goodyear released its fiscal fourth-quarter 2021 results for the quarter ending December 2021. The Company reported an earnings-per-share (EPS) profits of $0.57 versus consensus analyst estimates for $0.43, a $0.14 beat. Revenues rose 38.2% year-over-year (YoY) to $5.05 billion beating analyst estimates for $4.96 billion. Merger-adjusted segment operating income rose 32% to $398 million YoY. Global market share continued to grow as revenue per tire rose 11% before currency impact. Full-year operating cash flow was $1.1 billion. Goodyear CEO Richard Kramer commented, "We achieved our highest fourth quarter revenue in nearly 10 years as demand for our products remained strong and we captured higher selling prices. With the addition of Cooper Tire, our merger-adjusted segment operating income was significantly above last year and over 60% higher than fourth quarter 2019. Looking ahead, we expect inflationary pressures to persist over the next several quarters. We remain focused on executing strategies to capture value in the marketplace and managing our costs”
Conference Call Takeaways
CEO Kramer noted the Company generated its fourth highest Q4 revenues in a decade thanks to higher selling prices in addition to the addition of Cooper Tire. He updated analysts on the updated strategy road map with Cooper Tire focusing on sustainability and mobility. The merger generated $398 million in operating income in the quarter and 60% higher than in 2019. The consumer business was strong with acceleration in its EV tire deliveries and OE fitment wins leading to a 0.5% organic consumer market share growth. The commercial segment gained a 1% market share in the quarter due to best-in-class portfolio of products and strong fleet service offerings. However, raw materials costs rose 31% or $300 million in the quarter due to inflation and supply chain disruptions. CEO Kramer expects cost pressures to persist for the next several quarters but has been able to offset the inflationary pressures through price increases, new suppliers, and optimization. The commercial business is being driven by the higher costs for diesel fuel and drivers as fleets look to leverage its premium tires to optimize operational costs by improving cost per mile metrics. The tire replacement market continues to recover in Latin America. Goodyear grew its consumer replacement volume by 22% in the EU, which was 8% ahead of the industry. OE business has been recovering, but still remains under pre-pandemic levels to too the chip shortage. He concluded, “ The supply of semiconductors is improving, but auto production remains well below consumer demand. While this dynamic creates uncertainty for our OE volume in the near term, our robust OE pipeline positions us for continued share gains regardless of the level of auto production this year.”
GT Price Trajectories
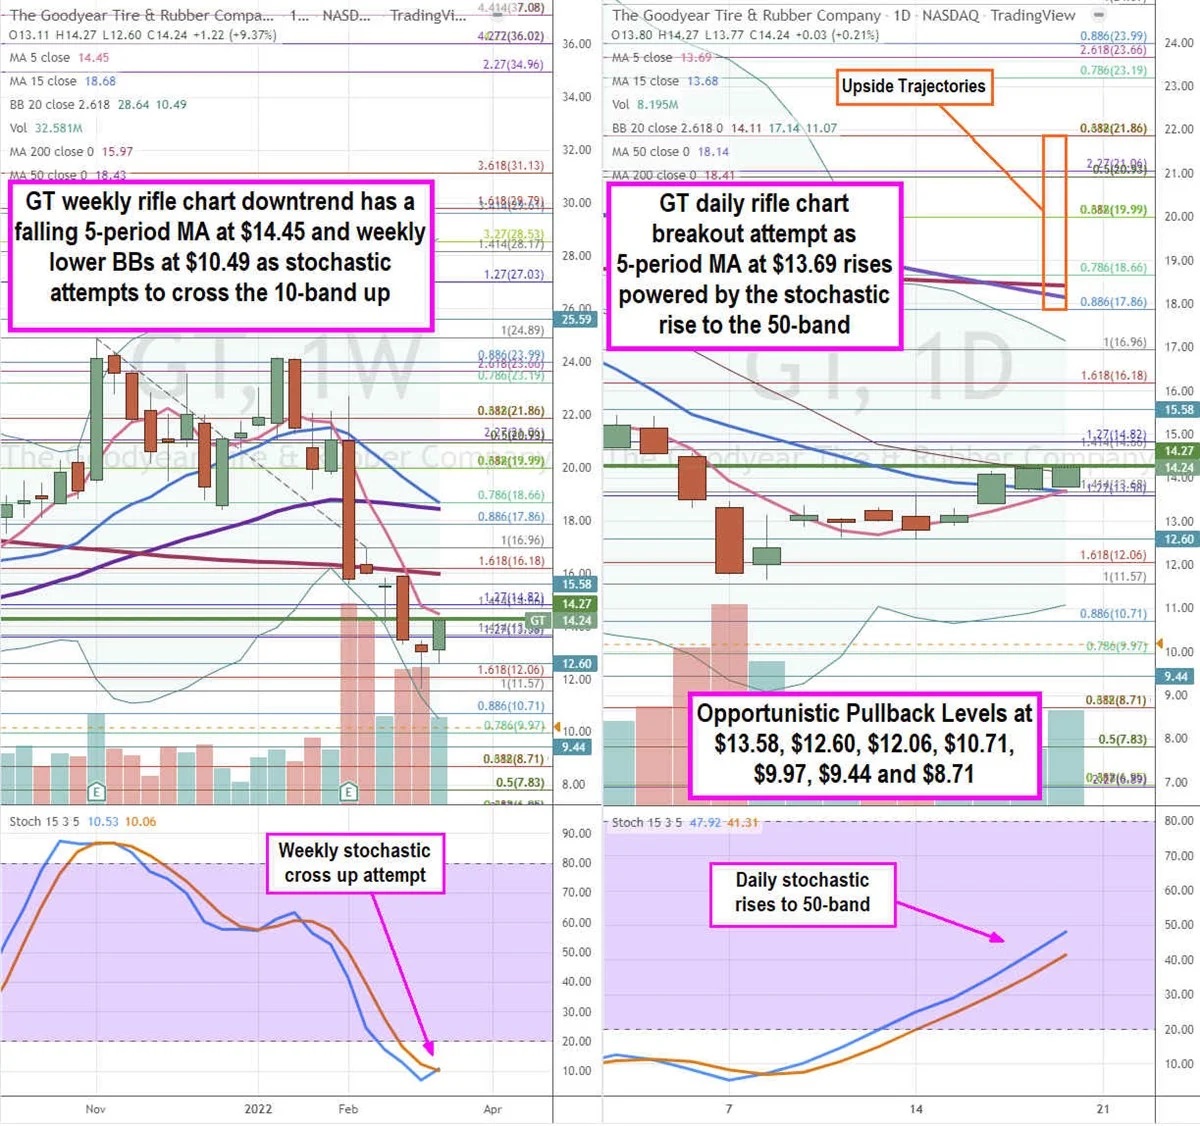
Using the rifle charts on the weekly and daily time frames provides a precision view of the landscape for GT stock. The weekly rifle chart formed a double top near the $23.99 Fibonacci (fib) level before selling off to the $12.06 fib before rebounding. The weekly rifle chart downtrend has a falling 5-period moving average (MA) at $14.45 which is just above the weekly market structure low (MSL) buy trigger at $14.24. The weekly 200-period MA sits at $15.97 and 50-period MA at $18.43 as the 15-period MA continues to fall at $18.68. The weekly stochastic is attempting to coil on the 10-band. The weekly lower Bollinger Bands (BBs) at $10.49. The daily rifle chart is attempting to breakout as the 5-period MA at $13.69 is rising through its 15-period MA at $13.68 driven by the daily stochastic rising to the 50-band. The daily upper BBs sit at $11.07 with daily 50-period MA at $18.14 and 200-period MA at $18.41. Prudent investors can watch for opportunistic pullback entry levels at the $13.58 fib, $12.60, $12.06 fib, $11.57 fib, $10.71 fib, $9.97 fib, $9.44, and the $8.71 fib level. Upside trajectories range from the $17.86 fib level up towards the $21.86 fib level.
Article by Jea Yu, MarketBeat


