Global Quality Edge Fund letter to investors for the third quarter ended September 30, 2019.
Q3 2019 hedge fund letters, conferences and more
Dear shareholder,
The total return of Global Quality Edge Fund during the 3rd quarter of this year was -2,16% and -7,05%, when measured from inception (01/06/2017).
In the last quarter, we’ve seen how the economy continues to slow in Europe and the U.S. (see Chart 1). All the central banks, without exception, are triggering expansive monetary policies to confront it. The European Central Bank (ECB), for instance, announced new Quantitative Easing (QE) measures in September, cutting back on deposit facilities to -0.5% and purchasing bonds worth up to € 20 million a month. If the economy does not change trend, we believe it is highly likely that we will see a Japanese-style QE on shares in Europe. The Fed, in the U.S., may also be forced to implement similar measures; less likely for the equity market. There is no doubt we are bearing witness to exceedingly high debt levels globally and the latest efforts from major central banks are not enough to buck the trend. We will therefore, continue with our tail-risk hedging strategy until 1) the leading U.S. Conference Board indicators begin to show signs of improving, switching the business cycle from a slowdown to a recovery phase or 2) the economy dips into recession.
Current Portfolio
The top 10 holdings make up 43% of the total capital while the top 20 represent more than 70%. By geography, revenue concentration of our holdings is 32.15% in Europe, 31.92% globally, 25.5% is concentrated in the U.S and Canada, whilst Emerging Markets take up 10.43%. When looking at the competitive advantages; 30.65% set themselves apart due to high switching costs, 26.55% have intangibles, 21.68% owe it to size of the market and 21.12% have a network effect. By size, more than 60% of our holdings are micro or small cap stocks and on average there are 13 broker analysts covering our fund’s holdings. The 1-year beta is 0.8 and the 3 year is 0.75. In terms of valuation, the fund has a 14x last twelve-month P/E cash aggregated multiple with a growth potential of more than 40% in the next 3 years. The internal rate of return (IRR) is above 11% for the same time horizon.
The average percentage ownership of the fund is 47%, the insider average ownership is above 20% and more than 60% of our holdings have an active share repurchasing scheme close to 10% of its market cap. Lastly and more importantly, more than 70% of the companies in the fund have recurring revenues and are therefore less sensitive to the changes in the business cycle. The return on invested capital (ROIC) in the last twelve months is 14.5% and the average percentage of profits set aside to pay dividends is 31%. The most significant price moves for quarter were:
- Positives: IEH Corporation +17,65%, Universal Health Services 14,24%, Alphabet+12,78%, Anheuser-Busch InBev SA/NV +12,31% y Inditex +7,37%.
- Negatives: Micro Systemation AB (publ) 17,97%, Ituran Location and Control Ltd. – 16,86%, All for One Group -12,26% y Envea Société Anonyme -11,29%.
In the last quarterly shareholder letter, we went through and reviewed all our holdings in the fund. This time round, we would like to focus on our newly added investment: Sylogyst (SYV) — a good example of our approach to investing.
Detailed Case Study Of Our Investment Philosophy – Sylogist Ltd.
Sylogist Ltd. (SYV) is a supplier of enterprise resource planning solutions (ERP) for the public sector in the U.S. and Canada. The company has more than 1,000 clients through local governments, non-for-profit organizations, Education and Defence. It trades in the TSX Venture Exchange in Canada and was first listed in 1988 with a market cap of $8 million — at a time when it only resold software in Western Canada for oil and gas clients.
At the start of 2000, Sylogist focused their organic and inorganic growth strategies on ERP solutions for a niche market segment: the public sector. The high specifications on accounting, budgeting, payroll and reporting were not something that could be covered with the standard products available at the time (QuickBooks, Sage, etc.). The largest companies of the sector (Oracle, SAP, Infor, Sage) all favoured going after private sector clients with larger budgets for personalised solutions at higher price.
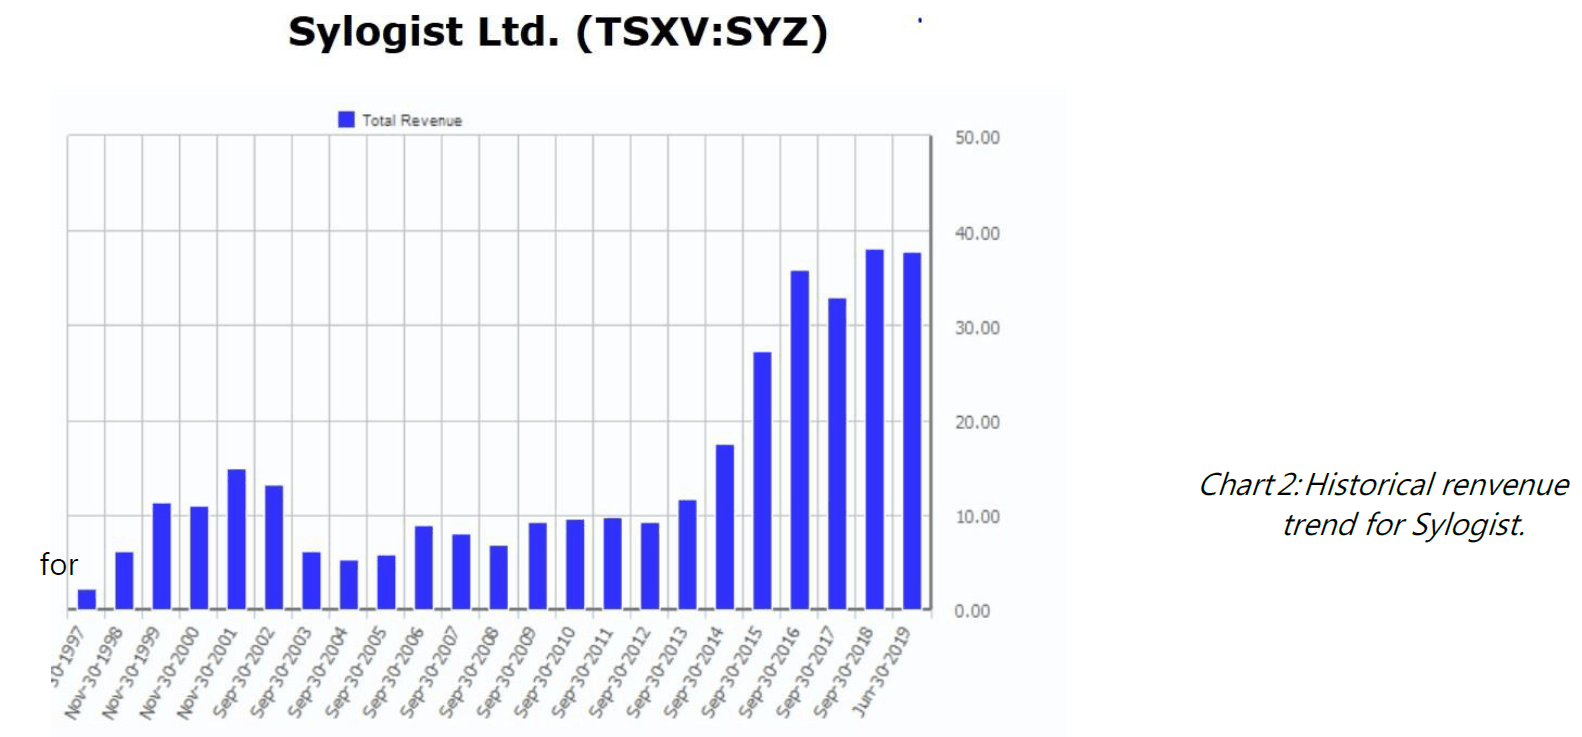
Chart 2 shows how SYV’s new market focus reflected on their performance from 2003 onward and how revenue grew at a compound annual growth rate (CAGR) of 9% in the last 15 years. Although SYV does not publicly state which part of its growth is owed to inorganic growth, we do know that; as of 2006 to 2018, M&A deals accounted for $23 million. In other words, 40% of business growth was organic over a total sales figure of $38.2 million in 2018. The average price paid for acquisitions since 2006 was $5 million or an average multiple of 1x Sales.
Sylogist is set up through 2 affiliates: Sylogist USA Inc. and Serenic Software; although both operate under the Serenic Software branding. Serenic Software operates under Microsoft licensing and has positioned itself as the number one payroll and H.R. solutions provider within Microsoft Dynamics.
Why do we like Sylogist?
From 2010, SYV is transitioning from a license to a subscription-based business model. At first sight and in the eyes of the average investor, this shift would imply a shortfall in the P&L and cash flow, as revenue recognition transitions from realising annual license fees to only recognising them once services have been rendered under subscription accounting practices.
In Table 1, we can see how Licenses have dropped almost 26% year-on-year. The company explains the decrease in their 2018 annual filing (Q3 2018):
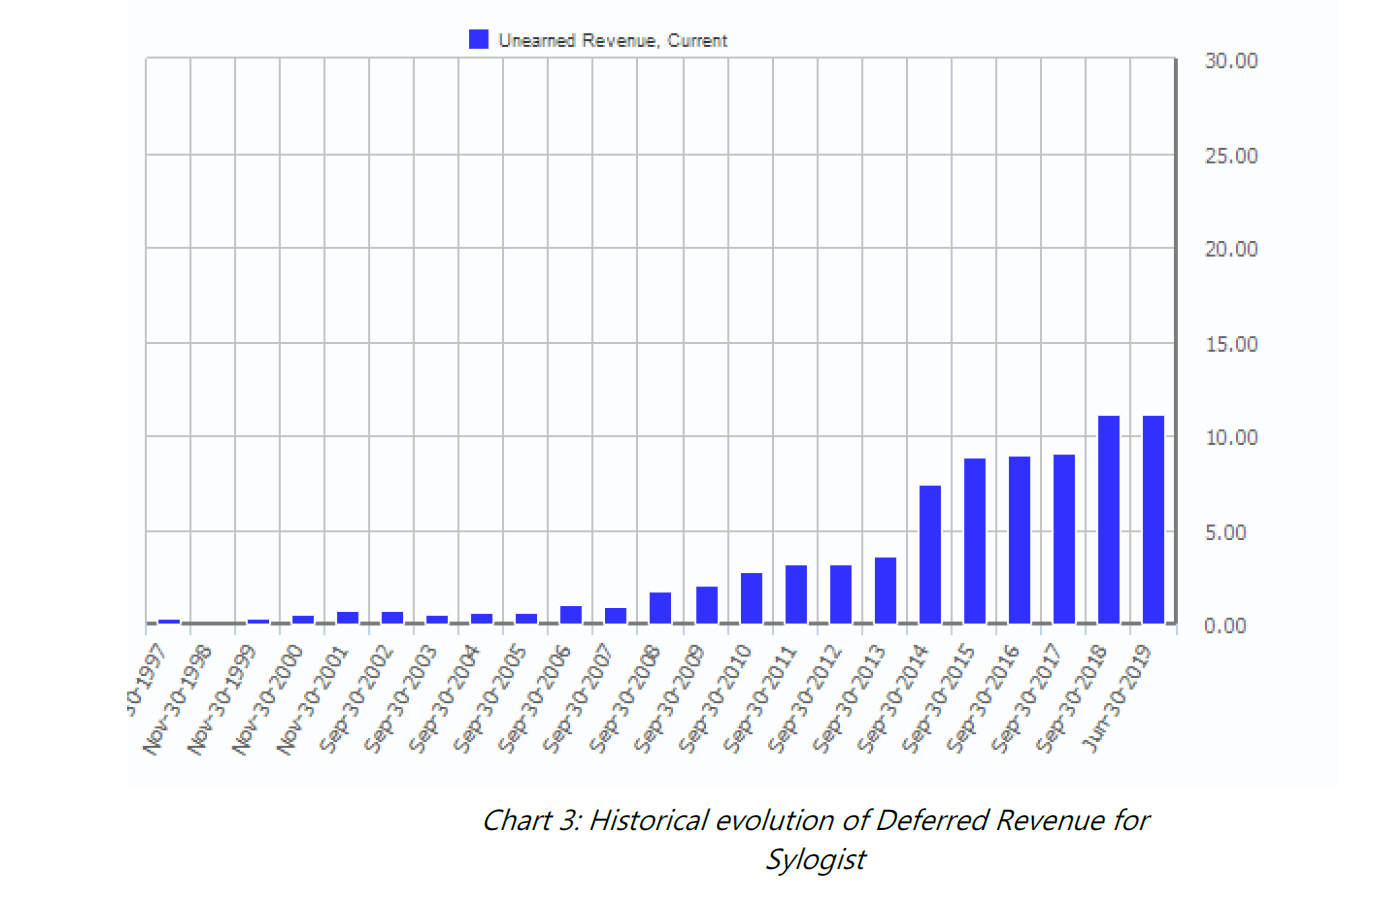
If we analyse the last few years of Revenue, we will understand the drop in its licensing business against its increase in subscription and maintenance fees. Up until 2019, Subscription and Maintenance already accounted for 70% of revenue with growth rates of 7%. This allowed us to assume they have almost completely transitioned their business model. Another way to understand the change in accounting is by looking at their Unearned or Deferred Revenue growth under the Balance Sheet’s Liabilities.
Chart 3 shows how Deferred Revenue has grown at a compound annual growth rate above 15% in the last 10 years. The remaining 30% of business is comprised of Licensing, Consulting (25% of revenue) and Product Selling to third parties (3%). The increase in SaaS (Software as a Service) should increase the EBITDA margin and ROIC above 50 and 80%.
Do they have a competitive advantage?
Perhaps their most significant advantage is their relationship management and high client retention, due to lofty switching costs their clients would face if they were to change provider. Sylogist works with more than 1,000 clients — most U.S. based — with a low concentration risk. The retention rate (RR) is higher than 90% and the average relationship with each client is more than 10 years old. Contracts renew annually with a low churn rate. As result of this, the sale cycle is a long one, creating a significant barrier of entry for competitors. If we look at their geographic exposure and by sector, more than 70% of business originates in the U.S. public sector including local government authorities, mayor’s offices, non-for-profit organisations and some manufacturing businesses.
The nucleus of their ERP business is based on System Dynamics NAV from Microsoft. This is Microsoft’s central ERP for small and medium sized firms with more than 40,000 deployments in North America and 120,000, globally. Firstly, the relationship with Microsoft provides critical validation and brand recognition in the market and secondly, Microsoft continues to heavily invest in features and functionality within its System Dynamics NAV. We can also conclude that the Microsoft partnership also stands out as a competitive advantage that is renewed every 3 years.
Who manages the company?
Mr James D. Wilson has been Sylogist’s CEO and president from May 2008. He began his career as a Sales Engineer and worked in large well-known IT companies, including Burroughs Corporation and Gould CSD. It wasn’t until July 2001 when he began working as a Director for SYV. The ownership percentage held by employees is 9.93%, of which Wilson has 1.1%. SYV’s board is made up of 5 directors, 3 of which are independent from the firm.
Are there any accounting red flags?
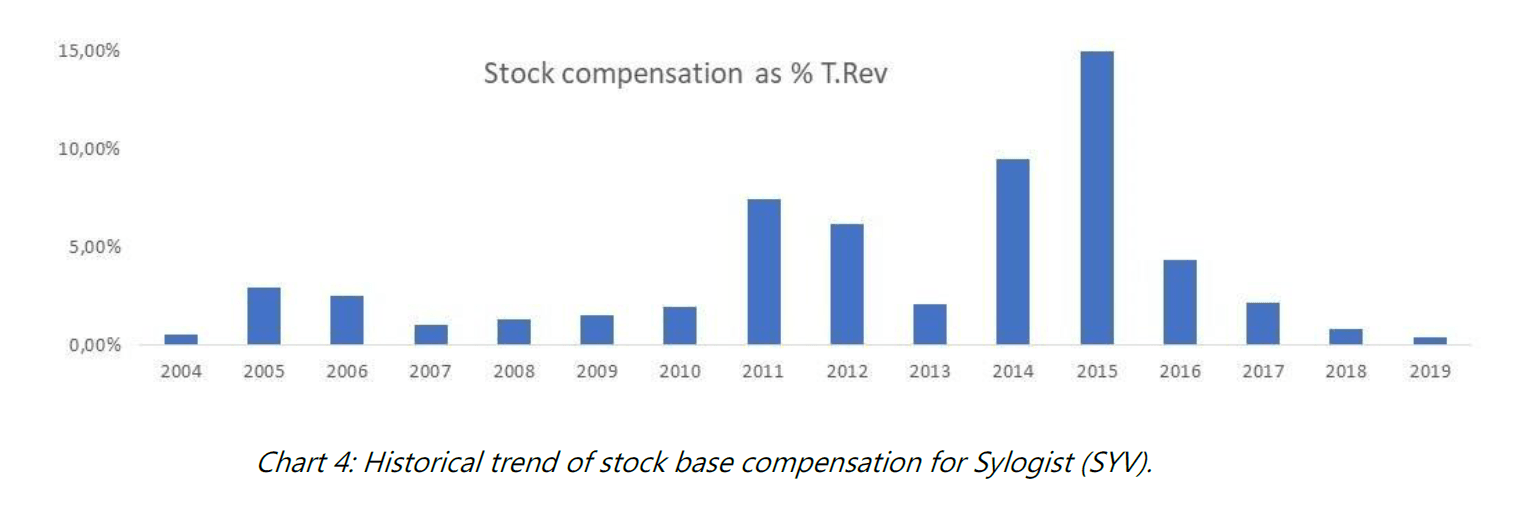
As you may well know, Global Quality Edge fund pays a lot of attention to the existence of accounting red flags or warning signals that may put profits and cash flow at risk. If you would like to learn more about our red flags framework, I would recommend reading our Shareholder letter from 2Q18. Going back to SYV, their business model is one that can be quite easily understood. It is a traditional subscription based business, without debt on or off its balance sheet and where the most relevant accounting items are Cash Flow and Deferred Income. If we dive into the numbers in greater detail, we realise there is a line item worth reviewing: Stock compensation through stock options. On average and in the last 10 years, stock compensation has represented 4% of sales with peaks as high as 15% in 2015.
The current compensation for executives and directors at Sylogist is made up of 3 elements: 1) Base salary 2) Incentive or cash-flow based annual bonus and 3) a stock option plan, renewable every year with a stock dilution of new shares of 10%. Aside from this, SYV has undergone an outreach to investors and investment funds to improve its variable compensation policy to its employees. The latest events suggest senior executives can use their annual incentive plan to buy SYV shares too; however, the details behind this new scheme will not be revealed until the next shareholder meeting in May 2020.
Further along this letter, we will go into SYV’s valuation and the implication of the estimated expense that stock compensation will have.
- Stock based compensation.
US GAAP and IFRS outline how companies who adopt stock-based compensation have to treat it as an operating expense, subtracting it from the P&L. To put it in simple terms, you can generally class this line item into 3 types: 1) stock options 2) Restricted shares and 3) Stock appreciation rights (SARs). Each scheme has its own particularities, but the main difference lies with the stock options that can only be exercised when in-the-money.
The option holder can sell it above its current price); restricted stock, on the other hand, will have an exercise price of 0. When looking at SARs, there is a lesser chance of there being stock dilution, given the fewer number of shares that are issued or none, if the payment is made in cash. This is a relevant point to highlight as understanding the variable compensation scheme through stock options will put into perspective the future dilution effect that could make shares less valuable.
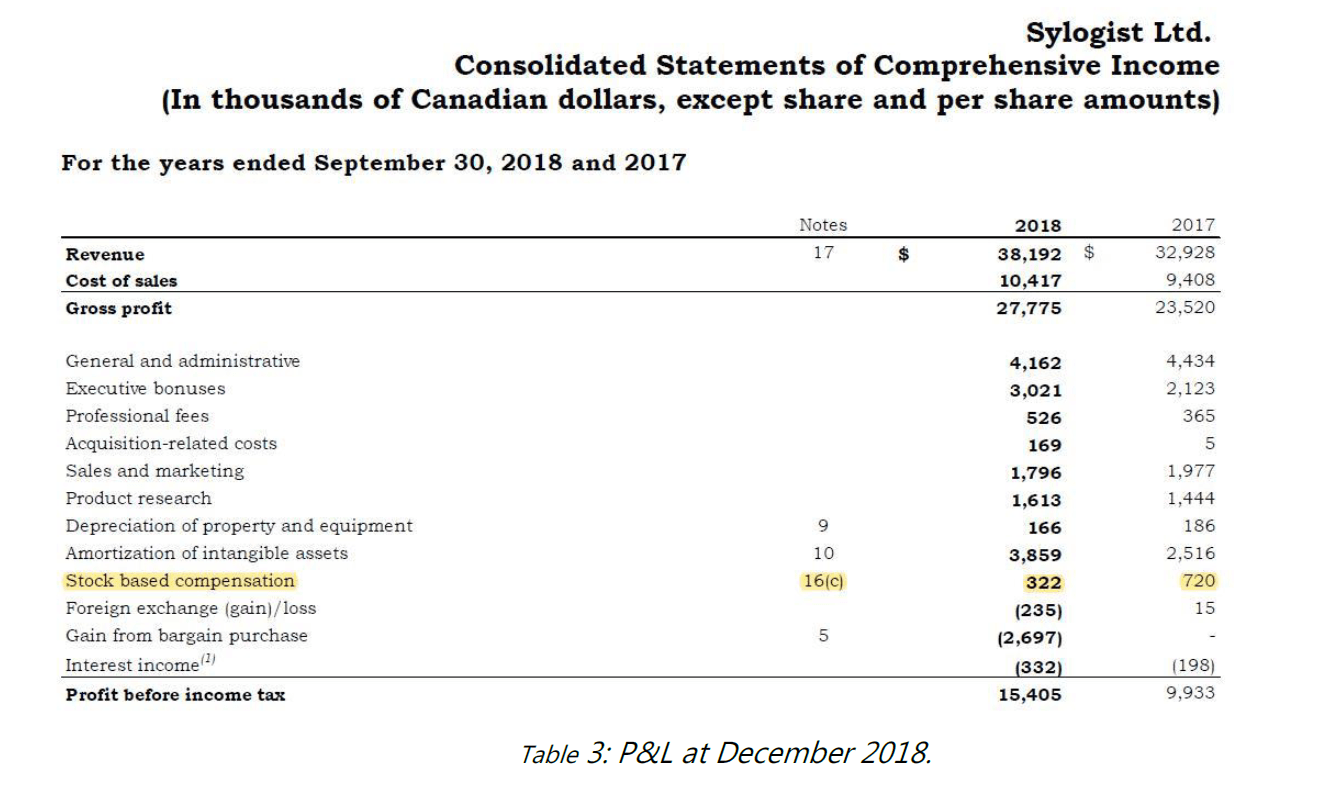
Stock based compensation is not explicitly stated as an operating expense and can often be bundled in SG&A, Cost of Goods Sold, capitalized as stock in manufacturing businesses, etc. In Sylogist’s case, it reports a unique line item in its September 2018 annual P&L.
Table 3 shows how variable stock-based compensation for 2018 was much lower than the prior year. IFRS 2 Share-based payment dictates companies have to impute the expense on the date on which they are granted and priced at market value. The “vesting period” is usually between 3 to 4 years and paid in lineal or accelerated payments. The market value on the grant date is a fixed amount and, as there is no market-to-market, the line item under US GAAP or IFRS does not have to reflect the true economic value. Let us now look at SYV and the terms and conditions of their stock-based compensation plan:
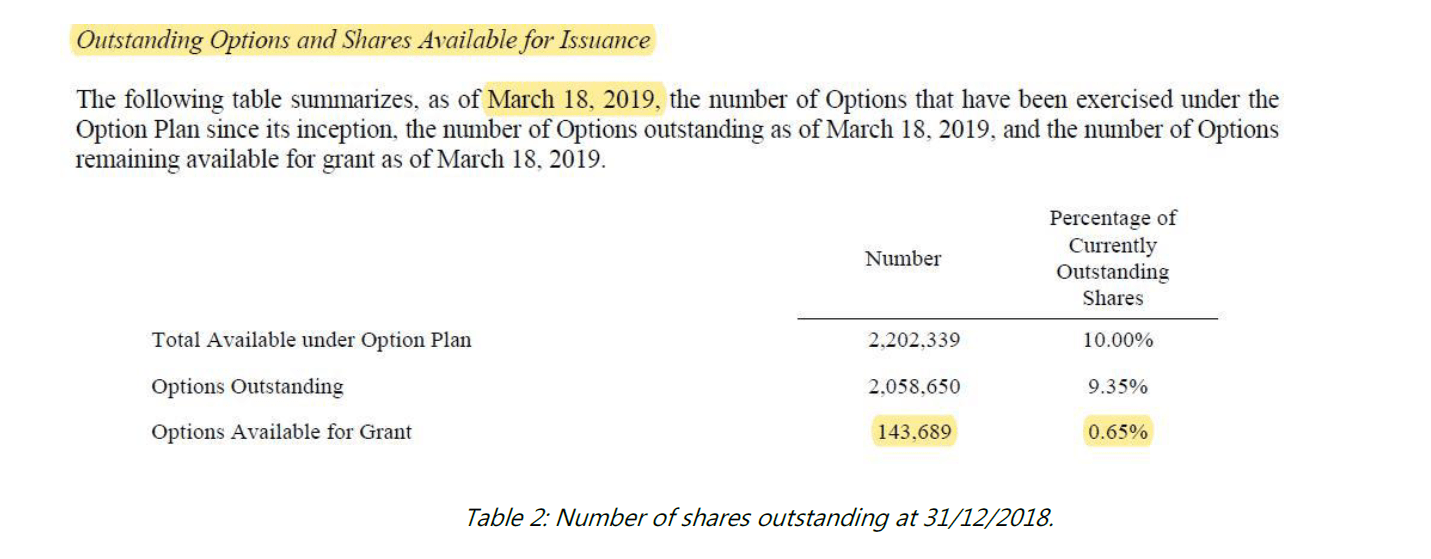
Under Text 2, we can see how the stock option plan cannot exceed 10% of the total shares outstanding and its vesting period is approximately 3 years.
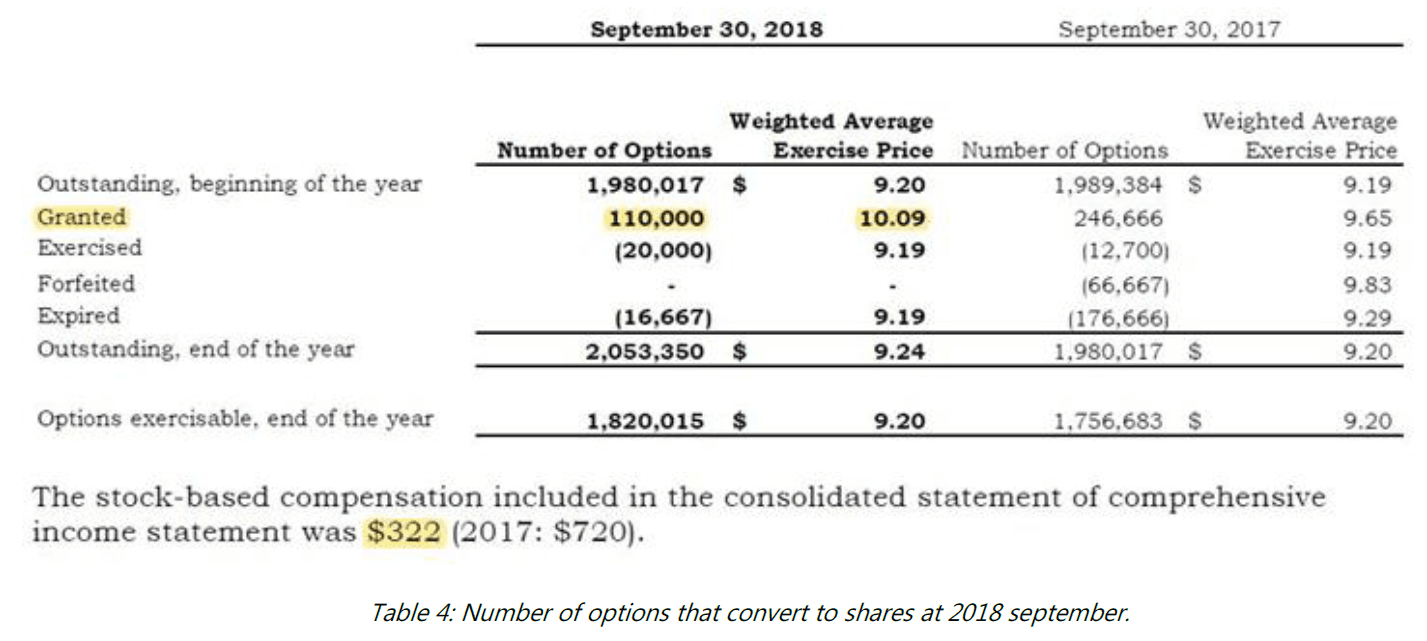
Table 4 outlines the detail behind the stock option plan at 2018 year-end close (3Q18). Sylogist granted 110,000 options worth on average $13 with an average exercise price of $10.09. If we apply Black-Scholes method to determine the value of these options, this adds up to $322,000 in cost. During 2018 there were no forfeited stock options; however, SYV aggressively estimated this to be around 10%. Therefore it’s important we now at look at the inputs behind their Black-Scholes calculation.
Generally, we expect companies to estimate the forfeiture rate between 2 and 10%. In Sylogist’s case, it doesn’t seem too high, as a higher percentage rate will reduce the expense in the P&L. It is also an accounting guideline that companies report the number of options in effect by years and by average exercise price.
In order to calculate the number of outstanding shares, companies will apply the “treasury stock method”, where cash is used to repurchase stock at market value and netted off by the gross amount of new issued shares. SYV currently has an active share repurchase plan of 2 million stocks during the next 12 months, although the scheme is entirely aimed at compensating the future dilution in shares created by new issuances.
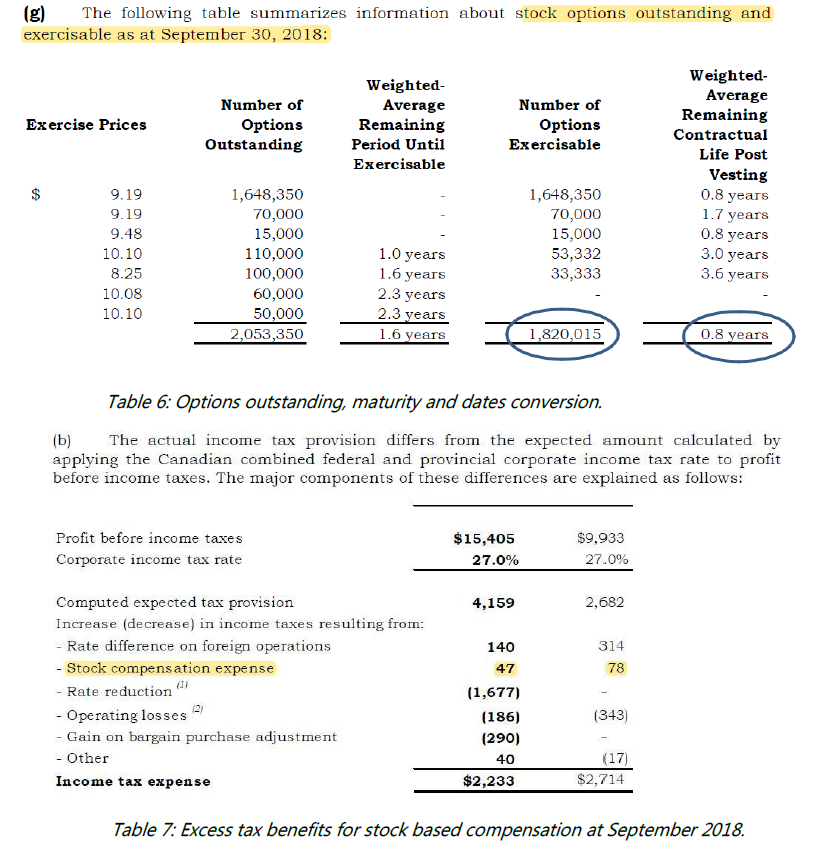
According to IFRS and US GAAP, the variable compensation based on stock options does not imply an effective outflow of cash. Therefore, when we calculate Cash from Operating Activities (CFO), we add this line item back again. Under US GAAP, the CFO had to be adjusted upward in such a way that it reflected the tax breaks awarded to stock options until the beginning of 2017 and make it comparable to IFRS. In the event of a significant share price drop and options are exercised, you expect there to be a lower deduction in the tax rate and therefore a higher effective rate. This would imply a downward adjustment in Deferred Tax Assets or DTAs. In SYV’s case, there are no substantial differences shown under Table 7 but it could apply to other companies, especially those in the IT business.
- Market size.
The competitive landscape of enterprise resource planning solutions (ERP) in the U.S. and Canada is largely fragmented and none of the competitors can claim 5% of market share. It’s an attractive niche market where historical growth ranges between 6-8% and has accelerated even more, considering the recent changes in traditional business lines to Software as a Service (SaaS). Gartner, a consulting firm in this space, foresees an 8% growth rate for ERP in the U.S. for the following years. Although Canada appears to be a more mature market, the U.S. shows potential for growth, especially in the fields of education and municipal governments.
Sylogist judges that approximately 2/3 of the U.S. public sector runs on old systems and technology that was rolled out, in some cases, over 20 years ago. The functionality behind that technology is low and is focused on account management, pay accounts, budgets, etc.
The digital transformation to phase out old systems in small and mid-sized companies in the U.S. is a huge opportunity for SYV to actively pursue. Their potential can also continue expanding through more acquisitions of software companies and client portfolios. Modern day ERP solutions cover anywhere from payroll, flexible financial reporting, analytical tools, among many other functions. The more customers convert to SaaS and increase SYV’s subscriptions, the lower the costs will be – in proportion to their revenue – on SYV’s traditional business.
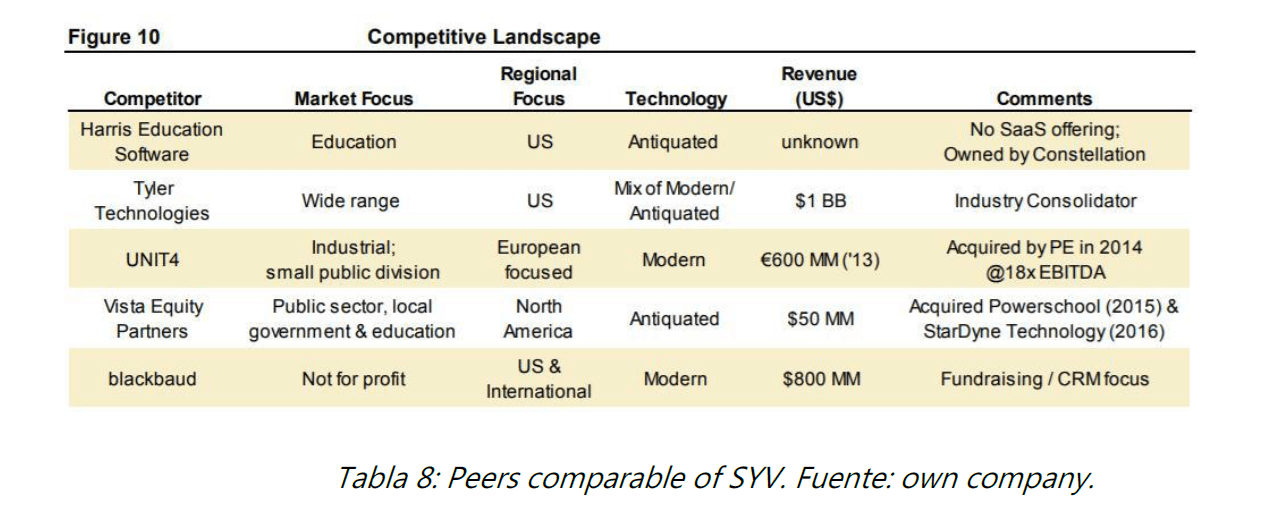
SYV’s main competitor is Tyler Technologies (TYL) with more than $ 1 billion in sales. For TYL; however, the ERP is only one of its business lines, unlike SYV that has it as its core business. Other players in the market include Blackbaud (BLKB) and Harris Education Software.
- Fundamental valuation.
Our valuation was done through a Discounted Cash Flow (DCF) model by multiples, applying the following assumptions:
- Total Revenue: total sales growth of 2.5% for the current year and 7% from then on. We expect the licensing business to continue to drop by double digits, although it only represents $ 2 million worth of business. On the other hand, the subscription and maintenance business is expected to grow above 8%.
- Margins: We assume an EBITDA margin of 49% for 2019e and more than 50% from then on, as a result of the greater proportion the subscription model will weigh.
- Reinvestment: Since the nature of the subscription business is less intensive on capital, CAPEX investments is lower than 0.2% of Total Revenue and we didn’t assume any inorganic growth through additional acquisitions. In terms of working capital, we kept it the same and estimated the total variable compensation cost to senior management as 4% of sales, under a conservative scenario. Lastly, we included the share repurchase plan for 2 million shares in the next twelve months to off-set dilution from future new share issuance. The forecast pay-out ratio in our model is 55%.
- Capital Structure: Sylogist has no debt on its balance sheet so in order to calculate its target price, we deducted their $33.7 million of Cash on balance, $11 million of deferred revenue and added back the $ 2 million prepaid expenses.
- Tax rate: We assumed a 20% rate, which accounts for the tax deduction on the senior management’s compensation plan.
- Valuation multiples: Even though comparable companies trade at 20x EBITDA or 35x Earnings, we’ve assumed a more conservative approach and gone with 16x EBIT and 20x earnings.
- Target price: Our base scenario target price $15, with an expected profitability rate by 2021 of more than 30% and an internal rate of return higher than 9%.
- Negative scenario: Under a less favourable scenario, we assumed sales would remain flat, variable compensation would rise and an EBITDA margin lower than 48%. All the previous rationale and assumptions lead us to justify a $10 per share price.
If you would like to access the valuation model or would like additional detail behind it, please contact us via email.
To sum up, we’ve begun building a position in SYV with an average price of $10.95 — making up 2% of our total capital — which we see increasing, if its share price were to continue to fall.
Quim Abril Auladell
Founder and and portfolio manager of Global Quality Edge Fund

