The Broad Market Index was up 1.23% last week and 59% of stocks out-performed the index. The annual financial statement update is only just beginning with only 1/4 of the market value of U.S. companies have delivered their 10-K filing to the US Securities and Exchange Commission (SEC). It is still too early to arrive at reliable macro-economic (market level) conclusions but stay tuned as we gather financial accounting data.
Q4 2020 hedge fund letters, conferences and more
Data Revealing Strength of Recovery
Oddly enough, any evidence that the recovery from the pandemic decline is over (or soon to be) does not diminish the current high risk and vulnerability to a stock market correction. What it does mean is that we should buy good quality and improving companies when share prices are depressed. There are some good quality and improving industrial companies with share prices trading at bargain levels. Look for them as we recommend using a factor-search and targeting rising-sales-growth companies.
Most of the recent growth and financial improvements are from companies recovering from mild to very steep negative sales growth. The strength of the broad recovery is still very much unknown. Purchases of big-ticket consumer goods are up and there is high and rising sales growth among housing companies. We also see rising, but still negative, sales growth among auto companies. This is the early pattern of a typical industrial cyclical recovery.
Goldilocks Recovery Scenario
Historically, this cyclical recovery pattern will extend over the next two years to other industrials such as steel, chemicals, transportation and machinery. This recovery pattern is also associated with higher commodity prices and rising inflation as the economy overheats. For now, the OTOS Goldilocks recovery scenario (not too hot or too cold) is the most consistent with the early empirical evidence.
Watch Energy Companies
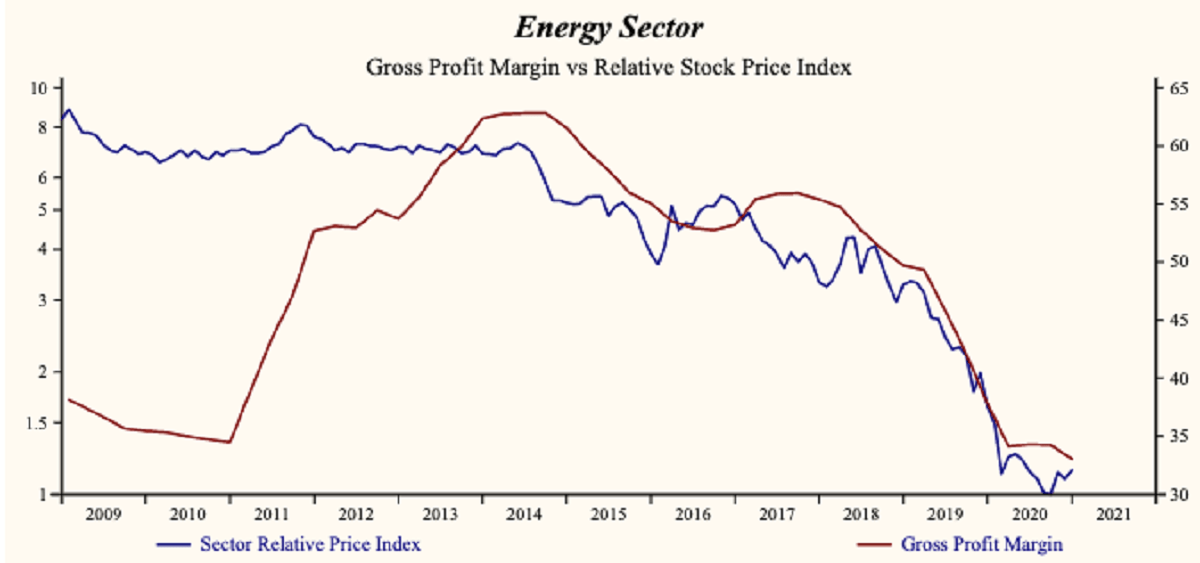
Historically, a strong industrial/cyclical recovery in the US has been associated with higher commodity prices where oil prices tend to lead. The most reliable factor-indicator of persistently higher oil prices is lower capital-expenditures-relative-to-sales (CapX/Sales) which is becoming more evident in recent financial statements of energy companies.
Lower investment (CapX) means lower production growth (Sales). As the industrial cyclical recovery progresses; excess oil supply is used up and a glut turns into a shortage.
Good time to look at the Energy sector with a focus on Oil & Gas industries as they will provide predictive guidance on the road to recovery. Independent Power and Natural Gas industries have increasing margins and are poised to provide ample buy ideas as we wait for more data and search for share price bargains.
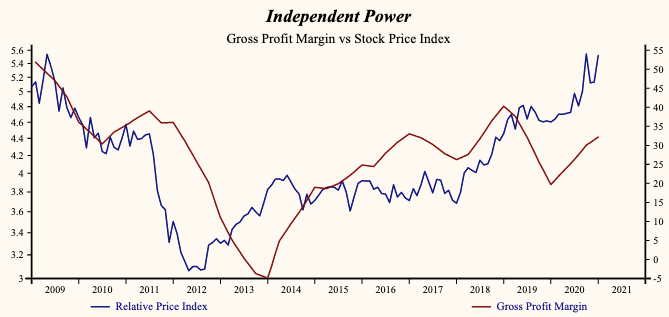
Independent Power Increases Margins
The share price index of the Independent Power Industry has advanced by 45% relative to the Otos Total Market Index since the January, 2017 low. Valuation remains high with the current relative price-to-sales near the highest level in the record of the Industry.
Currently, sales growth is low in the record of the Independent Power Industry but higher than last quarter.
The Industry is recording a rising gross margin which is a key indicator of potential growth and financial stability. The proportion of total market capital accounted for by rising gross profit margin companies is high but down to 90.9% compared to 94.8% last quarter. Inventories are increasing relative to sales which could very well diminish the chance of a future increase in the gross margin. The shares have been correlated with the direction of the gross profit margin.
Sales, General & Administrative (SG&A) expenses are low in the record of the industry and rising. The gross margin is rising at a faster rate than SG&A expenses, producing a rising EBITDA margin.
For now, there are only 2 stocks in this industry with unusually depressed share prices. There are so far no current buy decisions in that group but keep searching for depressed-share-price with strong margins for buy ideas in this industry.
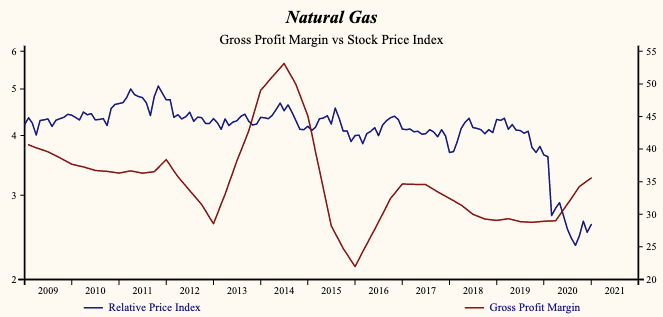
Natural Gas Heating Up
The share price index of the Natural Gas Industry has declined by 40% relative to the Otos Total Market index since the June, 2017 high. Valuations remain low with relative price-to-sales is near the lowest level in the record of the Industry.
We have collected sales data for all the comparable record companies in the Natural Gas Industry. Currently, sales growth is low in the record of the Natural Gas Industry but higher than last quarter.
The Industry capital weighted average sales growth rate is -13.5%. The proportion of Industry market capital accounted for by rising sales growth companies is up to 62.7%; compared to 32.3% last quarter.
This industry is recording a low and rising gross margin. Inventories are down, improving the chance of a further increase in the gross margin.
Sales, General & Administrative (SG&A) expenses are low in the record of the Industry and rising. That implies that the industry has limited scope for further cost containment and rising costs are slowing the EBITDA growth rate relative to sales. However, the gross margin is rising at a faster rate than SG&A expenses producing a rising EBITDA margin.
As of last week, there were no stocks in this industry with unusually depressed share prices and therefore no current buy decisions in that group.
Monitor and look for upcoming buy opportunities from evidently accelerating companies that are trading at the bottom end of their most recent volatility range. Market volatility will create tempting bargain opportunities but maintain only a portfolio of companies with solid fundamentals, high cashflow and solid margins.
Investors do not wait. Act now!
With share prices at all-time highs and corporate growth broadly falling, it has never been more important to make active decisions with your investments.
Otos personal AI supports any investment portfolio construction and accommodates the broad range of investing strategies, styles, risk preferences, time horizons and goals.
Otos performs ongoing investment monitoring at the component and portfolio level which ensures that the desired attributes, preferences, and performance are sustained through time.
Using these active strategy elements, Otos has generated premium returns with lower volatility. You also get control and confidence which will be very welcome as we navigate the most uncertain investing environment ever.
Get active now! Otos is welcoming new founding clients and offering an equity interest in the fintech Otos Inc.

