In the volatile world of cryptocurrencies, investors often face the question of whether a particular coin, especially Bitcoin, is really worth it or not.’ An accurate answer to such a question is hard to get, but understanding key metrics, such as Bitcoin MVRV, can give you a good idea of the coin’s price movement and if it is over- or undervalued.
The Bitcoin MVRV z-score is a popular tool that compares the market value of all circulating Bitcoins with the realized value of those coins. In simple words, the tool helps investors identify potential buying or selling opportunities.
This guide details all about the Bitcoin MVRV ratio, including what it is, how it is calculated, its uses, drawbacks and more.
What does the MVRV measure?
MVRV (or market value to realized value) measures the ratio of Bitcoin’s total market value (MV) and its realized market value (RV). The tool uses the historical data to evaluate whether Bitcoin is overvalued or undervalued relative to its ‘fair value.’
In simple words, when MVRV is high, it implies BTC’s market price is more than what holders originally paid for. On the other hand, if the BTC ratio is low, it suggests bearish sentiments among the investors.
What is the Market Value (MV)?
MV or market value is simply the dollar market capitalization of Bitcoin. We can easily calculate MV by multiplying Bitcoin’s current price by the number of coins in circulation.
MV = Current BTC Price × Circulating Supply
Alternatively, Bitcoin’s market cap figure is also easily available on the best crypto exchanges and aggregators like CoinGecko, CoinMarketCap and more.
What is the Realized Value (RV)?
Realized Value (RV) reflects the value of each coin at a price when it was last moved, transacted, or traded on-chain, i.e. when it was moved from one wallet to another. In simple words, RV is what most people pay for their coins.
The last moved or traded price of all coins is added up to get their average, and the resultant number is then multiplied by the total number of coins in circulation to come up with RV.
RV= Price of Each BTC at Last On-Chain Movement × Circulating Supply
Such a value gives a more realistic valuation as it strips out the short-term market sentiment to give a ‘true’ long-term measure of Bitcoin value. Calculating RV is harder, but luckily, the data is easily available online as well.
What is the Bitcoin MVRV z-score?
A z-score adds an element of statistical measure to the combination of MV and RV. Such a measure indicates the number of deviations from BTC’s ‘normal’ valuation range.
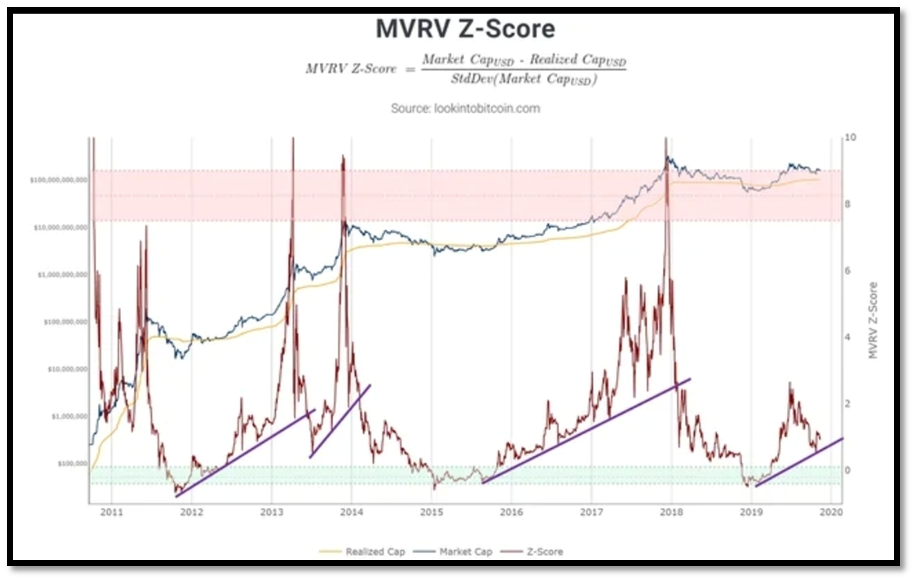
MVRV z-Score = (MC – RC) / Standard Deviation of (MC – RC)
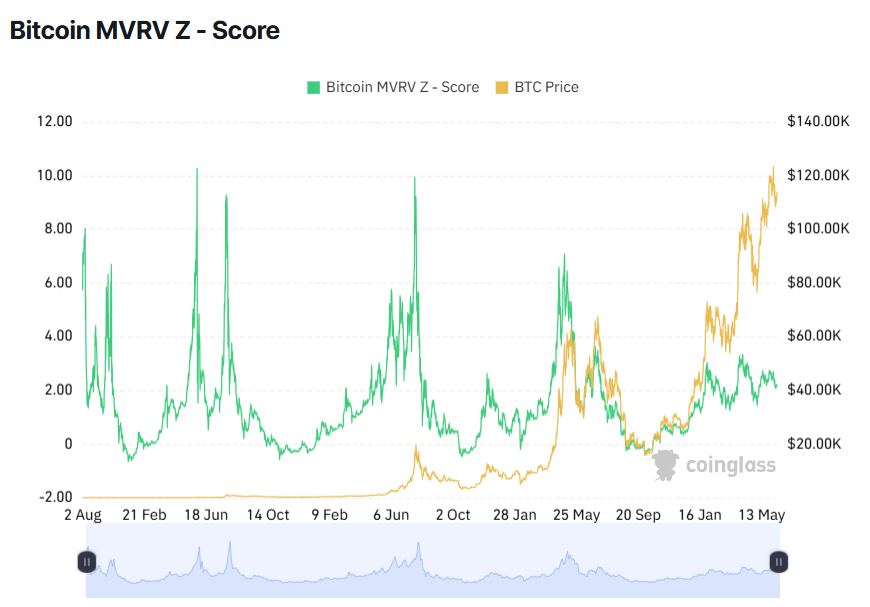
In simple words, the MVRV z-score gives insight into the market sentiment and potential price reversals by allowing us to see the difference between BTC’s current price and its all-time moving average price. Or, we can also say that the z-score lets you determine if BTC’s current price is abnormal or not when compared to its past value and price history.
How to use the Bitcoin MVRV ratio?
In general, the MVRV ratio is presented as a line chart, which already has a line with value 1 (MV = RV), representing Bitcoin’s fair valuation. The calculated MVRV ratio is plotted on the chart over time.
When the MVRV ratio is over 1.0, it means BTC’s market value is more than the realized value, suggesting a potentially overvalued market. On the other hand, when the ratio is less than 1.0, it means MV is more than RV, indicating a potentially undervalued market.
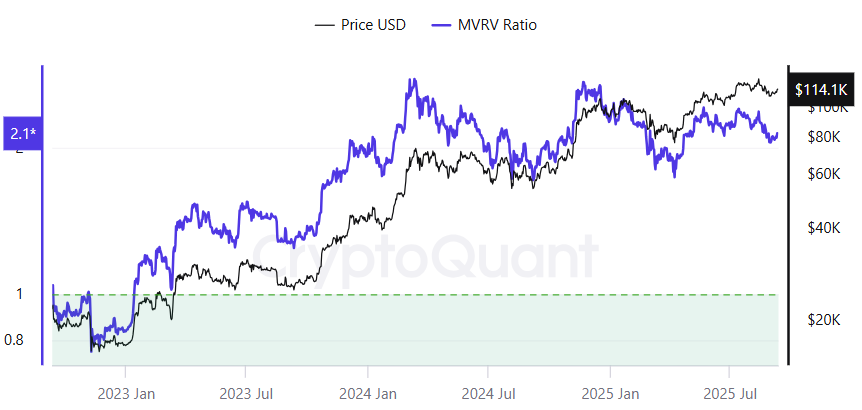
Additionally, the ratio could be well above or below 1.0, representing extreme spikes or dips.
Such spikes give us insights into the market sentiments. For instance, a sudden spike in the MVRV indicator could mean excessive greed and speculative activity. Similarly, a sharp dip in BTC MVRV may indicate widespread fear and panic selling, or a possible buying opportunity.
A big question, however, is what constitutes a high and a low value of MVRV?
Bitcoin MVRV high and low values
A simple way to find it is to first mark out MVRV key levels using historical data that appear to be in line with the tops and bottoms. Now, find out the proportion of days when the MVRV has traded above or below these key levels.
Suppose that if an MVRV value (assume 0.8) has traded below that level for about 10% of trading days, it means it has traded above that level for 90% of days, and this makes the latter scenario more likely. So, below 0.8 will be extremely low, while a value between 1.0 and 0.8 will be low. We can use the same process to determine extremely high and high values.
Now, if we plot the periods when the value of MVRV is above or below the key levels, we can easily spot cycle tops and bottoms.
How to use the MVRV Z-score?
Bitcoin MVRV Z-score is primarily used to identify whether or not BTC is trading at a fair price or if its valuation is too optimistic or pessimistic. When the score crosses a specific threshold (normally 7.0), it suggests that BTC is overbought or witnessing a speculation bubble.
Such a scenario is usually shown as ‘red zone’ on the graph, and indicates a likely market correction ahead. On the other hand, if the Z-score goes below 0.1, it suggests BTC is undervalued and a possible buying opportunity going ahead.
Bitcoin’s historical price reflects the findings of the MVRV Z-score. For instance, the z-score has been graphed in the red zone before witnessing a sharp correction during major bull runs in 2013, 2017, and 2021. Similarly, the BTC entered the green zone during historical bear markets, followed by a strong rally.
We can say that the MVRV Z-score is very helpful in identifying momentum for trading, including Bitcoin options, informing investors when the market is about to shift. To sum it up, investors can use the z-score in the following ways:
- Accumulate BTC if the z-score is less than 1
- Aggressively accumulate BTC if the score turns negative
- Exit position partially or fully if z-score > 7
Bitcoin MVRV momentum
Bitcoin MVRV momentum is basically a custom indicator that indicates the rate of change in MVRV ratios over short to medium terms. Such a measure helps analyze profit pressure dynamics and identify areas of high risk or opportunity. Moreover, momentum also helps map the changing psychology of holders over time.
How reliable is Bitcoin MVRV z-score?
Bitcoin MVRV z-score has historically proven to be a reliable estimate of a BTC’s fair value. Moreover, the metric has also been good at identifying changes in market sentiments. For instance, the z-score was able to accurately predict the drops of December 2013 and December 2018 about a week or two before the market crash.
Furthermore, unlike other statistical measures, the z-score provides more data. In addition to whether or not the cryptocurrency is overvalued or undervalued, the z-score’s peak gives insight into by how much the market is over- or undervalued, or what BTC’s fair value could be in the future.
Moreover, despite offering such insights on BTC, the z-score is comparatively easy to compute and use. The rise of Bitcoin ETFs, however, presents a challenge to the reliability of the z-score. As more Bitcoin’s are held and transacted through ETFs, a significant part of market activity will not be registered in traditional on-chain data.
Such a drop in data may make the score less accurate in the future. Thus, going ahead it will get more important to use the z-score in combination with other tools to get a comprehensive insight.
Bitcoin MVRV pros and cons
MVRV is a useful metric, but it is not without drawbacks.
Pros
- MVRV is simple to use and comprehend even for casual crypto users. Moreover, it provides a clear visual presentation that is easy to interpret.
- It is a reliable tool to identify trends in the market well before the actual change, as it is based on months of past data.
- In addition to telling whether or not BTC is over- or undervalued, the z-score also informs about the extent to which it is over- or undervalued.
- Investors can use the metric to time their Bitcoin staking in order to maximize their rewards and return.
Cons
- It doesn’t directly tell Bitcoin’s worth; rather, it primarily informs if it is overvalued or undervalued.
- Many experts are of the view that instead of using all of Bitcoin’s previous price history, the MVRV metric should only use the last four or five years of data, as it is more consistent.
- It is believed that as more users get familiar with the MVRV metric, the market may rectify much sooner, making the metric less effective.
- Historically, the metric has been weak in predicting the duration of the bear market and bull market tops.
Conclusion
As you now know, the MVRV is a powerful metric for assessing Bitcoin’s fair value and understanding BTC’s broader price movements. This, in turn, can help investors time their entry and exit more effectively.
However, the MVRV is not an absolute guarantee, and it works best when used in combination with other data to get the big picture. Furthermore, the metric must also be taken with a pinch of salt, as macro factors can rapidly make crypto prices extremely volatile, rendering tools like MVRV ineffective.