
Silver News
Relatively, last week for silver was stronger than it was for gold, a good sign in the short-term. Meanwhile, the gold to silver ratio fell back slightly towards 80. For the week as a whole, silver closed as of final trade on the COMEX at $16.47, a 0.1% decrease of only $0.02. As we’ve been reporting recently, silver is heading towards completing a large and symmetrical triangle consolidation. This can be seen in the blue outline on the chart here:
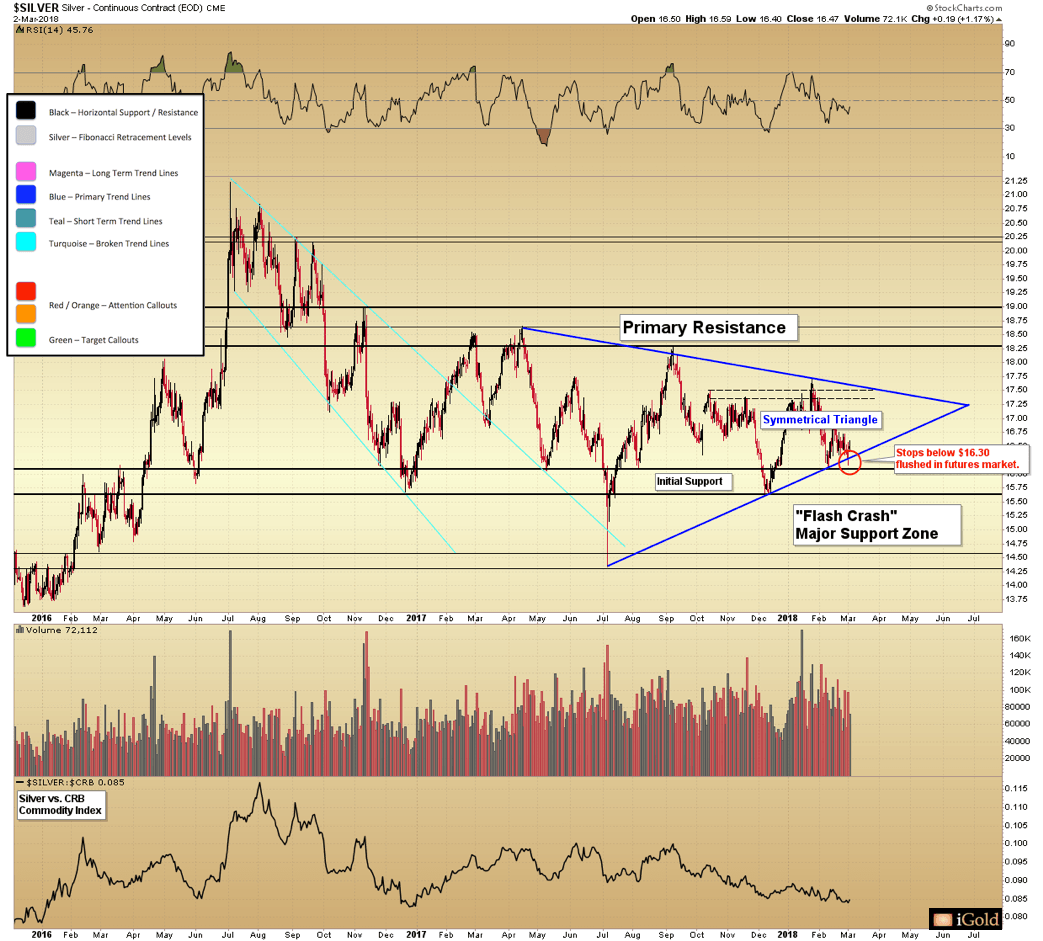
Silver only barely maintained its lower triangle boundary this week. This after flushing the stops of traders, located just under the lower but increasing boundary of $16.30, as seen in the above graph in red.
For the short-term perspective, this is good news. However, it is important to keep this point in mind: if this symmetrical triangle is to be resolved at a higher value, then silver must perform strongly in March and April. Should this not happen, we are looking at both a negative resolution as well as a red flag for the precious metals market in the long-term. For silver to show us that it is headed for a positive resolution, it must break the $17.60 point.
Gold News
Gold ended the week with a decrease of $7, a dip of 0.5%, closing at $1323 as of final COMEX trade Friday. The important news for gold investors to consider is the fact that gold is still working on its own ascending triangle pattern on its primary chart. On the graph below, this is shown in blue. Further, notice the five distinct tests on the upper horizontal resistance that have taken place since 2016, along with the obvious increasing support. Unless we receive some information to make us think otherwise, this is a bullish primary pattern that we are looking at right now.
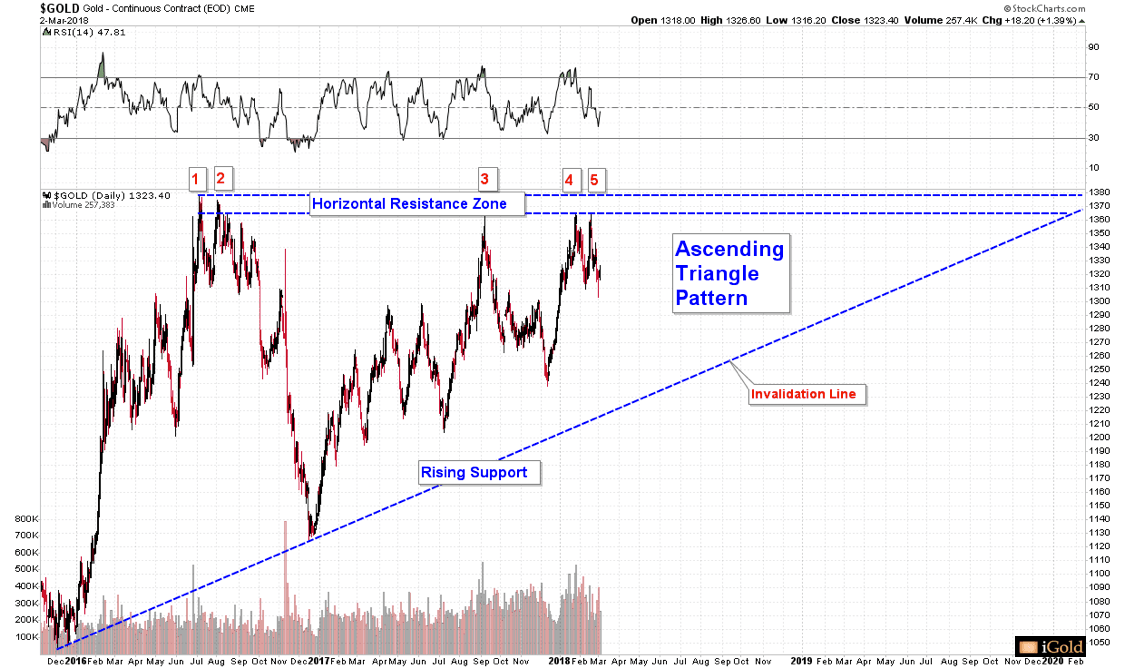
The 2016 high of $1378 sets the breakout point for this pattern. $1215 would be the invalidation point as the rising lower support line if it were to arrive now.
Keep in mind that we should not expect the apex of this triangle to reach until late 2019 from the facts shown on this chart. From a practical standpoint, most triangle foundations tend to resolve between two-thirds and three-quarters of the way through the timeline of the pattern. To put it simply: a break that is higher or lower is on its way this year.
To take a look at the deeper details of regular annotations for gold, it is our belief that gold is in the final consolidation before we see higher peaks than experienced in 2016. The graph below shows the two paths this action could take, whether more aggressive or more drawn-out, shown with red arrows. For now, the main point here is that gold is in a bullish ascending triangle for a multi-year timeframe. This is our stance until we receive information proving otherwise.
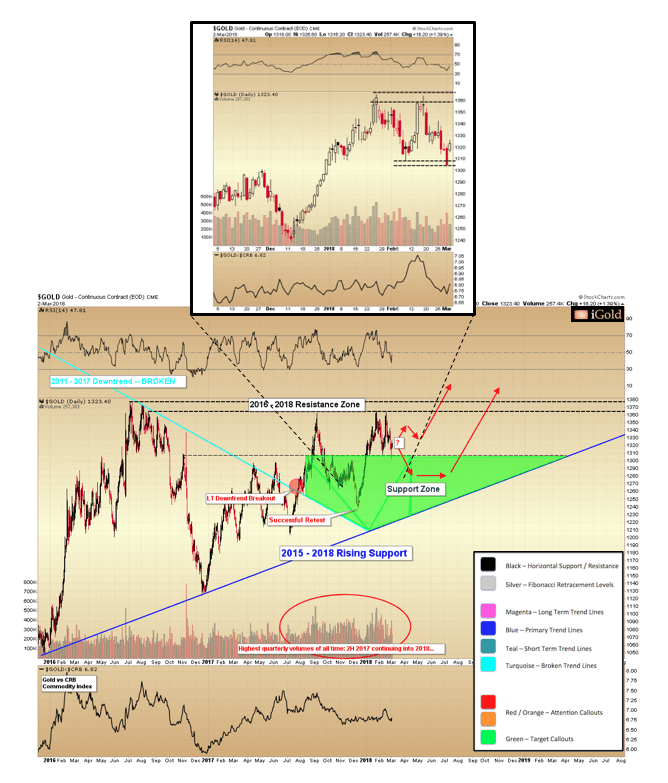
Gold shows on the top cut-out that it was able to maintain value on a closing basis higher than the low of $1307 hit in February. This makes the support area between $1303 – $1307 and the resistance area between $1359 – $1366, as seen in the black dashed lines.
With this updated zone of support defined, should $1303 fail on a daily closing basis, the way to determine the decrease would be to take the amplitude of the consolidation: $1366 – $1303 = $63. Subtract that from the breakdown point, giving us the target: $1240. Because this target is so close to the December low point of $1236, we confidently estimate that if the $1236 – $1240 range does not hold, then the bullish scenario is no longer likely.
It is not our estimation at this time that we will see a move this low. In fact, $1303 could be maintained, at which point the consolidation would resolve higher, and sooner. But we feel we need to include this information in our report for you as the lower target is so significant.
Next week we will bring to you reports on the likelihood of gold breaking higher than its 2016 peaks while silver breaks below its symmetrical triangle. Additionally, we will examine what this signal would mean for a long-term look at precious metals.
Christopher Aaron
Bullion Exchanges Market Analyst
Christopher Aaron has been trading in the commodity and financial markets since the early 2000’s. He began his career as an intelligence analyst for the Central Intelligence Agency, where he specialized in the creation and interpretation of pattern-of-life mapping in Afghanistan and Iraq. His strategy of blending behavioral and technical analysis has helped him and his clients to identify both long-term market cycles and short-term opportunities for profit.
This article is provided as a third party analysis and does not necessarily matches views of Bullion Exchanges and should not be considered as financial advice in any way.
Bullion Exchanges is located at 30 West 47th Street in New York City’s Diamond District and is open Monday through Friday 9 A.M. to 5 P.M. or online anytime at BullionExchanges.com.


