
Bretton Fund commentary for the first quarter ended March 31, 2021, discussing their new position in Gap Inc (NYSE:GPS).

Q1 2021 hedge fund letters, conferences and more
Dear Fellow Shareholders:
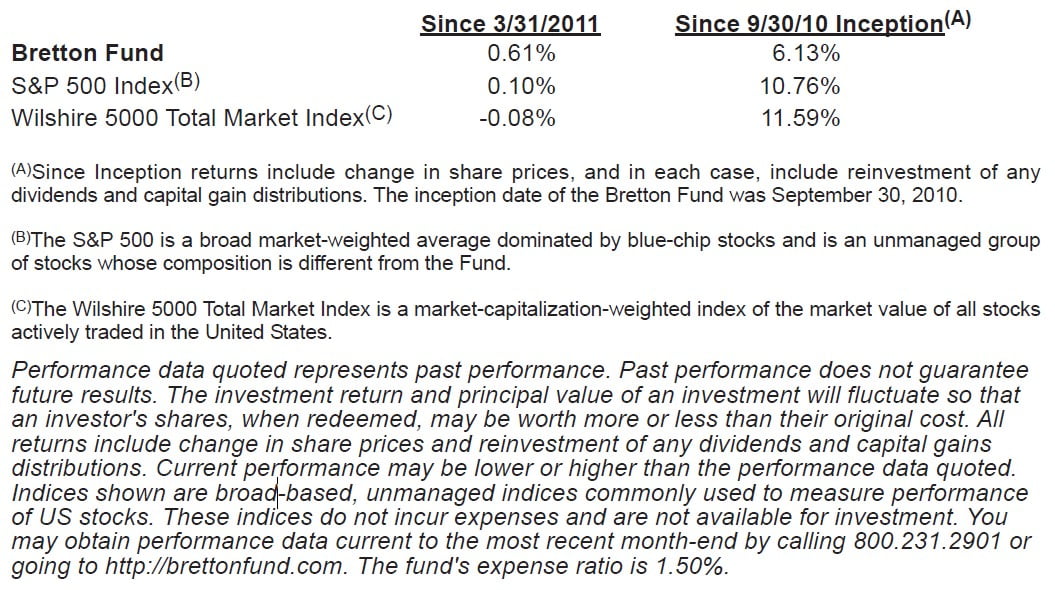
The Bretton Fund’s net asset value per share (NAV) as of June 30, 2011, was $16.55, and the total return for the fund for the quarter was 0.61%. Over the same period of time, the total return for the S&P 500 Index was 0.10%, and the total return for the Wilshire 5000 Total Market Index was -0.08%.
Contributors to Performance
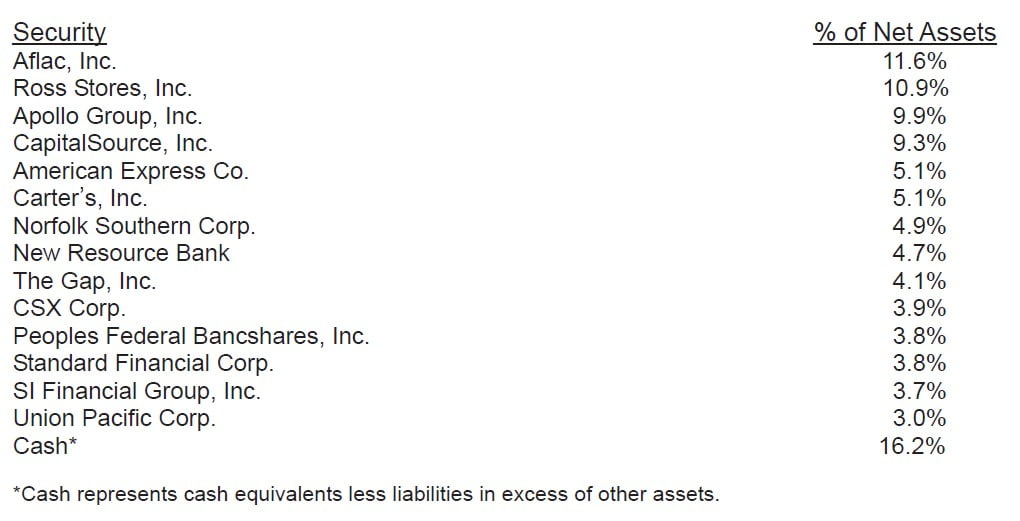
The investment with the most significant impact on NAV was AFLAC Incorporated (NYSE:AFL), which brought down the fund’s NAV by 24¢. The rise in the stock price of Ross Stores had the largest positive impact on NAV, increasing it by 21¢.
Portfolio
Carter’s
If you’ve had a baby or welcomed a grandchild in the past few years, there’s a good chance you’re familiar with Carter's, Inc. (NYSE:CRI) and a decent chance you’ve spent money with them. Carter’s is the largest maker of clothes for babies and toddlers, selling clothes and baby gear under its eponymous Carter’s brand and the OshKosh B’Gosh brand.
I find the transformation from raw cotton to “Hey, that’s a cool shirt,” a bit magical. There are the purely functional aspects of weaving and dyeing, but the designing and branding of the product is what can create above-average economic returns for a long period of time. Since 1865, Carter’s has done this better than anyone else in the baby apparel business. The company has been careful to attune its designs to current trends, without being trendy, and is a primary source of basics, like one-pieces and t-shirts, a strategy that makes it less likely that its appeal will go out of style.
In addition to selling to department stores, Carter’s operates over 300 of its own branded stores across the US, which is much less than its full potential. Each new store it opens draws in more new customers, a positive indication of its future earnings potential. It only recently started selling clothes through its website, and the early results are promising. I don’t expect Carter’s to grow its revenue at the same 14% compound annual rate it grew over the past 10 years, but it should grow faster than the US economy as a whole.
A short-term problem that Carter’s faces is abnormally high cotton prices, which has increased Carter’s costs. Over the past 30 years, cotton prices have averaged about 70¢ per pound, but shot up to as high as $2.30 per pound earlier this year, a 140-year, postbellum high. Some investors like to talk about “commodities” as a single entity or investment class, but cotton is not like oil or natural gas: There is not a fixed amount of cotton in the ground that we are using up every day. When people use more cotton and prices go up, farmers plant more cotton. It takes time for cotton to grow, and thus a while for the market response to impact prices. There was indeed a temporary shortage of cotton that caused a price spike, but I strongly suspect it was exacerbated by speculation. The Wall Street Journal reported in January that cotton farmers in rural China were filling their homes with their entire cotton harvests, hoarding in the hopes of seeing prices go up even further, to me an indication of a speculative bubble. This behavior can distort short-term prices, but the fundamental supply and demand for cotton eventually determine market prices. Since March, cotton prices have receded sharply down to $1.05 and look to be going lower.
When Carter’s announced that high cotton prices would cut into its earnings for the rest of the year, many investors sold their stakes in the company, giving the fund an opportunity to add to its existing position, an opportunity only because of our longer-thanaverage time horizon. This investment is in the sweet spot for the Bretton Fund: a great business facing a temporary problem.
Portfolio Changes: New Investment - Gap Inc
In the period since March 31, the fund made one new investment: Gap Inc (NYSE:GPS), another purveyor of apparel, whose brands include Banana Republic, Old Navy, Piperlime, and Athleta. The investment case for Gap Inc is similar to that of Carter’s, but Gap does not need to grow its appeal or number of stores for our investment to turn out well. The company’s share price is so low compared to its normalized earnings (most of which management distributes to shareholders), that even if it doesn’t grow its revenue at all, we’ll do just fine.
The fund sold two securities during the quarter: Federated Hermes Inc (NYSE:FHI) and Kaiser Federal Financial Group. These two securities appreciated over a short period of time, and my estimates of their values were lower than my original analysis. I became concerned earlier this year when Federated’s management started beating the war drums harder about wanting to make a big acquisition, “especially international.” Large acquisitions are an easy way to destroy shareholder value. Our total gain including dividends on Federated was 18%, or 42% on an annualized basis (known as an internal rate of return or IRR).
The unexpected retirement of the CEO of Kaiser Federal, a bank in Southern California affiliated with the hospital, combined with a lack of clarity about its loan quality led me to sell the fund’s position. The investment returned 20% overall, for an IRR of 56%. While these IRRs are great, they were for short periods of time, and given the difficulty and time it takes to find undervalued securities, I would have preferred a smaller IRR but over many years.
The Siren Song of Growth
Growth is good. All things being equal, an investor would rather invest in a growing business than a stagnant business. But the key phrase here is “all things being equal,” and there are so many other factors that can eliminate any benefit of even rapid unit growth. It’s an easy mistake for an investor to become single-mindedly focused on growth as the sole or even primary variable when it’s only one of many.
For example: Imagine it’s the year 2000, and you’re faced with two investments options. You could own a leading maker of computer memory for the fast growing personal computer market, a market that will sell an average of 9% more computers each year for 10 years, or you could invest in a railroad, a drab industry that will increase the amount it transports by less than 1% a year. The computer industry is dynamic—exciting even—with better, faster products introduced constantly. Compounding at 9% a year, the industry will sell 2.3x as many computers in 10 years as it does now. In short, it’s a rapidly growing market. Your other investment option is in the railroads, a boring sector that might make occasional marginal improvements like faster speeds and greater loads, but won’t be fundamentally different from how it operates today. There are no new products or features; railroads move heavy things from one point to another. The amount of cargo shipped will basically be the same 10 years from now. In short, it’s a no-growth market. Assuming you could invest in either of these business for the same price, i.e., at the same ratio of price to earnings, which would you choose?
The first company could have been Micron Technology, Inc. (NASDAQ:MU) in 2000. By 2010, Micron ended up selling exponentially more bytes of computer memory than it did in 2000. The problem is that the price per byte in 2010 was exponentially lower than what it was in 2000. Moore’s Law may be great for consumers, but it’s been pretty awful for the memory business. The economic attributes of the industry have made it hard for any company to earn a decent return on its capital sustainably. Micron and its competitors all have access to the same equipment, and because that equipment gets significantly better each year, the company with the newest equipment can make the highest capacity memory chips more cheaply than the guys with the old equipment. The result is an expensive game of leapfrog, with companies constantly making big-ticket capital purchases hoping to gain an edge, which turns out to be an ephemeral one. Micron was able to sell more memory, but at prices that couldn’t cover the cost of its equipment. Occasionally a company can obtain some type of inherent cost advantage, but in a competitive, commodity industry with rapidly improving capital equipment, it’s tough to maintain a high return on capital for very long.
Your other investment option would have been the railroad company CSX in 2000. CSX ended up transporting 13% fewer railcars in 2010 than it did in 2000. Like the memory business, the product is undifferentiated, but it has two important advantages. CSX has only one competitor, and it’s close to impossible to create a new railroad from scratch with a similar rail network as CSX. Despite seeing its overall volume decline, CSX was able to increase the amount of revenue it earned per car by an average of 5% per year for 10 years. Compare that to the memory business, which saw 50% price decreases in some years. More important, CSX didn’t have to play catch-up with its capital purchases against a slew of competition. Locomotives aren’t cheap, but CSX’s capital expenditures were much less than the additional revenue it generated through prices increases. CSX distributed much of its earnings to shareholders through dividends as well as purchasing significant amounts of its own stock, which resulted in the remaining shareholders owning a greater proportion of CSX’s future earnings. Micron did the opposite by issuing stock to acquire other memory companies, diluting its shareholders’ interests over time.
Again, this is not to say that growth is in any way undesirable. It is highly desirable. This is to say that there are other microeconomic dynamics that are important—and underrated—determinants of future earnings. Compounded over 10 years, these forces can result in stark differences. In 2000, Micron earned $2.56 per share, but only $1.85 per share by 2010, a 28% decline, and it’s currently on its way to earning 38¢ per share this year, a drop of 85% since 2000. CSX, through its price increases, moderate capital purchases, and share buybacks, increased its earnings per share from 15¢ in 2000 to $1.36 in 2010, an increase of 807%, a not-so-drab compound annual rate of 25% per year. All that from transporting fewer railcars than it did 10 years ago.
Put succinctly: unit growth investment growth.
Housekeeping
We’re joined this summer by our first intern, Adi Gaur, a junior at my alma mater, the University of California, Berkeley. He got his summer job in a decidedly new-fashioned way: He found me on the Internet. Adi hails from New Jersey and will be helping out with the investment research.
We are initiating an e-mail distribution system for our shareholder letters, and if you’d like to be put on the distribution list, e-mail me at [email protected] or sign up on the website (http://brettonfund.com). Our shareholder letters are published on a quarterly basis online (and now via e-mail), with the annual and semiannual reports that include financial statements distributed to shareholders via postal mail.
At this early stage in the fund’s existence, I continue to be the fund’s majority shareholder. Most of my net worth is invested in the fund, and as a policy, I own no marketable investment securities other than the Bretton Fund. My interests are heavily aligned with yours.
Thank you for being a shareholder,
Stephen J. Dodson
President
Bretton Capital Management


