
British Property Owners see an Increase of AT LEAST £25,000 after 10 Years of Ownership
[REIT]Q4 2020 hedge fund letters, conferences and more
Finding a forever home is the aim for thousands of UK property buyers, and the search has become even more important with millions of Brits working from home during COVID-19.
In our latest study, Bequests has looked at several locational, financial and lifestyle factors to determine the best cities and London boroughs to find your forever home.
Our study revealed that Brits are likely to stay in their homes for only an average of 12 years, with this number rising to 17 years within London.
The study takes into account the quality of schools and crime levels, along with the average price and size of houses in major UK cities, and London Boroughs, as well as looking at factors specific to properties, such as size and price.
Swansea Is the Best City to Find a Forever Home in the UK
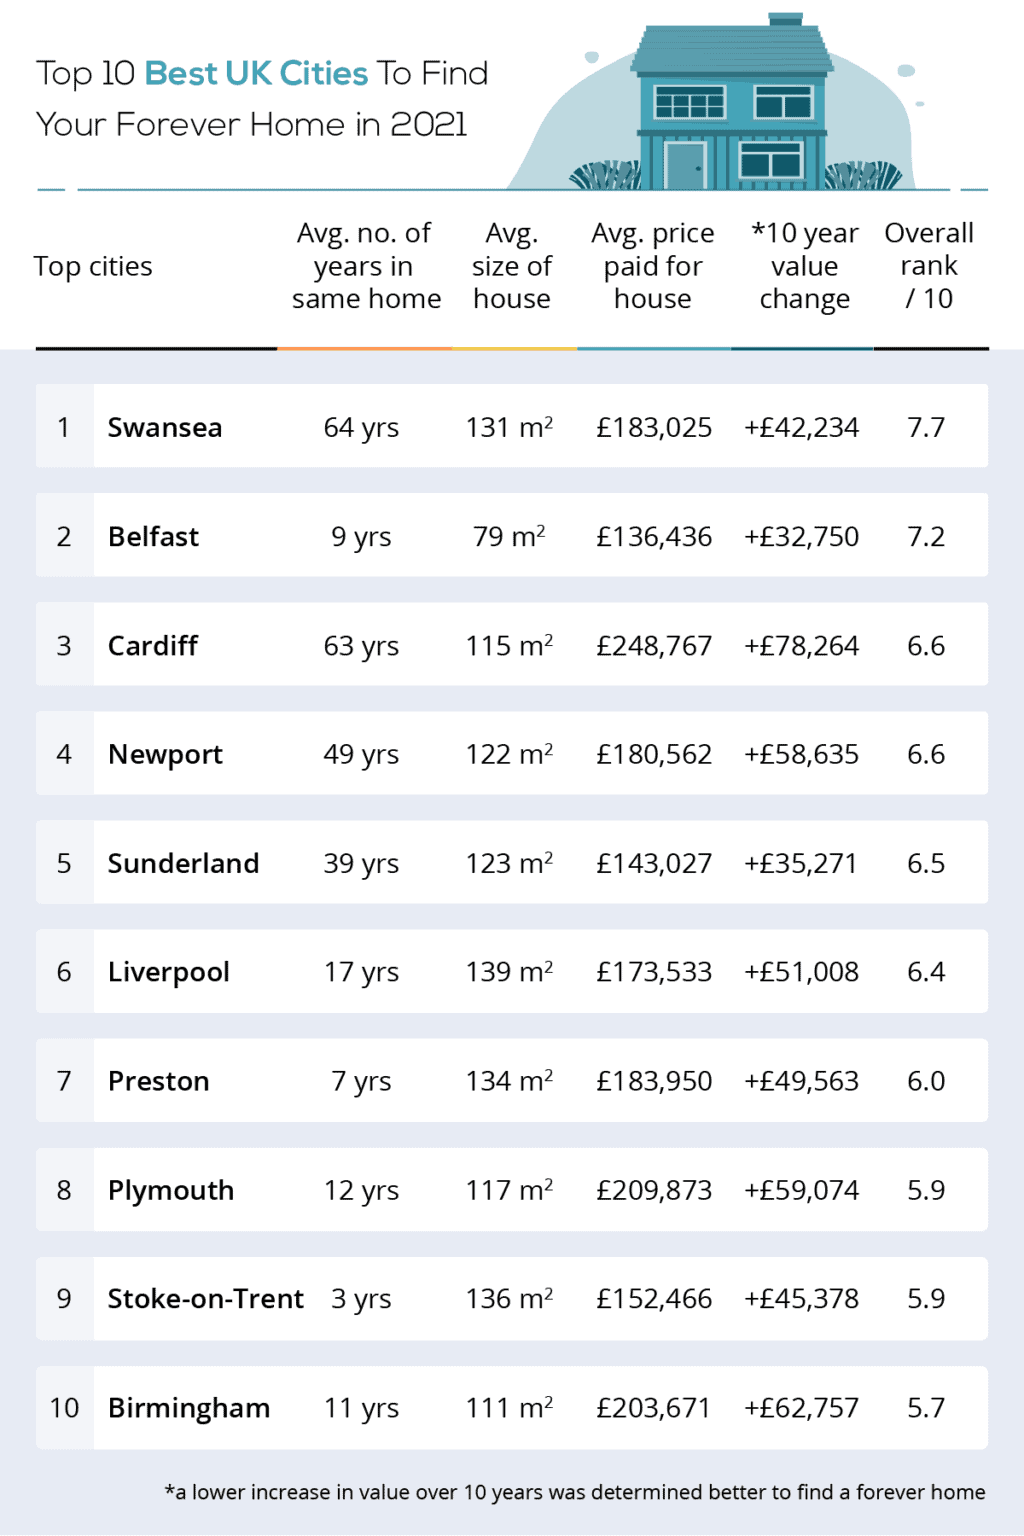
Wales boasts the best cities to find a forever home out of the whole of the UK. The three Welsh cities ranked, Swansea, Cardiff and Newport ranked first, third and fourth respectively. Newport and Swansea are also in the ten lowest average price for properties, meaning a forever home could be more affordable, and achievable, than you may think.
Despite only ranking sixth, Sunderland is the city where individuals are the least likely to move homes. On average, Mackems will move home around every 39 years, compared to people in Nottingham who will move home every two years in order to try and find their forever home.
Reading Is the Worst City to Find a Forever Home in the UK
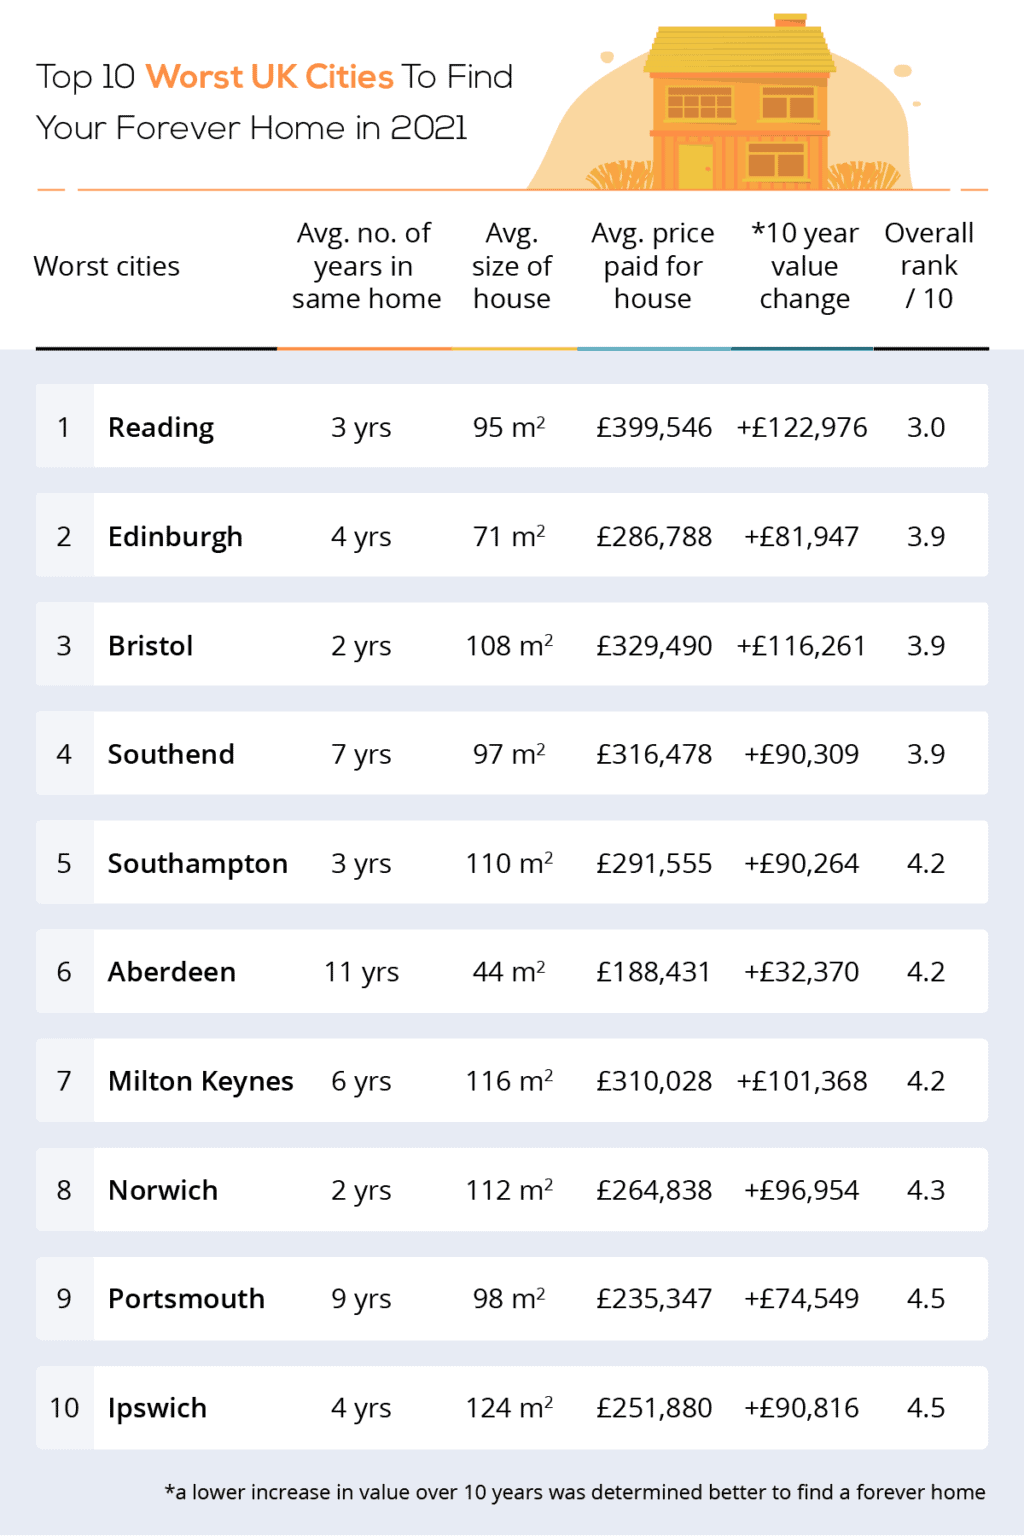
Reading has been revealed as the worst UK city to find a forever home. Owners will stay in their property for around 3 years, and the city comes in the bottom 10 for other factors such as percentage of schools rated good or outstanding, number of GP’s per 100,000 patients and recorded crime levels.
The cities where individuals are least likely to find their forever homes offer some of the smallest houses on average. Aberdeen homes have an average amount of space of just 44m2, however, they have a fairly cheap average house price of £188,431. The majority of houses bought in the 10 worst cities will be sold again in under four years.
Scotland does not fare well, with both Aberdeen and Edinburgh being in the bottom 10, the lack of high-quality secondary schools in the cities pay a large part of this. However, they do boast the highest rates of GP’s per 100,000 patients, with Aberdeen having 117 GP’s and Edinburgh 125. In contrast, the highest English city is Plymouth with 97 GP’s per 100,000 patients.
Take a look at the full ranking of UK cities here:
| City | Number of years owners stay in the home | Percentage of schools rated good or outstanding | No. of active GP’s per 100,000 patients | Recorded crime per 1,000 population | Price per square metre | Average price paid for house | Average size of house (m2) | Value change over 10 years | Overall Score |
| Swansea | 64 | 99 | 79 | 77.75 | £1,395.00 | £183,025 | 131 | £42,234 | 7.71 |
| Belfast | 9 | 84 | 78 | 124.39 | £1,731.60 | £136,436 | 79 | £32,750 | 7.17 |
| Cardiff | 63 | 91 | 70 | 98.36 | £2,161.00 | £248,767 | 115 | £78,264 | 6.64 |
| Newport | 49 | 87 | 93 | 120.22 | £1,474.00 | £180,562 | 122 | £58,635 | 6.63 |
| Sunderland | 39 | 85 | 55 | 104.84 | £1,163.00 | £143,027 | 123 | £35,271 | 6.49 |
| Liverpool | 17 | 81 | 76 | 117.79 | £1,245.00 | £173,533 | 139 | £51,008 | 6.37 |
| Preston | 7 | 90 | 59 | 81.87 | £1,370.00 | £183,950 | 134 | £49,563 | 6.02 |
| Plymouth | 12 | 77 | 97 | 85.19 | £1,789.00 | £209,873 | 117 | £59,074 | 5.92 |
| Stoke-on-Trent | 3 | 81 | 55 | 104.26 | £1,124.00 | £152,466 | 136 | £45,378 | 5.85 |
| Birmingham | 11 | 79 | 63 | 96.76 | £1,837.00 | £203,671 | 111 | £62,757 | 5.68 |
| Coventry | 13 | 89 | 58 | 74.23 | £1,833.00 | £216,249 | 118 | £69,999 | 5.67 |
| Bradford | 17 | 72 | 61 | 130.87 | £1,433.00 | £137,421 | 96 | £25,907 | 5.63 |
| Wolverhampton | 5 | 80 | 57 | 91.51 | £1,428.00 | £198,506 | 139 | £58,411 | 5.60 |
| Sheffield | 5 | 79 | 63 | 94.44 | £1,690.00 | £199,574 | 118 | £58,777 | 5.53 |
| Nottingham | 2 | 80 | 65 | 120.32 | £1,470.00 | £207,934 | 141 | £72,790 | 5.43 |
| Derby | 4 | 74 | 64 | 107.54 | £1,577.00 | £205,378 | 130 | £56,190 | 5.35 |
| Newcastle upon Tyne | 5 | 84 | 62 | 112.28 | £1,714.00 | £207,104 | 121 | £56,319 | 5.32 |
| Hull | 5 | 82 | 41 | 149.08 | £1,127.00 | £138,189 | 123 | £36,529 | 5.32 |
| Blackpool | 3 | 84 | 54 | 174.32 | £1,107.00 | £123,412 | 111 | £28,225 | 5.16 |
| Manchester | 10 | 87 | 64 | 159.38 | £1,941.00 | £200,069 | 103 | £65,858 | 5.13 |
| Leicester | 4 | 82 | 53 | 114.28 | £1,692.00 | £235,425 | 139 | £78,822 | 5.08 |
| Leeds | 5 | 79 | 60 | 123.36 | £1,920.00 | £216,737 | 113 | £67,582 | 4.98 |
| Northampton | 3 | 80 | 57 | 106.7 | £2,045.00 | £250,792 | 123 | £95,995 | 4.60 |
| Ipswich | 4 | 81 | 53 | 117.21 | £2,029.00 | £251,880 | 124 | £90,816 | 4.53 |
| Portsmouth | 9 | 88 | 41 | 112.52 | £2,400.00 | £235,347 | 98 | £74,549 | 4.45 |
| Norwich | 2 | 84 | 59 | 128.96 | £2,367.00 | £264,838 | 112 | £96,954 | 4.26 |
| Milton Keynes | 6 | 89 | 43 | 98.8 | £2,679.00 | £310,028 | 116 | £101,368 | 4.22 |
| Aberdeen | 11 | 33.4 | 117 | 116.25 | £4,265.98 | £188,431 | 44 | £32,370 | 4.18 |
| Southampton | 3 | 84 | 52 | 121.11 | £2,647.00 | £291,555 | 110 | £90,264 | 4.16 |
| Southend-On-Sea | 7 | 89 | 55 | 106.32 | £3,273.00 | £316,478 | 97 | £90,309 | 3.94 |
| Bristol | 2 | 77 | 59 | 108.04 | £3,039.00 | £329,490 | 108 | £116,261 | 3.92 |
| Edinburgh | 4 | 34.2 | 125 | 112 | £4,050.85 | £286,788 | 71 | £81,947 | 3.88 |
| Reading | 3 | 79 | 50 | 100.9 | £4,206.00 | £399,546 | 95 | £122,976 | 2.95 |
Tower Hamlets Is the Best London Borough to Find a Forever Home

Tower Hamlets, Hackney and Bromley are the London Boroughs property buyers are most likely to find their London forever home, making East London the most desirable location. Purchasing a house in one of these areas would, on average, set you back half a million pounds, with the average price for a home in Hackney being £675,434.
Bromley is also the London Borough that saw the most sales in 2020, with 1,737 properties changing hands in the twelve month period. This could be due to properties in Bromley being, on average, larger at 100m2 than any other Borough in the top 10.
The City of London Is the Worst London Borough to Find a Forever Home
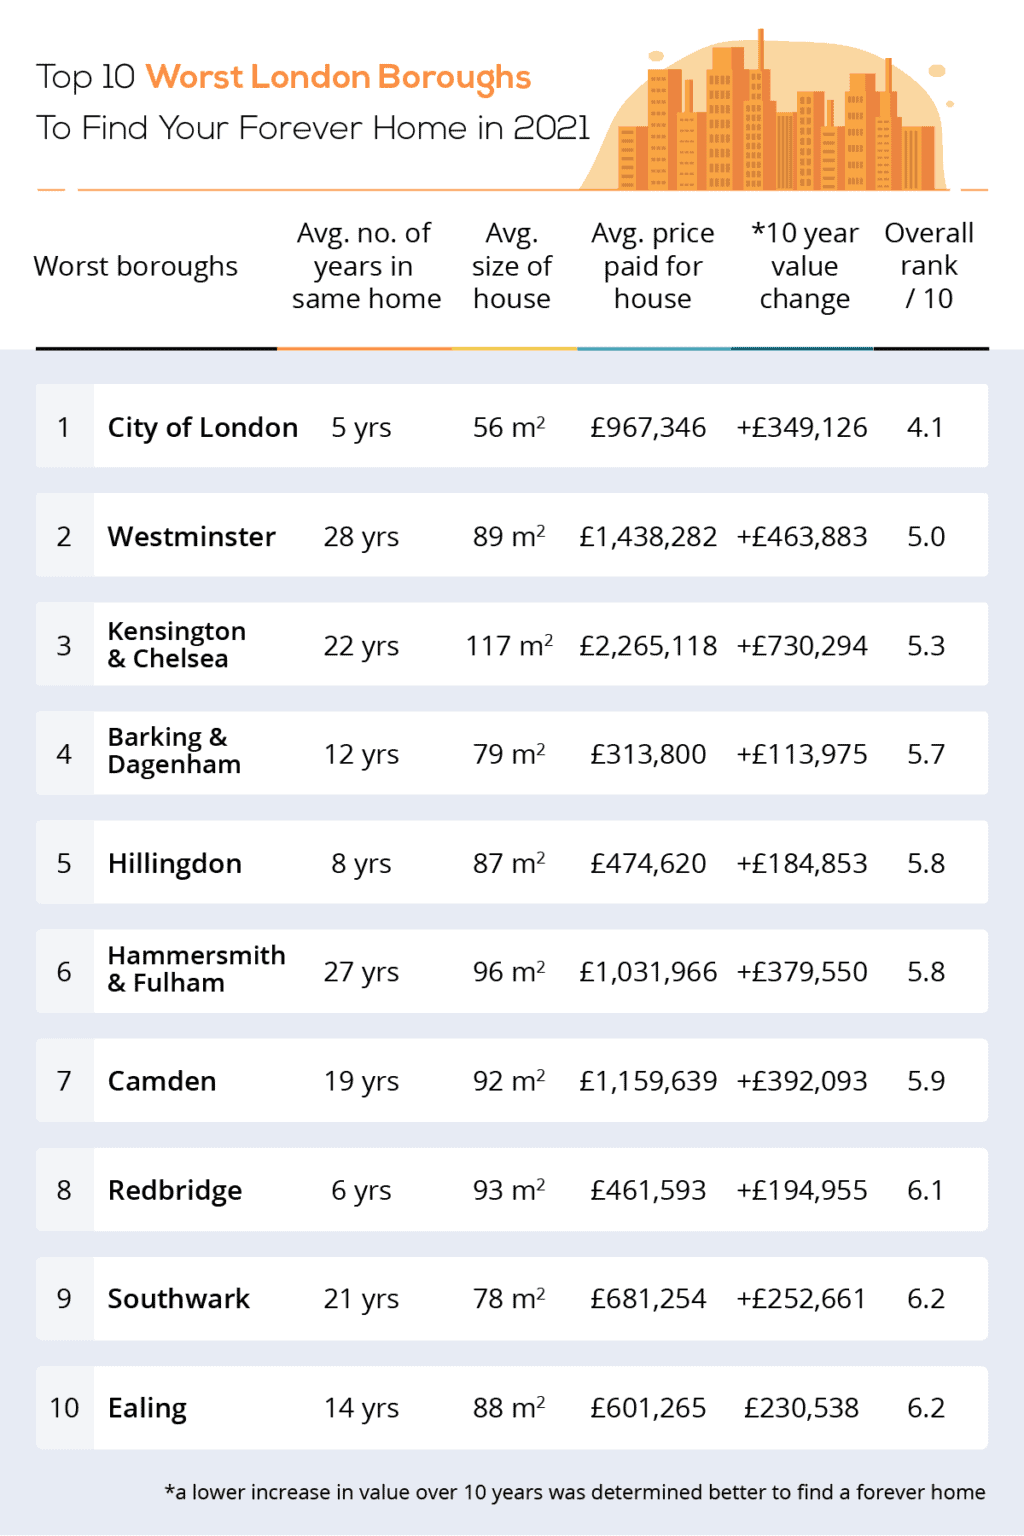
If you’ve always dreamt about living in The Royal Borough of Kensington and Chelsea, The City of London or Westminster, you may not have been dreaming about your forever home. Coming bottom in the overall rankings in London, these three boroughs have the highest crime rates, with there being 796.56 crimes per 1,000 population in The City.
Despite this, those looking for a good property investment should look at Kensington and Chelsea, with properties increasing by £730,294 on average. These Boroughs also boast the highest number of good or outstanding schools out of the entire study, with just 5% of schools in Westminster being below par.
Take a look at the full ranking of London boroughs here:
| Borough | Number of years owners stay in the home | Percentage of schools rated good or outstanding | No. of active GP’s per 100,000 patients | Recorded crime per 1,000 population | Price per square metre | Average price paid for house | Average size of house (m2) | Value change over 10 years | Overall Score |
| Tower Hamlets | 53 | 97 | 59 | 100.94 | £8,545 | £507,844 | 59 | £234,383 | 7.60 |
| Hackney | 49 | 93 | 65 | 112.24 | £8,564 | £675,434 | 79 | £253,065 | 7.42 |
| Bromley | 11 | 92 | 51 | 71.00 | £5,066 | £507,121 | 100 | £201,704 | 7.41 |
| Lewisham | 21 | 90 | 51 | 91.86 | £6,296 | £530,087 | 84 | £185,186 | 6.95 |
| Bexley | 13 | 89 | 51 | 67.60 | £4,223 | £396,596 | 94 | £141,878 | 6.91 |
| Greenwich | 19 | 94 | 51 | 95.46 | £5,434 | £499,175 | 92 | £184,248 | 6.87 |
| Haringey | 20 | 99 | 54 | 110.12 | £7,101 | £695,105 | 98 | £268,114 | 6.85 |
| Brent | 26 | 96 | 47 | 87.34 | £7,093 | £606,070 | 85 | £195,054 | 6.79 |
| Lambeth | 22 | 92 | 51 | 100.66 | £8,437 | £693,249 | 82 | £261,455 | 6.76 |
| Waltham Forest | 15 | 97 | 50 | 85.52 | £6,014 | £527,081 | 88 | £212,086 | 6.75 |
| Croydon | 9 | 82 | 56 | 87.79 | £4,653 | £434,425 | 93 | £161,302 | 6.72 |
| Islington | 23 | 99 | 54 | 115.91 | £9,730 | £870,077 | 89 | £290,055 | 6.68 |
| Sutton | 7 | 93 | 56 | 66.74 | £5,059 | £445,404 | 88 | £161,398 | 6.63 |
| Merton | 16 | 92 | 56 | 67.50 | £6,805 | £627,012 | 92 | £252,185 | 6.58 |
| Richmond upon Thames | 11 | 90 | 56 | 61.94 | £8,175 | £922,104 | 113 | £327,844 | 6.44 |
| Newham | 28 | 90 | 45 | 95.63 | £4,965 | £398,605 | 80 | £158,493 | 6.39 |
| Hounslow | 12 | 93 | 49 | 93.78 | £5,969 | £571,451 | 96 | £202,795 | 6.38 |
| Wandsworth | 8 | 92 | 56 | 75.98 | £9,661 | £834,567 | 86 | £307,862 | 6.35 |
| Barnet | 7 | 90 | 47 | 73.71 | £6,668 | £681,759 | 102 | £242,052 | 6.35 |
| Harrow | 7 | 95 | 50 | 65.18 | £5,768 | £546,041 | 95 | £200,709 | 6.31 |
| Kingston upon Thames | 4 | 94 | 56 | 68.51 | £6,352 | £591,362 | 93 | £217,201 | 6.31 |
| Havering | 3 | 83 | 48 | 67.83 | £4,185 | £395,605 | 95 | £147,977 | 6.25 |
| Enfield | 10 | 85 | 54 | 87.50 | £5,328 | £474,557 | 89 | £176,672 | 6.24 |
| Ealing | 14 | 90 | 48 | 87.63 | £6,814 | £601,265 | 88 | £230,538 | 6.22 |
| Southwark | 21 | 89 | 51 | 110.71 | £8,782 | £681,254 | 78 | £252,661 | 6.15 |
| Redbridge | 6 | 91 | 46 | 76.24 | £4,957 | £461,593 | 93 | £194,955 | 6.11 |
| Camden | 19 | 97 | 54 | 133.39 | £12,671 | £1,159,639 | 92 | £392,093 | 5.91 |
| Hammersmith and Fulham | 27 | 94 | 46 | 114.25 | £10,718 | £1,031,966 | 96 | £379,550 | 5.85 |
| Hillingdon | 8 | 86 | 43 | 85.38 | £5,430 | £474,620 | 87 | £184,853 | 5.81 |
| Barking and Dagenham | 12 | 88 | 41 | 91.08 | £3,994 | £313,800 | 79 | £113,975 | 5.70 |
| Kensington and Chelsea | 22 | 100 | 59 | 140.26 | £19,439 | £2,265,118 | 117 | £730,294 | 5.27 |
| Westminster | 28 | 95 | 44 | 257.74 | £16,246 | £1,438,282 | 89 | £463,883 | 4.99 |
| City of London | 5 | 100 | 65 | 796.56 | £17,371 | £967,346 | 56 | £349,126 | 4.11 |
Summary
Home-buyers are always on the lookout for their forever homes, even more so given the current circumstances with the majority of people spending their time working from home. However, it can be difficult to find the perfect property, with the average homeowners staying in a property for just 12 years outside London.
By considering the factors most important for you such as property size and price, as well as external factors such as quality of schools, health provision and crime rates, moving into your forever home could also allow you to release equity, helping to improve lifestyle and living choices.
Methodology
To find the best and worst cities to find your forever home in the UK and within London, we looked at the number of years owners stay in their home, percentages of schools rated good our outstanding, number of active GP’s per 100,000 patients, recorded crime per 1,000 population, average price paid for a house, average size of house and property value change over 10 years.
To find the length of time owners stayed in their home we divided the total private dwelling stock levels in 2019 by the total property sales of that year. The average size of a house was found by dividing the average price paid for a house by the average price per square metre.
Belfast statistics are for Northern Ireland as a whole. If city data was not available, regional data has been used. Scottish school data is out of 100 and was achieved by finding the average score out of the secondary schools in the city via this article. Welsh school data looks at the percentage of green and yellow colour coded schools in the city via WalesOnline articles listing – green schools, yellow schools, amber schools and red schools.
Sources:
- https://worldpopulationreview.com/countries/cities/united-kingdom
- https://www.gov.uk/government/statistical-data-sets/live-tables-on-dwelling-stock-including-vacants
- https://www.communities-ni.gov.uk/publications/northern-ireland-housing-statistics-2019-20
- https://statswales.gov.wales/Catalogue/Housing/Dwelling-Stock-Estimates/dwellingstockestimates-by-localauthority-tenure
- https://www.zoopla.co.uk/
- https://www.communities-ni.gov.uk/publications/northern-ireland-housing-statistics-2019-20
- https://www.gov.uk/government/statistics/state-funded-schools-inspections-and-outcomes-as-at-31-december-2018#history
- https://digital.nhs.uk/data-and-information/publications/statistical/general-and-personal-medical-services/30-september-2020-biannual-regional-and-joiners–leavers-tables
- https://www.isdscotland.org/Health-Topics/General-Practice/Publications/2018-12-11/2018-12-11-GPWorkforce2018-Report.pdf
- https://gov.wales/general-practice-workforce-30-june-2020
- https://www.health-ni.gov.uk/publications/northern-ireland-health-and-social-care-hsc-key-facts-workforce-bulletin-september-2020
- https://www.psni.police.uk/inside-psni/Statistics/police-recorded-crime-statistics
- https://www.gov.scot/publications/recorded-crime-scotland-2019-2020/
- Police.uk
- https://www.propertypriceadvice.co.uk/property-news/general-news/much-property-cost-per-square-metre-area
- https://www.numbeo.com/property-investment/
- https://www.finance-ni.gov.uk/sites/default/files/publications/dfp/lps-ni-hpi-press-notice-q3-2020.pdf
- https://www.thescottishsun.co.uk/news/4020266/scotland-secondary-schools-results-chart-worst-best-glasgow-edinburgh/
- https://www.walesonline.co.uk/news/education/colour-codes-schools-green-2020-17664013
- https://www.walesonline.co.uk/news/education/wales-school-colour-codes-2020-17665273
- https://www.walesonline.co.uk/news/education/wales-school-colour-codes-2020-17664769
- https://www.walesonline.co.uk/news/education/wales-school-colour-codes-2020-17664446


