Barac Capital Management commentary for the fourth quarter ended December 31, 2018.
Dear All,
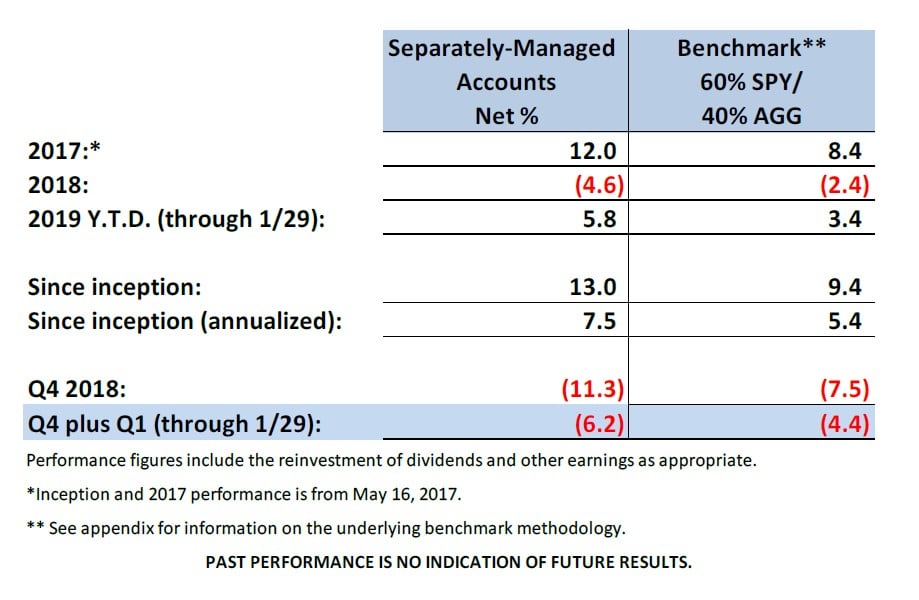
The aggregate performance of Barac Capital’s separately-managed-accounts (“SMAs”)1 for the year ending December 31, 2018 was negative 4.6% and the SMAs have subsequently returned 5.8% year-to-date in 2019 (through yesterday’s market close).

Q4 hedge fund letters, conference, scoops etc
Net annualized returns for the SMAs since inception (in May of 2017) through yesterday’s market close, amounted to 7.4%, versus a return of 5.4% for the benchmark2, resulting in 202 basis points of annualized outperformance.
Individual account performance may vary, depending on the timing factors and customized asset allocations. Please check your brokerage statements for the actual returns of your individual accounts.
Q4 and Partial Q1 ’19 Performance
From the beginning of Q4 through the most recent market close (on 1/29), returns amounted to negative 6.2% on a net basis (after fees), compared to negative 4.4% for the benchmark and negative 8.8% for the S&P 500 (including dividends).
A substantial holdings of Treasury bills (36% average weight) was by far the largest positive contributor for the period. As the equity markets have sold-off, the yields on 5-year Treasuries declined from 2.95% to 2.55% (with a commensurate increase in the value of these assets). This resulted in returns of over 2.5% for our Treasury holdings over the period.
The worst individual stock performers for the period (through yesterday’s market close) included Roku (-39%), Federal Express (-27%), and CVS Healthcare (-16%), Apple (-15%), and Goldman Sachs (-10%).
As always, it is important to re-state that returns were generated without leverage (either direct or effective leverage through options), without taking highly concentrated positions, and while conservatively holding substantial cash and/or Treasury bond positions.
Performance Commentary
Performance for the period was disappointing, particularly when considering that accounts were very well-positioned for the recent equity market downturn going into the quarter (with 45% of assets-under-management in either cash or U.S. Treasuries). In addition, the large Treasury position did exactly what it was supposed to do and appreciated in price during the equity sell-off (dampening the impact).
While this defensive positioning allowed accounts to meaningfully outperform the equity sub-component of the benchmark (with accounts down “only” 6.2% versus 8.8% for the S&P 500), they meaningfully underperformed the benchmark (which was down 4.4%). This was largely the result of the performance of some individual positions, which I will explain in more detail.
Roku has been (and is expected to continue to be) a very volatile stock and it AGAIN went from being a best to a worst performer (down 39% for the period). If I weren’t a huge skeptic of technical analysis, I might say that I’ve identified a predictable trading pattern for this stock (up 50%-ish, then back down 50%-ish, then back up, etc., etc.).
I’ve been adding and reducing exposure to Roku throughout this volatility, but not because of any trend analysis or changes in my fundamental belief in the company’s prospects. Rather, I believed that the risk/reward dynamics had changed considerably at these differing valuation levels and this required allocation/sizing to be adjusted appropriately.
That doesn’t mean that I’m day-trading the stock and moving in and out on a daily basis. In fact, I have only made adjustments after large valuation moves which have substantially changed the risk/reward dynamics and/or the relative position sizing for clients.
To be clear, just because a valuation substantially changes doesn’t mean that the risk/reward dynamics have necessarily changed commensurately. In fact, a stock can sell-off considerably and still have become less attractive (if the news driving the sell-off was even worse than the valuation change that resulted).
In the case of Roku, I believe that the drastic valuation changes were seldom driven by news-flow that justified the magnitude of the moves. Often it was just from market noise like analyst opinion changes (which should generally be generally viewed as irrelevant, in my opinion), overblown reactions to expected competitive developments, or what appeared to be just momentum (herd investor mentality).
So far, these interim adjustments have proven beneficial. Since I originally purchased shares in November of 2011, the stock is up 56% (with lots of volatility in between). The returns that the Roku position has generated for the SMA accounts, on the other hand, has been much greater (approximately 74%).
What has accounted for this difference is the fact that, throughout the volatility, I have sold down the stock at higher valuations and increased the position at lower valuations. I believe that this has also proved to be beneficial from a risk management and capital preservation perspective (as accounts have been less exposed when valuations were higher and downside potential had increased).
Anyway, the point of this example is not to be yet another annoying investment manager patting themselves on the back with a cherry-picked example of something that worked out well (and I promise I will balance this with an example of something that didn’t work out so well). Rather, the point is to illustrate how changing valuations can impact allocations and portfolio management for a fundamental value investor.
Three other big negative movers (Federal Express, Goldman Sachs, and CVS Healthcare) were situations where I felt that the sell-offs were disproportionately large relative to the news that drove them. While that analysis is beyond the scope of this letter, the result was that I added exposure (at lower prices) to all three of these stocks.
My conclusions with regard Apple were different. I had bought shares in November, after the stock had already fallen considerably (to levels where I saw good value). Apple subsequently (on January 2nd) issued a revenue warning that surprised me and the market and caused the shares to sell-off considerably further.
In this particular instance, for a number of reasons, I felt that the implications from the news were even worse than the resulting share price move. As a result, I sold out of the position at a loss. Apple remains an amazing company with incredible products and sticky clients, but at its current valuation I simply believe that the long-term risks outweighs the upside potential.
Outlook and Positioning
At the peak of the December sell-off, domestic stocks3 had fallen about 20% from their highs and I believe that this provided some good buy opportunities for individual names. While the market remains about 10% off the highs4, I still remain generally cautious with regard to “risk assets” (stocks and corporate bonds) and this continues to be more a result of market risk factors rather than concerns with respect to current equity valuation multiples. .
As I explained in the last quarterly letter and will repeat, again:
“What continues to concern me is the earnings part of the price/earnings equation and the increasing risk that some of the contributors to current (high) profit margins could come under pressure. Earnings’ levels continue to reflect low interest rates (and low credit spreads), low wage growth, and the positive wealth effect of 8 years of rising stock prices and home values.
As we approach full employment and some of the government’s pro-growth policies come into effect, there is a heightened risk of wage pressure and increased interest rates with increased inflation. Furthermore, current valuations appear to incorporate little with respect to geo-political risks at a time when there is much political change and uncertainty. It also warrants keeping in mind that if/when the business cycle does turn (and assets prices fall), a resulting “reverse wealth effect” could exacerbate the impact of a cyclical downturn.”
For all of these reasons, SMA accounts remain more defensively positioned than the benchmark (which, itself, reflects a conservative asset allocation). This is reflected in the fact that 46% of the SMA assets are either in cash or U.S. Treasuries with maturities less than 5 years. Accounts also remain well diversified, with no single-stock position accounting for more than 5.5% of AUM. As always, risk management and capital preservation remain paramount to the investment strategy.
Administrative Note
From a very small base, I am very thankful and pleased that the SMA offering has continued to grow strongly since it was first offered in 2017 -- with firm assets more than tripling (to just over $5.5mn in AUM) and individual account numbers growing to 21 during that time period. While still a very small number of accounts (and assets), compared to what many advisers manage, I do plan to keep the account number quite low (in order to be able to dedicate sufficient time to each individual client).
The administrative time requirements of going from one account (the Fund) to 21 individual accounts has been considerable. While there are broad themes and similarities across all accounts, they are still each individually customized (for both individual risk tolerances and tax efficiency). As such, each trade allocation is individually calculated (taking into consideration those factors).
In light of these factors and in order to keep account numbers manageable -- while maintaining a low fee structure and striving to achieve reasonable AUM scale -- I have decided to increase the minimum account size for new clients from $95k to $250k. Again, this is only for new clients and even then, exceptions to the minimum will always be considered (based on individual circumstances).
Thank you to everyone for your interest and support and please let me know if there are any questions you may have that I haven’t answered.
Sincerely,
Ted Barac
Managing Member of Barac Capital Management, LLC
This article first appeared on ValueWalk Premium


