This Report was generated using the tools available on StockCalc.com. Patchell Brook Equity Analytics Inc. emphasizes that the user assumes all risks associated with the use of this report or the Stockcalc website including, but not limited to, all terms and conditions mentioned in the legal disclaimer. To access all of the tools on Stockcalc, including more detailed valuation reports and the models used to generate these valuations, please subscribe for a free 30 day trial of Stockcalc here.

Q1 hedge fund letters, conference, scoops etc, Also read Lear Capital: Financial Products You Should Avoid?
Valuation Summary:
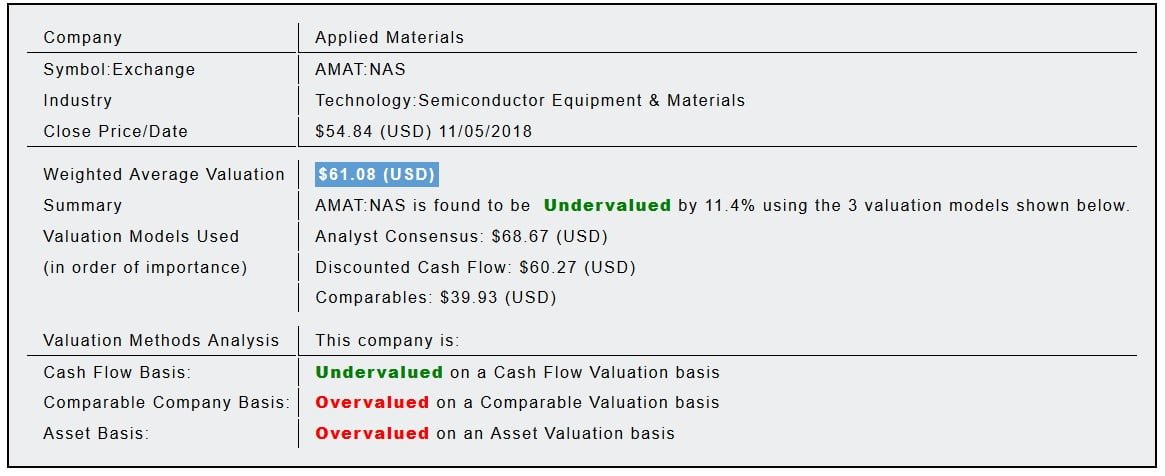
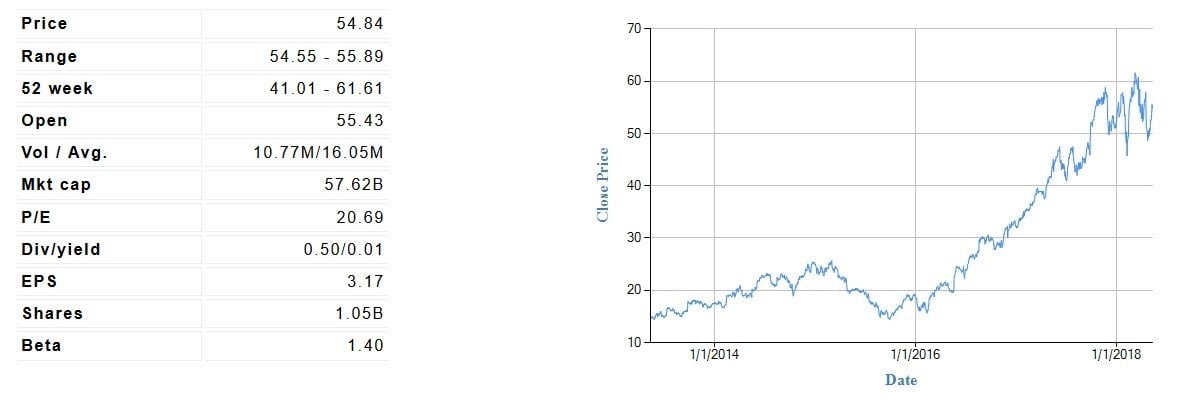
Applied Materials $54.84 (USD) Close Price as of 11/05/2018
Based on the analysis conducted in this report, Applied Materials, (AMAT:NAS) is found to be Undervalued.
Valuation Details
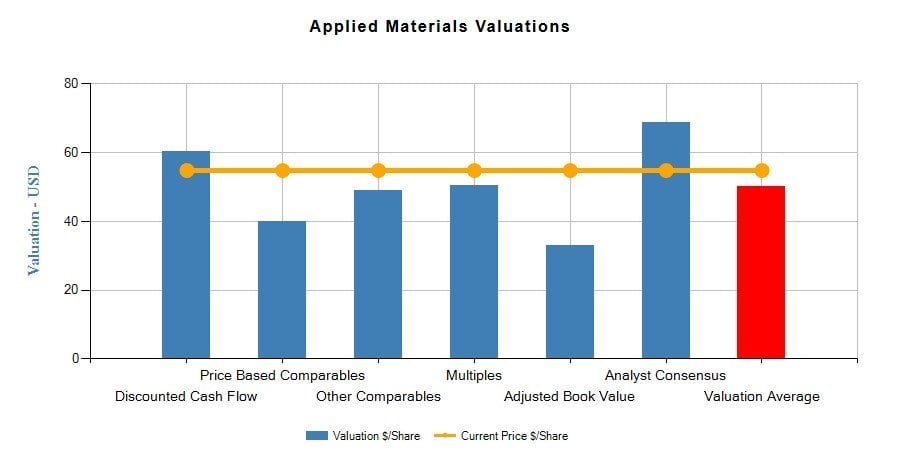
We have up to 6 valuation points for each company. Details are at the bottom of the report.
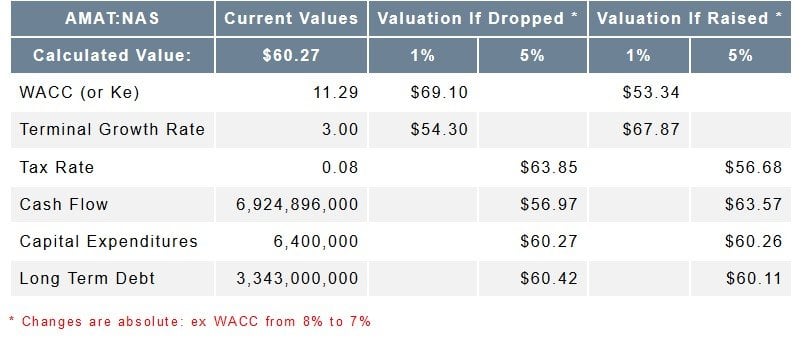
Discounted Cash Flow and Sensitivity Analysis for AMAT:NAS
Using a discounted cash flow model we generated an intrinsic value of $60.27 (USD) for AMAT:NAS
Sensitivity Analysis
(showing how changes in the input variables impact the DCF calculation)
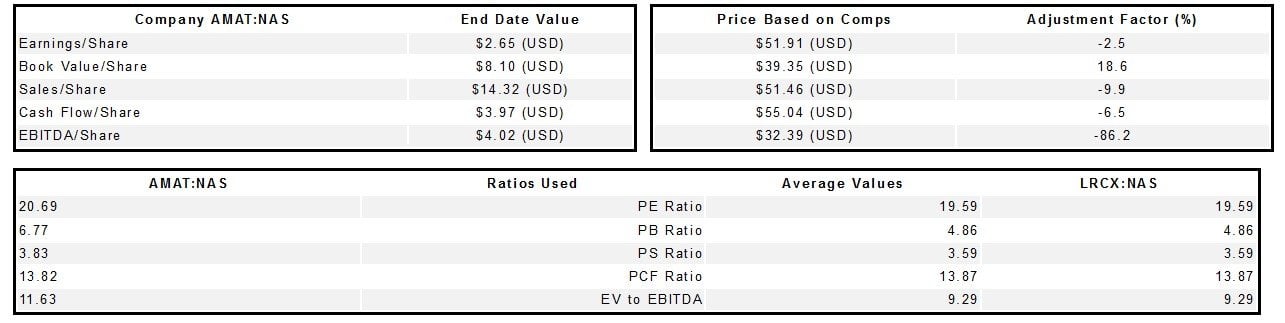
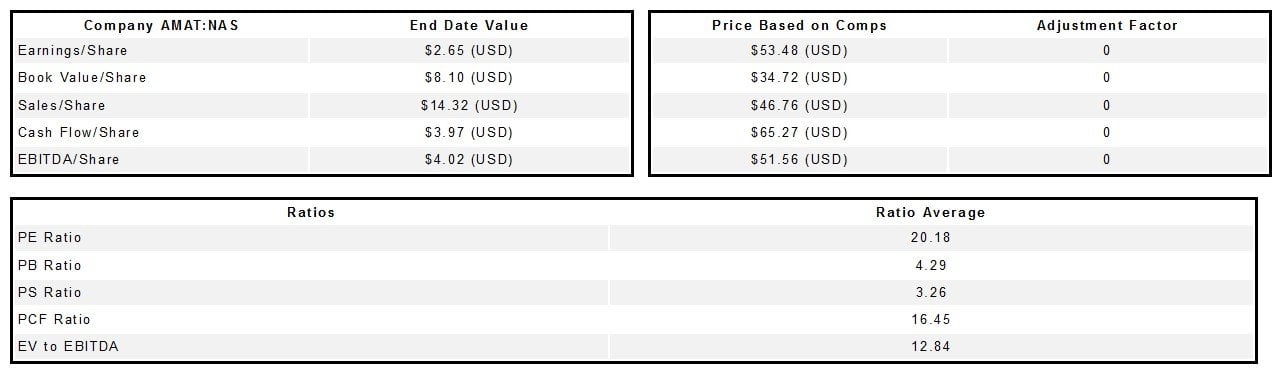
Comparables Model
Using similar companies and price based ratios we generated a valuation of $39.93 (USD) for Applied Materials, Inc. (AMAT). We also generated a valuation of $49.03 (USD) using other metrics and comparables. The comparable companies were 0C00000812 (LRCX:NAS)
Multiples
Using a multiples approach we generated a valuation of $50.36 (USD) for AMAT:NAS
Adjusted Book Value versus Historical Price to Book
The average the Price to Book ratio for AMAT:NAS for the last 10 years was 4.10
We ran the Adjusted Book Value for AMAT:NAS and generated a book value of $8.02 (USD) By multiplying these we get an adjusted valuation of $32.88 (USD)
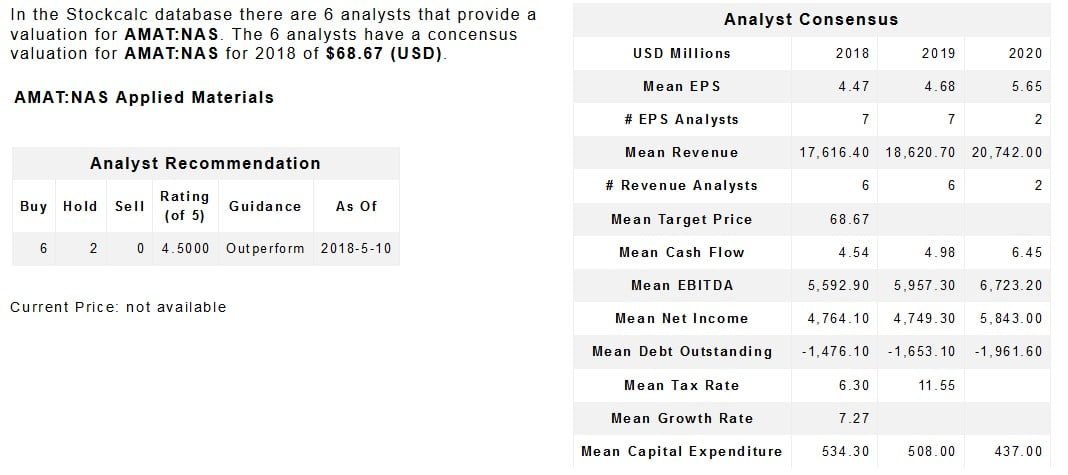
Analyst Data
Company Overview (AMAT:NAS USD)
Detailed Company Description
Applied Materials Inc is a supplier of semiconductor manufacturing equipment. It provides manufacturing equipment, services and software to the semiconductor, flat panel display, solar photovoltaic and related industries.
Explanation of Valuation Models
We have up to 6 valuation points for each company in the database.
The Discounted Cash Flow (DCF) valuation is a cash flow model where cash flow projections are discounted back to the present to calculate value per share. DCF is a common valuation technique especially for companies undergoing irregular cash flows such as resource companies (mining, forestry, oil and gas) going though price cycles or smaller companies about to generate cash flow (junior exploration companies, junior pharma, technology firms…).
The Price Comparables valuation is the result of valuing the company we are looking at on the basis of ratios from selected comparable companies: Price to Earnings, Price to Book, Price to Sales, Price to Cash Flow, Enterprise Value (EV) to EBITDA. Each of these ratios for the selected comparable companies are averaged and multiplied by the values for the company we are interested in to calculate a value per share for our selected company.
We have included the Other Comparables as a way to value companies that cannot be valued using Earnings based ratios. This technique is very useful for companies still experiencing negative cash flows such as mining exploration firms. We use Cash/Share, Book Value/Share, MarketCap, 1 Year Return, NetPPE as the ratios here. Each of these ratios for the selected comparable companies are averaged and multiplied by the values for the company we are interested in to calculate a value per share for our selected company.
Multiples are similar to Price comparables where we look at current or historic ratios for the company in question to assess what it should be worth today based on those historic ratios. We use the same 5 ratios as in the price comparables and value the company with its historic averages.
With Adjusted Book Value (ABV) we calculate the book value per share for the company based on its balance sheet and multiply that book value per share by its historical price to book ratio to calculate a value per share.
If we have Analyst coverage for the company we use the consensus target price here.