Global Return Asset Management commentary for the year ended December 31, 2017.

Dear Friends,
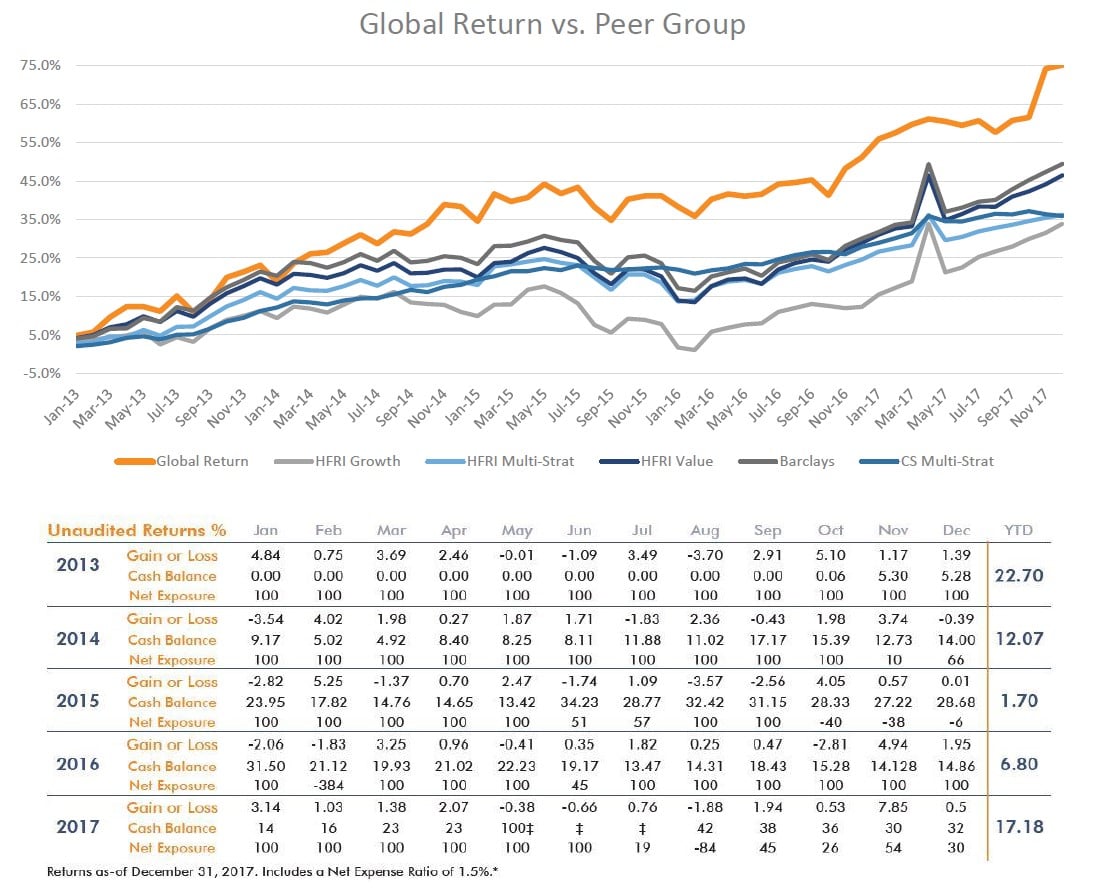
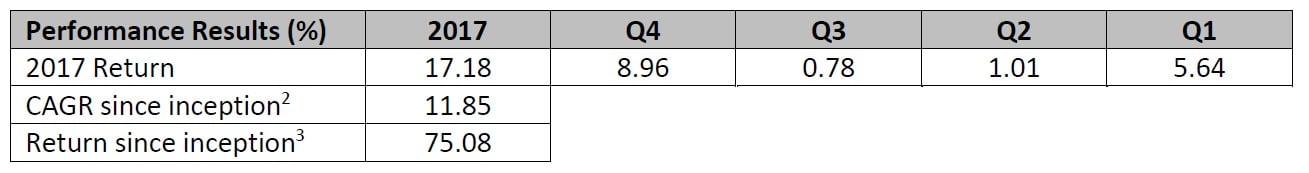
In 2017, Global Return generated a net return of 17.2%. We ended the year with 30% of assets in Cash and had a net market exposure of 30%.1 On page 2 is a graph outlining our returns vs. our peers.
2017 marks Global Return’s 5-Year Anniversary, so I’m using this milestone to layout the framework that differentiates Global Return. In the attached letter, I describe nine features of my Risk Management Strategy and the Competitive Advantages that flow them. I’ve included a Table of Contents below with links for direct access to each feature.
Please contact me with any questions or to discuss my risk management strategy.
Respectfully,
Elliot Trexler
INTRODUCTION: RISK MANAGEMENT
Risk Management is the core of my investing: how I research a company, analyze its financials, buy and sell its stock – everything – begins with Risk Management.
Why does Risk Management dominate how I invest?
Because the goal of investing is to, “Generate the greatest return possible with the least amount of risk.”
This implies only three factors exist in investing:
1. Capital invested
2. Risk incurred
3. Return generated
In other words, people invest capital and receive risk (in the form of stock) because they believe it will generate a return. Therefore, investing is the act of buying risk and it’s risk that generates a return. Importantly, knowing how to identify and analyze risk enables successful investing across time and industry.
I never understood why our industry views investment analysis and risk analysis separately. Security analysis must begin with identifying risk because each security possesses risk and risk is the source of returns. Therefore, above all else, successful investing comes from successful risk management. The purpose of my Risk Management Strategy is simple:
1. Identify and quantify known risks within an investment
2. Determine whether the potential return compensates for this risk4
3. Consider how unknown risk could emerge and impact the value of the investment
4. Have policies and procedures to respond to existing, potential and unforeseen risks
The goal of my Risk Management Strategy is to eliminate prospective investments that possess uncompensated risk. Ideally, the remaining investments create a portfolio possessing the greatest return possible with the least amount of risk.
Definition of Risk
Risk is the probability of an impairment to the corpus,5 such-that if an impairment occurs, additional investments6 will not restore the corpus back to its original purchasing power.7
Sources of Risk
See my 2016 Year in Review letter where I introduce and describe Risk Variables.
Characteristics of Risk
Risk is amorphic, idiosyncratic and subjective. It exists in countless different forms and grows or diminishes in severity as its ecosystem evolves. Risk is mostly latent but ignites when exogenous factors collide and reduce the asset’s value.
Managing Risk
1. Purchase price
2. Size of position as a function of risk contribution to the portfolio
3. Understanding our temperament and emotional triggers
4. And most difficult, identifying and understanding a security’s actual and potential sources of risk8
RISK MANAGEMENT STRATEGY #1: ELIMINATE UNACCEPTABLE RISK
In 2014, I began researching sectors that would be impacted by infrastructure investments. I read whitepapers published by industry associations, government agencies, consultants, and sell-side analysts. I also attended webinars and conferences on all-things infrastructure. With this information, I identified industries with the characteristics I seek.9
Next, I began evaluating each industry’s constituents. But because I view investing as the act of purchasing risk, I didn’t look for reasons why companies could increase in value. Instead, I first identified each company’s risk and then eliminated the ones with unacceptable risk.
There are two advantages to my approach.
The first is related to human psychology and perception. Since the landmark publication in 1974 by Amos Tversky and Daniel Kahneman, study-after-study has proven that people are prone to the Anchoring Bias. Tversky and Kahneman’s findings state, “…people rely on a limited number of heuristic principles which reduce the complex tasks of assessing probabilities and predicting values to simpler judgmental operations.”10
Essentially, the Anchoring Bias states that when investing: Investors will form an opinion about a prospective investment that heavily relies on (i.e. is anchored to) the first piece of data received, even if that data is completely inaccurate.11
For example, assume I evaluate a company and find two reasons why its stock might increase 10%. Next, I evaluate its risk and find five reasons indicating a high probability the stock will decline 20%. The Anchoring Bias states that because I first identified reasons the stock will increase, there’s a low probability I’ll find reasons why the stock might decline. Worse, even if I find reasons the stock might decline, my mind will push these aside and convince itself that, “My detailed and thorough analysis of the company indicates its stock will increase 10%.”
Therefore, by first eliminating companies with unacceptable risk, I’m reducing the chances I don’t identify risks in prospective investments. This gives me better odds of finding low-risk, high-reward opportunities.
The second competitive advantage of my approach is that it saves a phenomenal amount of time. Identifying uncompensated risk requires a fraction of the time needed to value a company. The time saved allows me to review more prospective investments; again, creating higher odds of finding superior investments.
RISK MANAGEMENT #2: IDENTIFY OPERATING ASSETS & VALUE DRIVERS
A pillar of risk management is investing in companies with durable Operating Assets.12 The importance of this can’t be overstated – a company’s revenue and cash flow, and thus shareholder returns, flow directly from its Operating Assets.
For instances, one of our holding’s is the country’s largest manufacturer and distributor of shell eggs. Several of its Operating Assets include:
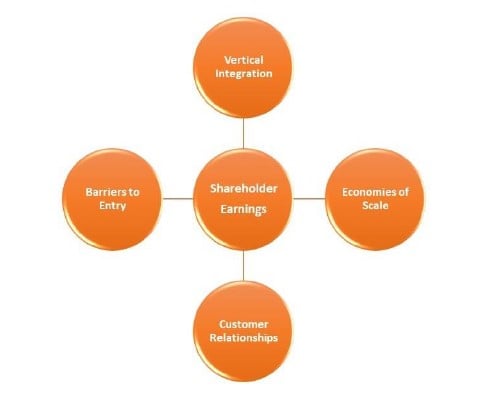
1. Vertical integration. Feed for chickens is the company’s biggest operating expense. Not only does our company manufacture its feed, it has capacity to manufacture 746 tons of feed per hour.
2. Economies of Scale. Our company processes and distributes about 1 billion eggs per week. Competing would require enormous up-front investments, and customers aren’t guaranteed.
3. Customer Relationships. Eggs are consistently among the top five items bought in a grocery store. Meaning, grocers heavily rely on their suppliers and rarely change them.
4. Barriers to Entry. Software, technology and mobile apps can’t replace how eggs are produced or distributed. Additionally, imports can’t replace U.S. produced eggs because of food safety regulation and, of-course, problems with distribution. (Hint: they’re eggs!)
You can see that this company has Operating Assets that will generate increasing amounts of revenue, cash flow and shareholder returns for years to come. But identifying a company’s Operating Assets is half the task, I then determine whether the company has Value Drivers.
Think of Operating Assets as the engine and Value Drivers as the gas. For example, Netflix owns video content (its Operating Asset) but unless customers subscribe to Netflix (the Value Driver), its content is worthless. It’s the combination Operating Assets and Value Drives that increase a company’s value, which happens from:
1. Sales growth
2. Margin expansion
3. Share buybacks
4. Acquisitions
Importantly, these aren’t the company’s Operating Assets or Value Drivers, they’re the result of its Operating Assets and Value Drivers. Effective risk management requires determining whether these results are sustainable.
For example, sales growth can occur because of:
1. Price reductions
2. Price increases
3. Lax customer financing
4. New products or services
5. Net new customer additions
6. Existing customers buying more
Some of these causes aren’t sustainable nor will they increase the durability of a company’s Operating Assets, so they’re not Value Drivers. Others could be Value Drivers, but more research is required. Identifying a company’s Operating Assets and Value Drivers enables me to assess the riskiness of the company’s current valuation. For example, a company’s financials might report excellent growth, but if its Operating Assets or Value Drivers are deteriorating, the company’s valuation is at risk of declining and causing losses.
Referring back to Netflix, imagine quarterly revenue grew because of “net new customer additions.” But, these new customers agreed to a “One Time Only” promotional price 90% below standard rates and their contracts expire in 90-days. These new customers aren’t a Value Driver and whatever “value” their short-term growth brings shouldn’t be included in the company’s valuation.13
Similarly, understanding Operating Assets and Value Drivers ensures more accurate valuations. If, for example, an analyst only uses financial data to project a company’s valuation, yet the company’s Value Drivers are improving, he might under-estimate the company’s future value.
RISK MANAGEMENT STRATEGY #3: DATA GATHERING PROCESS
How can the process of gathering data provide risk management?
On Wall Street and around the world, investment terminals and data aggregators have revolutionized every aspect of the investment industry. Most of all, these providers have changed how investment research is accessed and analyzed. And this has created unexpected risks for end-users.
One consequence of data aggregators is how investment analysis is now conducted. Due to the volume of information distributed, the buy-side analyst’s role has subtly shifted away from conducting independent and thorough research and towards “information collector” of other people’s research. At first glance this may not seem risky, but let’s look at the effects.
Most people agree the difference between high-quality and low-quality data is “usefulness.”14 But I take this further. Data’s “usefulness” should also be evaluated on whether it’s from a primary source or a secondary source. For example, much of the information distributed by aggregators is from secondary sources, which creates risks for end-users. Namely, the information has been re-interpreted and is subject to biases and motivation. For instance, do you remember the “Telephone Game” we played as children? The last person repeated the first person’s statement, which got completely transformed as it went from one person to the next. Countless studies have proven this same garbling still happens. Secondary sources aren’t doing this maliciously, it’s human nature, but it increases the odds that inaccurate data is used to make investment decisions.
Additionally, the volume of data being distributed is not only dizzying but can lack differentiation (consensus estimates, for example). As a result, it can be difficult to separate high-quality data from everything else; again, increasing the odds low-quality data is used to make investment decisions. Finally, studies have shown that having more data can confuse people and lead to decision paralysis. An unfortunate consequence is that investment decisions become based on “consensus estimates.”15 My data gathering process is designed to minimize these risks.
When gathering data about a company, I mostly rely on its primary sources. These sources include, the company’s and its competitors’ S.E.C. filings, earnings calls transcripts and investor relations presentations. Among these sources, I prefer the 10-K’s and 10-Q’s because they discuss (or not) the company’s Operating Assets and Value Drivers. Next, I gather research from industry associations, publications, and government or oversight agencies.16 More often, the data from these sources is used to validate information found in company filings.
I also use Philip Fisher’s method of “scuttlebutt.” This includes calling vendors and suppliers, going to stores as a mystery shopper, and speaking with employees. When using scuttlebutt, my goal is not to uncover specific information about, for example, next quarter’s earnings. What I’m interested in learning is how the company operates, how management thinks and what’s the company’s reputation in the market.
As an example, one of our holdings is the country’s largest manufacturer of residential and commercial water heaters. Before investing, I called local installers and asked open-ended questions about water heater manufacturers. I also went to several Lowe’s and Home Depot stores and shopped for water heaters.
Scuttlebutt offers innumerable competitive advantages. Specifically, I’m able to have direct conversations with market participants who work daily with the subject company and its competitors; and their motivations and biases are clear. The key to making scuttlebutt valuable is preparing for the conversation by knowing what specific questions to ask and when to ask them.17
The competitive advantages of gathering data directly from primary sources are abundant. Relying on primary sources removes the unnecessary risks listed above and ensures I’m conducting independent and thorough analysis. Importantly, because I’ve already identified the company’s Operating Assets and Value Drivers, I know exactly what I’m looking for when gathering primary sources data; this enables me to quickly validate, invalidate, or develop my thesis. In other words, I’m not prone to relying on secondary sources and can minimize the odds of drowning in unnecessary data or using low-quality data in my analysis.
See the full PDF below.


