
Stanphyl Capital’s commentary for the month of October 2020, discussing that markets have a disinflationary no-stimulus chasm.

Q3 2020 hedge fund letters, conferences and more
Friends and Fellow Investors:
For October 2020 the fund was up 2.9% net of all fees and expenses. By way of comparison, the S&P 500 was down 2.7% while the Russell 2000 was up 2.1%. Year-to-date 2020 the fund is down 17.7% while the S&P 500 is up 2.8% and the Russell 2000 is down 6.8%. Since inception on June 1, 2011 the fund is up 23.0% net while the S&P 500 is up 195.4% and the Russell 2000 is up 106.7%. Since inception the fund has compounded at 2.5% net annually vs 12.2% for the S&P 500 and 8.0% for the Russell 2000. (The S&P and Russell performances are based on their “Total Returns” indices which include reinvested dividends. The fund’s performance results are approximate; investors will receive exact figures from the outside administrator within a week or two. Please note that individual partners’ returns will vary in accordance with their high-water marks.)
We were up a little in October because our shorts went down a bit more than our longs did. I’m well aware that we have a deep performance hole to exit and I’ll do my best to keep climbing out of it.
Markets Have A Disinflationary No-Stimulus Chasm
Markets have a "disinflationary no-stimulus chasm" to cross between now and the next stimulus, and that combined with resurging COVID is likely to continue pressuring stocks and gold. Once more stimulus occurs I expect both will rally a bit (likely from lower levels than today’s), but by later in 2021 I believe the Fed’s endless money-printing combined with massive deficit spending and growth-retarding levels of debt will return us to an environment similar to the stagflationary 1970s; i.e., slow growth and increasing inflation (which we began to see after the last stimulus in both core CPI and core PPI), and when that happens high-flying stocks (such as the NASDAQ 100 that we’re short via QQQ) will suffer massive PE multiple compression and gold (which we’re long) will do extremely well. Have a look at what happened to S&P 500 PE ratios beginning in 1974 when inflation took off:
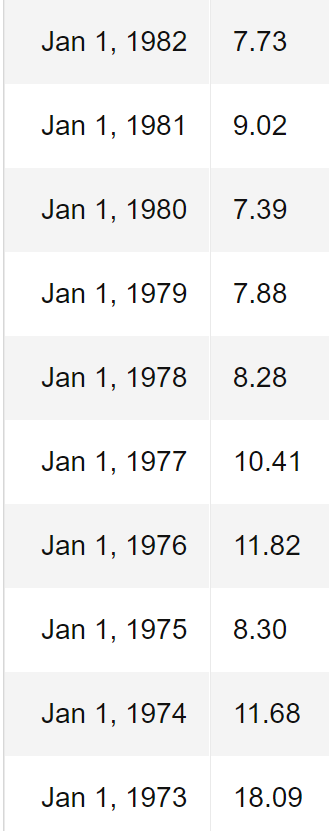
As a point of reference, the current TTM GAAP PE ratio on both the NASDAQ 100 and S&P 500 is approximately 37! As I don’t expect near-term inflation to hit the double-digits of the 1970s, I don’t expect we’ll see similar single-digit index PEs, but even a cut from 37x to 20x would mean a massive drop in stock prices, even if inflation makes the “E” nominally higher.
Portfolio Holdings
Here then are the fund’s current positions, beginning with the longs; please note that we may add to or reduce position sizes as stocks approach or recede from our target prices…
We continue to own Aviat Networks, Inc. (ticker: AVNW), a designer and manufacturer of point-to-point microwave systems for telecom companies, which in August reported a solid Q4 for FY 2020, with COVID-affected revenue down slightly vs. the year-ago quarter but earnings, EBITDA and backlog up substantially, with management guiding to meaningful growth on both the top and bottom lines for FY 2021 (which began in July). Last January Aviat’s board (controlled by activist investor Warren Lichtenstein) appointed a new CEO and the accompanying press release made it quite clear (based on his experience) that he was brought in to dress up the company and get it sold. Meanwhile, Aviat’s closest pure-play competitor Ceragon (CRNT) sells at an EV of approximately 0.65x revenue. If we assume $240 million in annual revenue for Aviat, $33 million of net cash and a (very conservative) $10 million valuation on a combination of $404 million of U.S. NOLs, $8 million of U.S. tax credit carryforwards, $189 million of foreign NOLs and $2.6 million of foreign tax credit carryforwards, we get a current fair market valuation of 0.65 x $240 million = $180 million + $33 million net cash + $10 million for the NOLs = $223 million divided by 5.4 million shares = $37/share. A 20% “control premium” to that (in the case of a buyout) would put the price at $44.
We continue to own Data I/O Corporation (DAIO), a manufacturer of semiconductor programming devices, which in October reported a solid Q3 2020, with revenue of $5.9 million that was up 55% (!) from the cyclically low year-ago quarter and 25% (!) sequentially, with a 55% gross margin, a GAAP loss of less than $200,000 excluding a one-time Chinese dividend withholding tax and a foreign currency transaction loss, and $13 million in cash with no debt. This company is a great play on the increasing electronic content in cars—particularly hybrids and EVs—and a great buy-out target. An EV of 2x $30 million in average annual revenue would put the stock at around $8.70/share.
We continue to own Amtech Systems, Inc. (ASYS), a manufacturer of semiconductor production and automation systems, which in August reported a breakeven Q2 that was down (revenue-wise) 28% year-over-year (due to COVID) and roughly flat with Q1. Disappointingly, the company guided to no revenue improvement in Q3 and a decline in earnings. Nevertheless, this is a mid-30% gross margin company that does around $80 million a year in normalized (ex-COVID) revenue with around $4 million/year in operating income (again, ex-COVID), and has around $39 million in net cash and over $80 million in NOLs. If we subtract $1 million from Amtech’s cash to account for two more quarters of “COVID hit,” then value the company at 1x normalized revenue with $8 million for the NOLs, we get fair value of around $9/share. The biggest risk here (other than underestimating “the COVID effect”) is that management—which *is* acquisitive—blows that cash pile on something stupid.
We continue to own Evolving Systems, Inc. (EVOL), a small telecom services marketing company that in August reported a solid Q2 (considering the COVID situation), with revenue up a tiny bit vs. both year-over-year and the previous quarter. EVOL generates over $1 million/year in free cash flow on $25 million of 65% gross margin revenue and would make a great buy for a strategic acquirer, as $1.5 million/year in savings from eliminating the C-suite and cost of being a standalone public company would mean around $2.5 million/year in free cash flow. Thus, at an acquisition price of just $2.25/share (which is a 100% premium to the current price) a buyer would be paying only around 10x free cash flow and 1x revenue (inclusive of .25/share in net cash).
We continue to own Communications Systems, Inc. (ticker: JCS), an IOT (“Internet of Things”) and internet connectivity & services company, which in October reported Q3 revenue up a very nice 26% from COVID-affected Q2, albeit still down 11% from Q3 2019 (a quarter that was juiced by an extremely large one-time contract). Impressively, JCS shifted from recent large losses to a slight net profit, while gross margin was a very decent 43%. With $21 million of cash and no debt, an enterprise value of 1x run-rate revenue for JCS would value it at over $7/share; the only reason I don’t own more is that management is acquisition-minded, which I read as “potentially blowing a beautiful balance sheet on something stupid.”
Finally on the long side, as central banks increase their money-printing to ever higher levels in order to fund multi-trillion-dollar annual deficits, we continue to hold a substantial long position in the gold ETF (GLD) and, since late-October, a small position in the silver ETF (SLV); the likelihood of negative real interest rates for years to come adds a substantial tailwind to these positions, while silver is also a major component in the solar cells a Biden administration is expected to heavily subsidize.


