As we are staring down the potential second wave of coronavirus, governments are taking different approaches. Most are enforcing masks/social distancing while keeping businesses open while others are selectively shutting down areas with clusters. In order to identify the best approach, we think it’s best to understand what’s been at risk. In other words how many lives are we saving vs. how many we are losing.

Q2 2020 hedge fund letters, conferences and more
Saving Lives vs Mortility Rate
Aggregating mortality stats takes years and the most recent, most robust samples, are from 2017 and that is what we are using as our baseline. Constructing 2020 stats takes Malcolm Gladwell-esque data manipulative wizardry but we try to be as objective as possible. Many of the stats we use are from articles and medical papers that may or may not have been peer reviewed. In other words, each assumption we make should be scrutinized.
Below is a table of top ten causes of death in 2017 and 2020 projections that we will go through line by line:
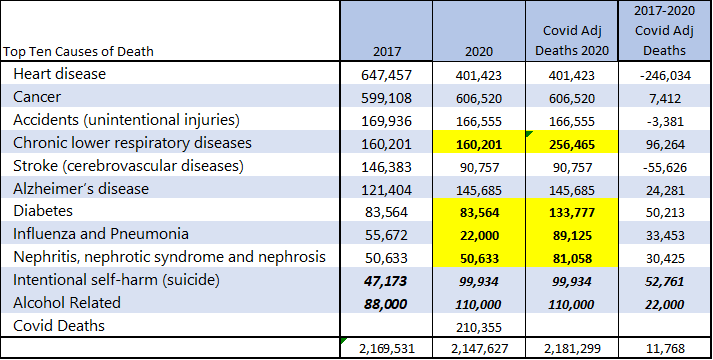
Sources outlined below
- Heart disease - the article states, “…One recent paper showed that hospital admissions for one type of serious heart attack fell by 38% in nine major U.S. hospitals in March. Heart disease is the leading cause of death in the United States.” Therefore we took 62% of the 2017 figure.
- Cancer-CDC estimates have a slight increase in cancer related deaths YoY
- Accidents (Car and Driver) recently published an article that stated car accident deaths are slightly lower YoY
- Chronic lower respiratory diseases/diabetes/Influenza&pneumonia/Nephritis, nephrotic syndrome & nephrosis-we stripped out influenza since that figure is provided by the CDC. It is well documented that all of the other causes of death can be associated with Covid. We weighted each category and then multiplied that by Covid related deaths and added that figure to 2017 to come up with a rough estimate.
- Stroke death estimate comes from the same article as our estimate for heart disease
- Alzheimer’s deaths are reportedly higher based on an article in ‘beingpatient.com’
- Suicide figures are hard to come by even though it seems job losses and pressures could increase the rate. Data aggregation here is more sensitive (see the recent Economist article on it). However, using a survey from 2017 we see that 9.3mm people seriously considered suicide with 41,149 committing suicide. A recent survey revealed that 10.8% of respondents considered suicide in 2020 and, adjusting for the adult population, that is 22.6m people. Assuming .44% of those individuals commit suicide we get 99.9k.
- Alcohol related deaths-according to ‘www.therecoveryvillage.com’, alcohol abuse is up from 55% of respondents reporting alcohol use in the last month in 2017 to 67% in NY/NJ/CT/MA/RI in 2020. This is a 21.8% increase and therefore we have taken alcohol related deaths times 1.218
Conclusion
The conclusion is murky. It appears that we are saving lives by being inert (stroke/heart disease) but the increased suicide/substance abuse/Alzheimer related deaths are the expense. Cuomo has stated that a life is ‘priceless’. However, when comparing humans to humans, it appears that a human life with respect to the pandemic is worth 3.01 of heart disease/strokes to .98 in suicide/substance abuse/Alzheimer deaths.
Article by Greg Presseau of Perennial Capital


