Rocky, as in Rocky Balboa. Even if knocked down, rising to settle the score. Yeah, the bulls are made of steel – that’s still my opinion after looking at dozens of charts, and scrolling down the headlines.

Q2 2020 hedge fund letters, conferences and more
Assessing the outlook yesterday, such were my observations:
(…) Is the sharp correction over now? Thus far, my answer remains the same as yesterday – in terms of prices, the worst is likely behind us, in terms of time, we have a way to go still.
And here we are, with stocks at the crossroads again. Déjà vu or not? Let the charts speak.
S&P 500 in the Medium - and Short-Run
I’ll start with the daily chart perspective (charts courtesy of http://stockcharts.com ):
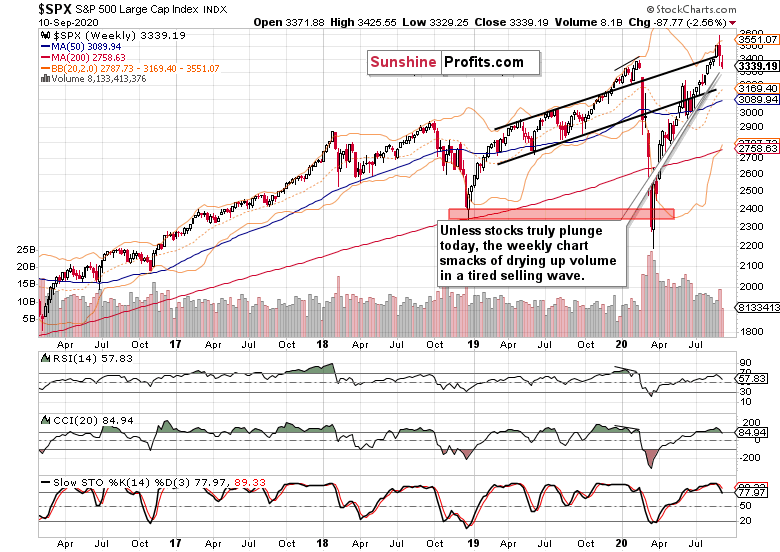
While prices reverted back to the rising black trend channel, the volume appears to be drying up. The current week looks like to be marked with lower volume than preceding week's reversal, and unless the bears force a dramatically lower close today (hint: I don't see that as likely to happen), the selling wave would appear to be running out of steam, and stocks nicely set up for an upside reversal next.
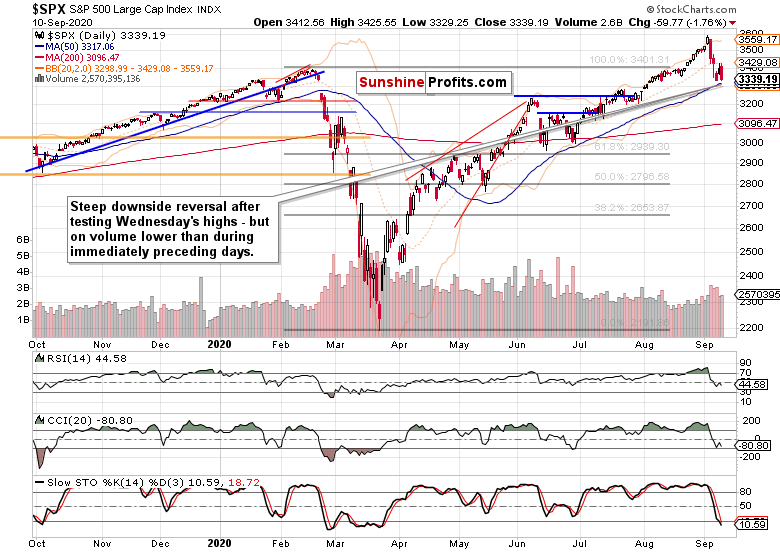
The caption says it all, and the implications are leaning bullish, if ever so slightly. Naturally, the bulls have to step in here, and erasing a sizable part of yesterday's downswing, would be a good start.
Yesterday's Downswing: The Credit Markets’ Point of View
High yield corporate bonds (HYG ETF) are painting a more cautious picture though (please see this and many more charts at my home site). On one hand, the ETF trades well above Tuesday's lows, on the other hand, yesterday's downswing happened on sizable volume. Investment grade corporate bonds (LQD ETF) don't offer many clues, as they went practically nowhere.
Long-dated Treasuries (TLT ETF) keep on trading sideways to down in recent weeks, and yesterday's upswing doesn't change that one bit. The current price action doesn't pose a challenge to the slow economic recovery and Fed's inflationary moves.
The stocks to all Treasuries ($SPX:$UST) ratio reveals the strain stocks are under at the moment. Still, they have not broken down deeply enough so as to justify my call for a shift in risk-on sentiment. Yes, it's being mightily tried right now, but this is not a reversal yet – just a regular correction that is less steep than the early June one.
S&P 500 Market Breadth and Technology
The daily advance-decline line offers an encouraging view. I see high likelihood for a short-term bullish divergence to be made today, fully in line with the hidden bullish signs since the previous Friday that brought us not too few advancing issues.
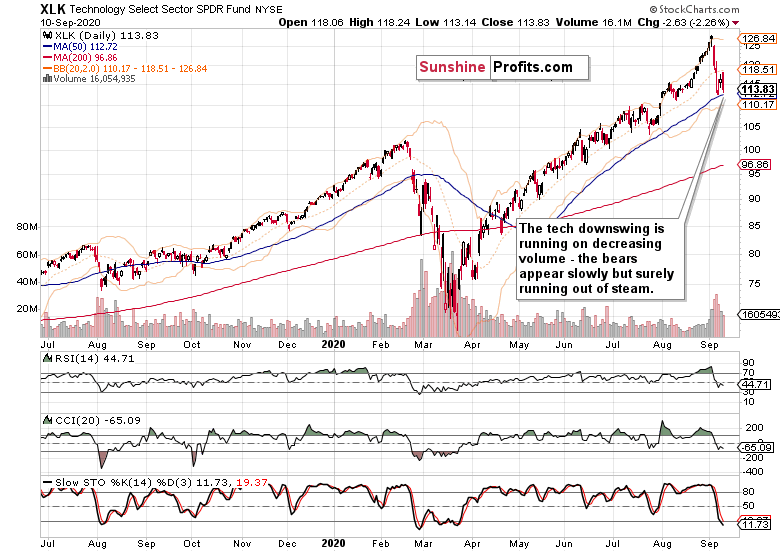
Technology (XLK ETF) is still very much at a short-term crossroads, but the potential for upside resolution is growing in my view – thanks to the declining volume. The chart though isn't bullish in and out of itself in the very short run – the bulls aren't catching breath exactly, and the sector is losing steam vs the value plays, relatively speaking.
Such were my yesterday's notes on the relative performances:
(…) Yes, that's what rotation is about, and the fact that it's happening, and money isn't moving out of tech to the sidelines or into Treasuries, but instead to value plays, attests to the stock bull being alive and well.
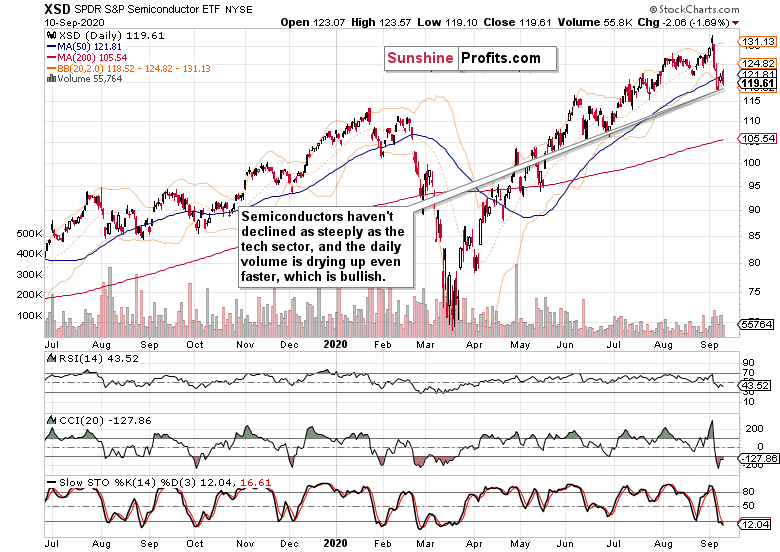
Semiconductors (XSD ETF) provide the bullish gem to uncover. Having finished farther above Tuesday's lows, with yesterday's downswing powered by lower volume, this leading segment of the leading sector wants to give benefit of the doubt to the bulls.
Dollar, Metals and Oil
The dollar bulls just can't and can't catch up short-term breath. Barely recovering from yesterday's downswing attempt, they're wasting precious time to reach up beyond the 50-day moving average. The advantage of bullish divergences in the daily indicators, is slowly but surely being lost.
Gold appears in the mood to peek higher regardless of the short-term dollar strength. Its peek shouldn't be interpreted as a breakout above the bullish consolidation next, but as an encouraging, very short-term sign of risk-on appetite.
Copper took it on the chin, but recovered approximately half of the intraday plunge. The chart's posture remains bullish, and that's key for the economic recovery.
The oil ($WTIC) chart still looks distinctly bearish, but the downswing appears set for a short-term consolidation, giving the bulls a chance to recoup some of their recent losses. But more than the would-be improved price readings, is required. Looking at the deeply oversold daily indicators in need of stabilization, oil bulls have a way to go still. But in the short-run, the oil reprieve would help stock bulls surprise on the upside.
Keeping in mind yesterday's big picture:
(…) Black gold's prices look to be underperforming stocks early on (canary in the coal mine) – just as they were at the beginning of 2020 – which highlights the very real possibility of a stormy not merely September, but also October.
Summary
Summing up, the stock upswing gave way to heavy selling yesterday, but hope is not lost for the bulls. Well, hope – who trades hope? The many signs keep pointing to stock upswing reasserting itself relatively shortly.
Should the area below Tuesday's lows be broken, that would lead me to reconsider the bullish short-term outlook with September still having a chance of closing in the black. Given the real world challenges though, I look at seeing a sizable lower knot on the September monthly chart as the base case scenario, and will let the bulls surprise me with steeper gains, if they can mount that power.
The key point is that the array of forces favors the bulls, and that risks are skewed to the upside once this healthy but volatile correction runs its course.
Thank you for reading today’s free analysis. I encourage you to sign up for our daily newsletter - it's absolutely free and if you don't like it, you can unsubscribe with just 2 clicks. If you sign up today, you'll also get 7 days of free access to the premium daily Stock Trading Alerts as well as our other Alerts. Sign up for the free newsletter today!
Thank you.
Monica Kingsley
Stock Trading Strategist
Sunshine Profits: Analysis. Care. Profits.
All essays, research and information found above represent analyses and opinions of Monica Kingsley and Sunshine Profits' associates only. As such, it may prove wrong and be subject to change without notice. Opinions and analyses were based on data available to authors of respective essays at the time of writing. Although the information provided above is based on careful research and sources that are believed to be accurate, Monica Kingsley and her associates do not guarantee the accuracy or thoroughness of the data or information reported. The opinions published above are neither an offer nor a recommendation to purchase or sell any securities. Ms. Kingsley is not a Registered Securities Advisor. By reading Monica Kingsley’s reports you fully agree that she will not be held responsible or liable for any decisions you make regarding any information provided in these reports. Investing, trading and speculation in any financial markets may involve high risk of loss. Monica Kingsley, Sunshine Profits' employees and affiliates as well as members of their families may have a short or long position in any securities, including those mentioned in any of the reports or essays, and may make additional purchases and/or sales of those securities without notice.


