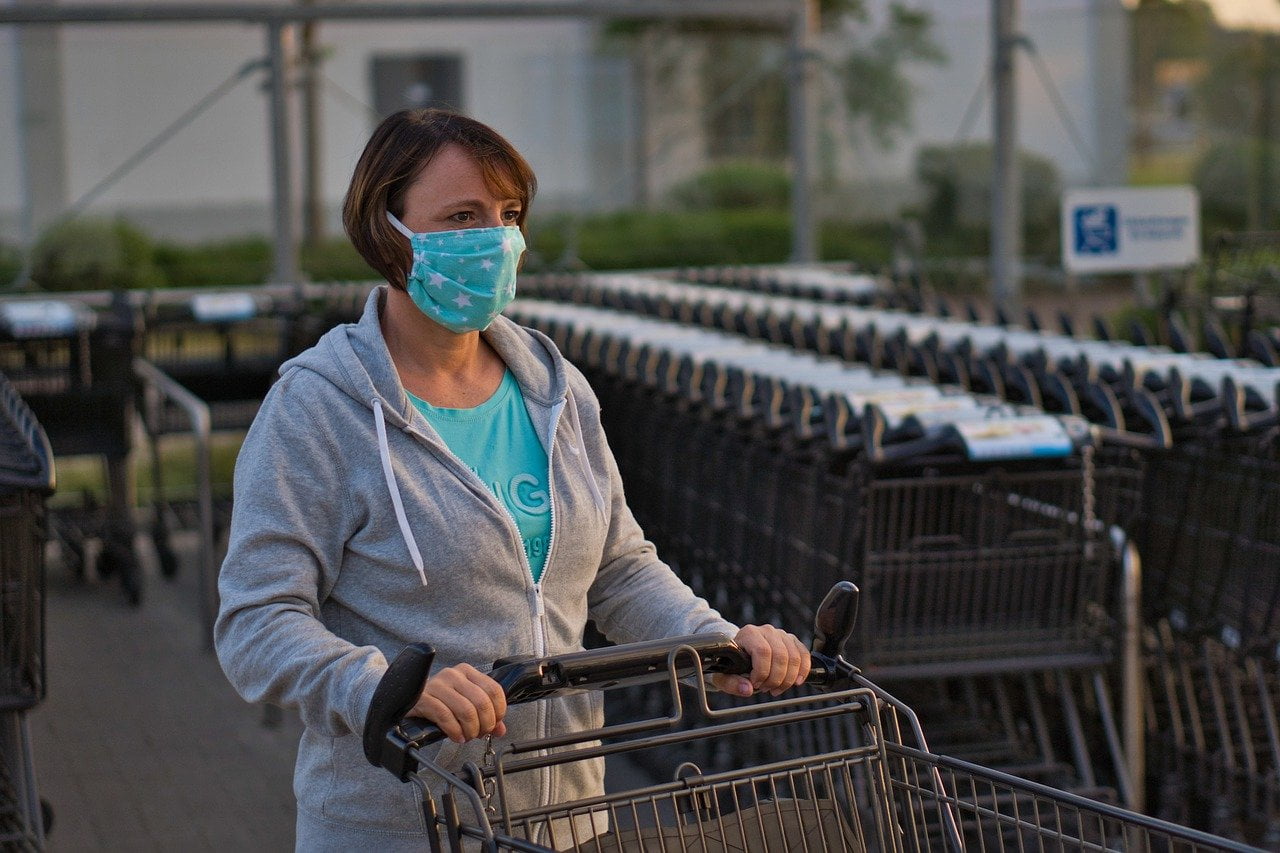
When the novel coronavirus pandemic made its way to America, states across the country implemented stay-at-home orders. Millions of people were forced to stay home to stay safe and keep the spread to a minimum. Did quarantine have a positive impact on the environment since so many people were not traveling to and from work?
Q2 2020 hedge fund letters, conferences and more
In a new study, Office Depot took an in-depth look at commuting habits around the United States. Using data from the U.S. Census Bureau’s 2018 American Community Survey and the Environmental Protection Agency, Office Depot examined how commuting impacts the environment, specifically air quality. Here are some of the results.
How Are People Getting to Work?
It should be no surprise that the majority (85%) of respondents reported commuting to work with either a car, truck, or van, but the next most significant set of people work from home (5.3%). Nearly 5% of survey participants use public transportation, 2.6% walk, and 0.5% ride their bike to work. Approximately 8% of Americans used a “greener” mode of transportation to get to work – carpooling, bike riding, walking, etc.
Nearly 87% of people who were either a full-time or part-time employee and worked for a private or public company drove their vehicle to work. Virtually the same number (88.7%) of federal employees also used their car, van, or truck to commute. But self-employed (22.1%) and unpaid family workers (20.4%) were more likely to have a job where they worked from home compared to the other types of jobs analyzed.
According to the study, people who made more than $100,000 a year were more likely to use public transportation than those who made less money.
Air Quality: Top States for Greener Commuting
How did different states stack up against the rest of the country when traveling green was concerned? The study revealed which cities and states performed the best in four ways of green transportation – carpooling, public transit, cycling, and walking. The top three cities for best carpooling practices were Allentown, Pennsylvania; San Francisco, California; and Paterson, New Jersey. Hawaii, Alaska, and Arizona were the states that utilized carpooling most frequently.
As far as cities where people use public transportation the most, New York City, New York; Jersey City, New Jersey; and Washington, D.C., residents ranked the highest. The states that use public transportation the most are New York, Massachusetts, and New Jersey.
Cambridge, Massachusetts; Ann Arbor, Michigan; and Portland, Oregon, ranked highest in biking, with Oregon, Vermont, and Alaska leading the rest of the country. Cambridge ranked first again in walking, with Ann Arbor and Provo, Utah, following behind. Alaskans, New Yorkers, and Vermonters walked to their destinations the most.
New York, California, and Illinois were the three states with the highest percentage of greener modes of transportation.
Commute Times to Work
The study broke down how long it takes respondents to travel to work, no matter the means, by state and city. When looking at statewide averages, the shortest average commute clocked in at around 17 minutes, and the longest was 33.5 minutes. Wyoming ranked first across the country with the shortest average commute time. Alaska and South Dakota ranked second and third, respectively.
Cities in California (Antioch and Palmdale) and New York (New York City and Yonkers) made up the top 4 of the 5 cities with the longest commute, the longest being 46.6 minutes, on average. The areas with workers who have the shortest commute to work are Sioux Falls, South Dakota; Syracuse, New York; and Green Bay, Wisconsin. The quickest average commute time was 15.8 minutes.
Greener Commuters, by Industry and Occupation
Results from the survey even revealed which industry’s workers are considered more environmentally conscious commuters than others. Internet publishing and broadcasting (33.4%), the U.S. Marines (31.3%), and book publishers (25.5%) were among the greenest industries across America where commuting is concerned. The least green industry among those analyzed was the U.S. Army (20.5%).
Residential advisers (54.7%), people enlisted in the military (50.5%), and economists (36.5%) were the occupations with the greenest commuters, according to the study. Fashion designers (31.9%), tutors (31%), and editors (30.9%) were next on the list.
Commuter Air
An air quality index (AQI) of less than 50 is considered a good score. A moderate score is from 51–100, and air quality is deemed to be acceptable in that range. A score above 101 is determined to be unhealthy for sensitive groups, and generally unhealthy air is deemed a score between 151–200. Cities across America are ranked on that scale.
The study compared the latest 2018 air quality statistics against average commute times by city. Syracuse, New York, had the greatest number of quality air days a year (254) and an average commute time of just 16.3 minutes. Four of the top 10 states with the highest number of good air quality days are from New York – Syracuse, Albany, Rochester, and Buffalo.
Los Angeles, California, only has 56 good quality air days a year, where residents’ average commute is 32.5 minutes. The fewest good quality air days across the nation in 2018 were found in Warren, Michigan; Pittsburgh, Pennsylvania; and Visalia, California.
It seems that air quality and commute times have a connection as there are fewer good air quality days in cities where there are longer commutes. But in cities where people actively try to travel to work with green tendencies in mind, the air seems to have fewer pollutants. With this information in mind, we can strive to find more ways to reduce the pollutants in our air.


