Try to remember the kind of September when life was slow and oh so mellow

Q1 2020 hedge fund letters, conferences and more
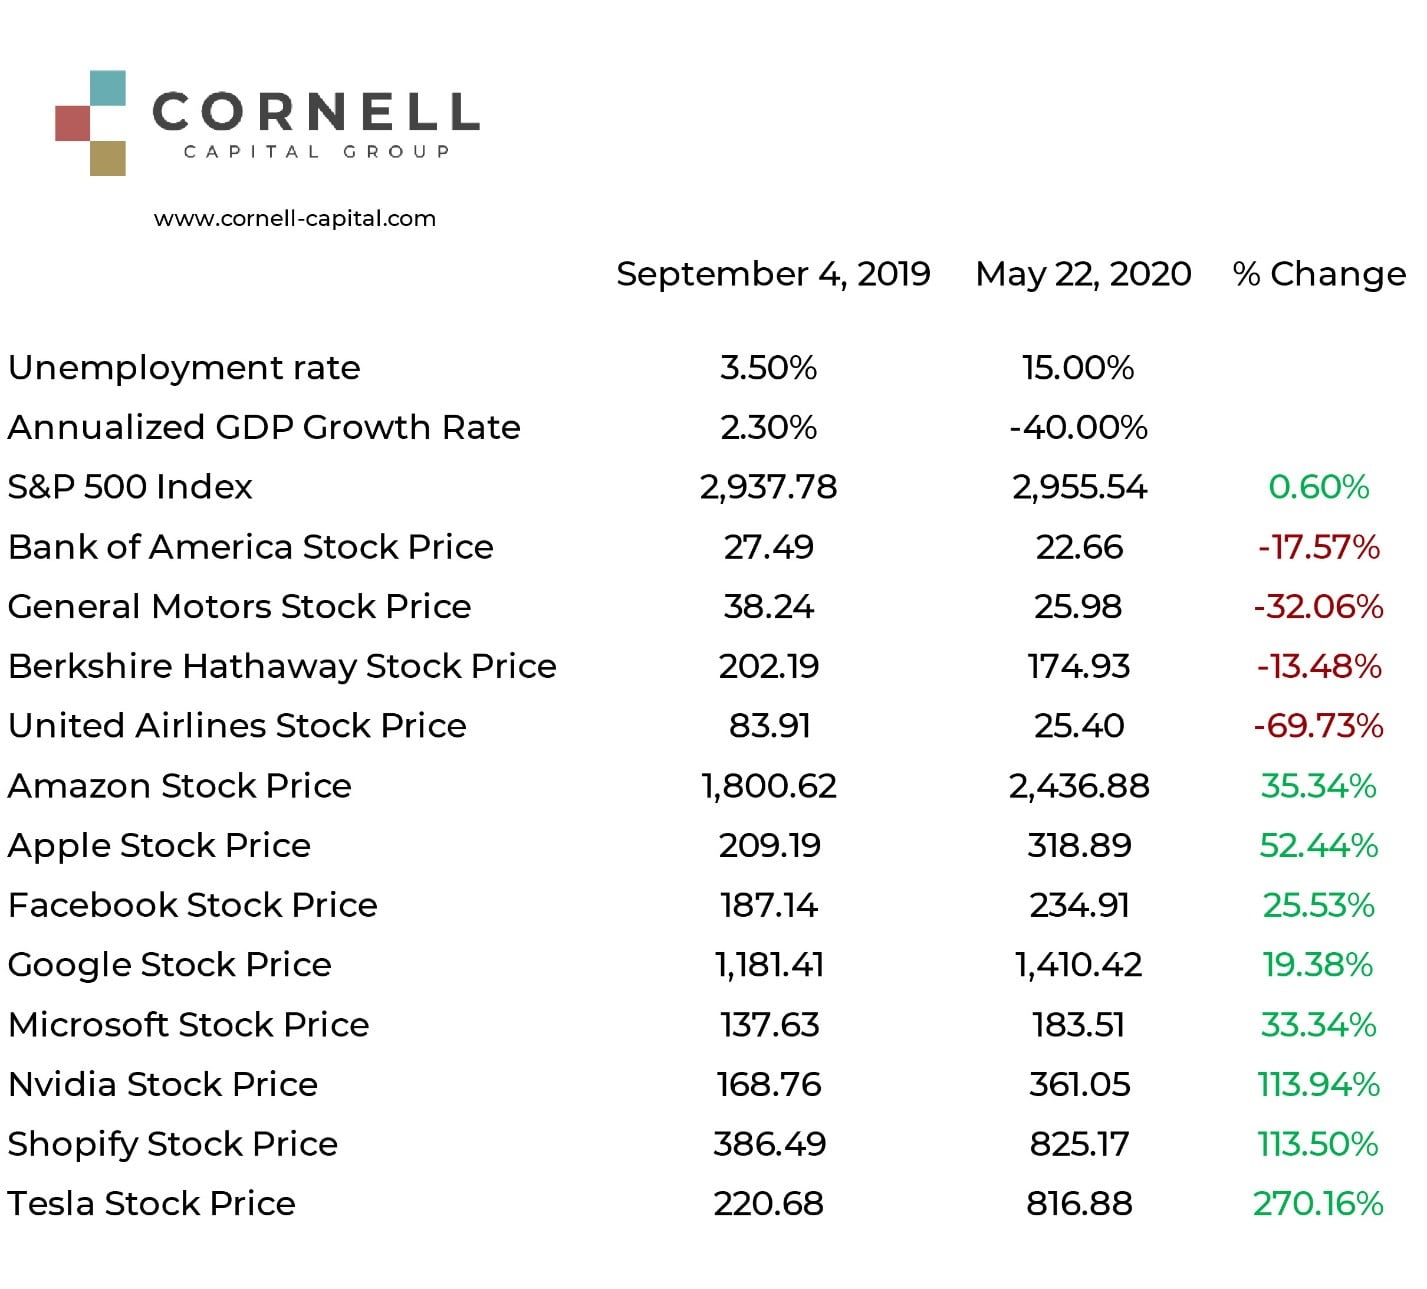
With the Covid crisis upon us, life last September seemed slow and oh so mellow. But memory can be deceiving, so from an investment standpoint it is worth digging deeper to jog memory. Last Friday, before the long Memorial Day weekend, the S&P 500 closed at 2,955.54. This is almost exactly equals the level of the index following the close on September 4, 2019. On that day, just after the Labor Day weekend, the S&P 500 stood a whisker less at 2,937.78. This suggests a comparison of now versus then. In that respect, the exhibit below provides historical perspective.

The Disaster Wrought By Covid-19
On a macroeconomic basis, the exhibit shows the disaster wrought by Covid-19. Back in September 2019, the economy was humming along, growing at a respectable rate of 2.3% in real terms. The unemployment rate was a spectacular 3.5%, nearly an all-time record low. In addition, stock prices had been rising, with the S&P 500 up 12.7% from the start of the year. It was all very mellow. By May 22, 2020 macroeconomic conditions were anything but mellow.
The economy was contracting at an annualized rate of 40%, worse than the rate of decline during the financial crisis, and matching levels unseen since the great depression. Similarly, the unemployment rate spiked from record lows to in excess of 15% - again a level matched only during the great depression. But somehow the stock was not concerned. The S&P 500 was at the same point it had been in the halcyon days of September.
The consistency of the S&P 500 hides turbulence underneath. As the exhibit shows, traditional “value” stocks such as Bank of America, Berkshire Hathaway, and General Motors all fell significantly from September to May, while United Airlines which saw 95% year over year drop in passengers, not unexpectedly cratered. Such declines were pretty much true across the board, with one huge exception – technology stocks.
The big five, Amazon, Apple, Facebook, Google, and Microsoft were all up with the group averaging over 25%. However, this gain was small in comparison to the jump in other large, high profile tech stocks such as Nvidia, Shopify and Tesla which were all up over 100% from September to May. It was this rise in technology stocks, which constituted a large fraction of the total market value, that allowed the overall market to avoid falling as the economy unwound.
But does this make sense? Taken as a whole, the American economy was producing goods and services at a much slower rate in May than September. Furthermore, predictions of future economic growth that were taken for granted in September were replaced by forecasts of a period of decline followed by a slow recovery. Even if certain technology stocks were expected to thrive in this new world, how could stock as a whole fail to reflect the changed conditions?
The Value Of Expected Future Cash Flows
To answer the question, it is important to remember that stock prices reflected the present value of expected future cash flows to equity owners. That present value is calculated by discounting the cash flows at a rate that reflects the expected return on equity. Given this framework, it is possible that a drop in expected future cash flows can be offset by a decline in the discount rate. That appears to be the best explanation of what has happened. The slowing of the economy and the massive infusion of liquidity by the Federal Reserve has driven the interest rates on Treasury securities to record lows dragging down the expected returns on stocks with them. This drop in discount rates increases stock valuations, particularly valuations of growth stocks with large cash flows in the more distant future.
While this all sounds good, there is a dark side for investors. If stock prices have been supported, or enhanced in the case of technology stocks, by a drop in the discount rate, it means that returns going forward are going to be less, on average. Unlike bonds, however, the lower expected future returns on stock cannot be observed directly. They leave their tracks in high stock prices. For instance, Amazon, despite its massive size, is currently trading at a stratospheric P/E multiple 116! If that multiple were to start returning to Earth, the stock price could remain stagnant for years even in the face of rising earnings.
As an example, in July of 1998, Coca-Cola was a growth stock darling trading at price of $44 with P/E ratio of 50. During the ensuing 22 years, virtually all the increases in Coke’s earnings were offset by declines in the P/E ratio. The stocks closed at $45.03 on Friday, May 22. Given the multiples at which tech darlings are trading today, many are likely to have a Coke in their future. The remarkable rise in the prices of leading tech stocks does not imply more of the same in the future – just the reverse. That rise has caused these stocks to become more expensive and the more expensive a stock becomes the lower the future expected returns.


