November 23, 2020 Update: The Euro Stoxx 50 is holding solidly above its 200-day average at 3,171 and above the March downtrend. According to Credit Suisse analysts, that keeps the spotlight on the key trading range high set in July at 3,451. They said if the index closed last week above that level, it would be resolved to the upside and change their view to a bullish stance on European equities.
The Euro Stoxx 50 is trading above that level now, so they see the next resistance at 3,532, followed by 3,595 and 3,596, which were the December 2019 low and late February reaction high. Credit Suisse analysts see key support at the 200-day average of 3,171. If that level is broken again, they say it would result in renewed weakness with the October low at 2,921 being the next line in the sand to monitor.
Europe compared to the MSCI World has come under renewed pressure, and Credit Suisse expects the long-term underperformance to continue.
Euro Stoxx 50 expected to underperform on bearish continuation
October 23, 2020 Update: European equities have been moving sideways for some time, although Credit Suisse analysts expect them to underperform in the near future. They note that the Euro Stoxx 50 held above a number of support levels, including the 23.6% Fibonacci retracement of the March to July up move. The index also remained above its 200-day moving average, which is holding onto its sideways range.
Credit Suisse analysts said only a clear break above 3,396 would indicate that the range is moving higher, possibly to test the July high at 3,451. In order to see bearish pressure return, a fall below 3,147 or 3,144 is needed with support next falling at the September low of 3,098. If the Euro Stoxx 50 breaks below that level, the next support would be at 3,013, which is the 38.2% retracement of the March rally.
Credit Suisse continues to expect European stocks to underperform against global equities because the ratio remains in a downtrend and just recently completed a major bearish continuation pattern.
Euro Stoxx 50 could be heading for head-and-shoulders
September 24, 2020 Update: Credit Suisse analysts say the Euro Stoxx 50 is on the verge of breaking below the neckline of a head and shoulders technical pattern. That would coincide with a the 23.6% Fibonacci retracement of the March to July uptrends at 3180 and 3174.
They said a clear break would trigger a top with the next key support level at 3013, which is the 38.2% Fibonacci retracement at 2878 and 2854. The next support level would be at the 61.8% Fibonacci retracement at 2743 and 2708.
“Only a clear rise back above the 200-day average at 3278 would again rise prospects of further sideways trading to emerge,” they wrote in a recent report. They continue to see European equities underperforming versus global equities as the overall downtrend remains intact.
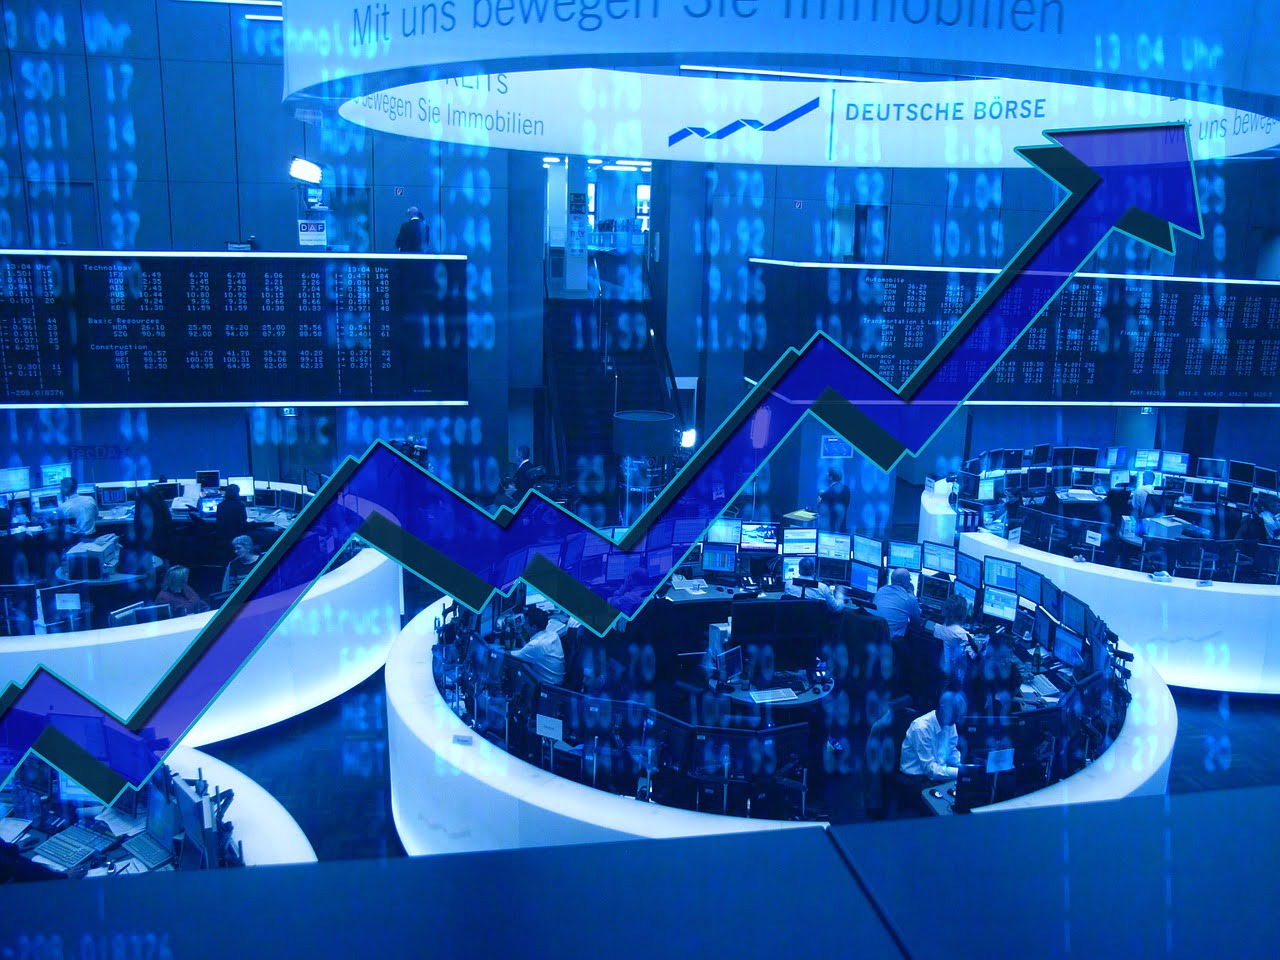
Euro Stoxx 50: How it works and how you can invest
Equity investors exploring international investment opportunities often come across indices like FTSE 100, Nikkei 225, DAX, and Euro Stoxx 50. Geographical diversification helps minimize the risk. The Euro Stoxx 50 index is a good way to get some exposure to blue-chip companies in the Eurozone area. Let’s find out how this index works and how you can invest in the index.

Q1 2020 hedge fund letters, conferences and more
How it works
The Euro Stoxx 50 index was created in February 1998 by the index provider Stoxx, which is owned by Deutsche Borse Group. It is often used as a barometer of the Eurozone economy. According to Stoxx, the index aims to provide a "blue-chip representation of supersector leaders in the Eurozone."
It consists of 50 stocks from 11 Eurozone countries - Germany, France, Spain, Austria, Belgium, Finland, Italy, the Netherlands, Ireland, Luxembourg, and Portugal. The index is designed to represent the performance of the leading companies across 20 Euro Stoxx Supersector Indices. The Supersector Indices are the subsets of the Euro Stoxx Index.
Also, there are country specific Euro Stoxx 50 sub-indices for France, Italy, Spain, Germany, and the Netherlands. Each country's sub-index includes stocks from that particular country within the Index.
The Euro Stoxx 50 Index captures roughly 60% of the free-float market cap of the Euro Stoxx Total Market Index, which itself covers about 95% of the free-float market cap of the countries represented in the index. The index value is calculated every 15 seconds between 09:00 CET and 18:00 CET.
Constituents
It's a free float market-cap weighted index, meaning the constituent companies are weighted based on the market value of their outstanding shares. The index is reviewed every year in September. It has fast-entry and fast-exit rules to ensure that the index represents the accurate performance of the largest and most liquid stocks.
Only companies from Eurozone member countries can become part of the index. Here's the detailed methodology Stoxx uses to review and update the index. As of April 24, 2020, the largest constituents of the index are:
- SAP SE
- ASML Holding NV
- Sanofi SA
- Linde Plc
- LVMH Moet Hennessy Louis Vuitton SE
- Total SA
- Allianz SE
- Siemens AG
- Unilever NV
- L'Oreal SA
How to invest in Euro Stoxx 50
If you want to get exposure to Eurozone's largest stocks, the best way is to invest via exchange-traded funds (ETFs). One of the most popular NYSE-listed ETFs tracking the index is the SPDR EURO STOXX 50 ETF (NYSE: FEZ). Another is the iShares EURO STOXX 50 ETF (NYSE: EUE). You can buy and sell ETFs just like regular stocks.


