As of the close on March 12, 2020, the S&P 500 is down 26.74% from its closing high of 3386.15 on February 21, 2020. Can the drop be attributed to the virus? What are the implications of the drop? To help answer these questions I built a simple spreadsheet. (For those of you who like to play with the numbers here is a link to the spreadsheet). For those of you who do not want to deal with the details of the calculation, here is how it works.

Q4 2019 hedge fund letters, conferences and more

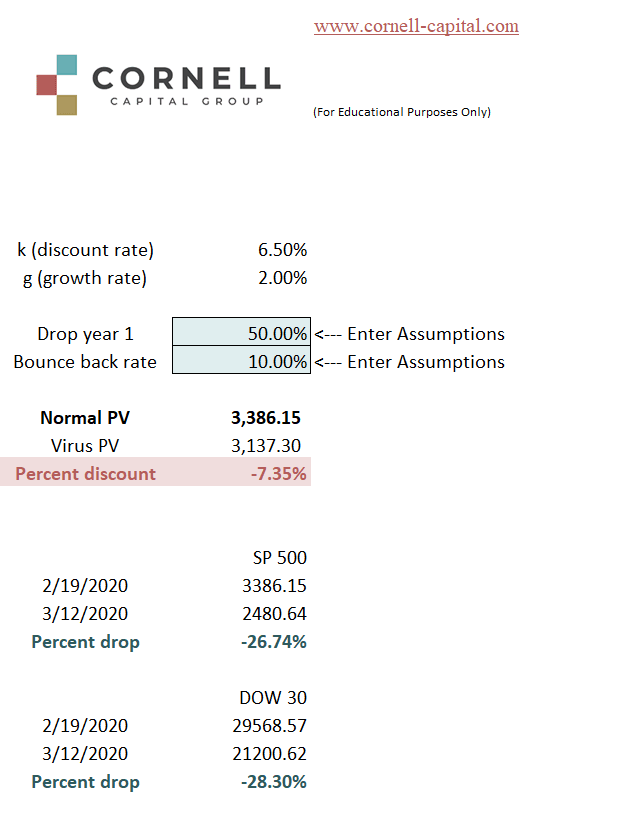
Because I am dealing with the entire market, the total underlying cash flows of the constituents tend to grow at a relatively constant rate in the long run. I assume, therefore, that the long run (over many years) growth rate of total corporate cash flow is 2.00%, approximately equal to the overall growth rate for the economy. For discounting future cash flows to present value, I chose 6.5% - equal to a 1% interest rate and a 5.5% equity risk premium. Using those inputs, in the first step of the calculation I reverse engineer the calculation to solve for a level of current corporate cash flow necessary to arrive at an index value of 3386.15.
The Impact Of The Virus
The second part of the calculation has two additional inputs. The first is how much the corporate cash flow drops in the current year due to the virus. I take that number to be 50%. This 50% drop results in a gap between the cash flow that would have occurred without the virus and the lower cash flow that occurs because of it. The second input is the rate at which the gap in the first-year cash flow declines as the economy catches back up.
I assume that 90% of the gap remains after one year, 81% (.9*.9) remains after two years, and so on for every year in the future. Using these inputs, which in my view are relatively draconian and long lived given the nature of the virus, the spreadsheet yields an implied percentage drop in the market of 7.35%, only about one-fourth of the actual drop.
In assessing my assumptions it is worth noting that China is already gearing back up. As one example, Apple has reopened all its stores in China. However, the reader is urged to download the spreadsheet and play with the assumptions. Aside from the possibility that my model is too simple, or the assumptions are too optimistic, what else could accountant for the discrepancy between the 7.35% drop implied by the model and the actual 26.74% drop in the market?
Overreaction?
One possibility is that the market has simply overreacted to the virus. The market has failed to properly weigh the long-term impact of the virus. Such a short-sighted reaction could be attributable to the massive drumbeat of twenty-four-hour news made possible by modern electronic communication. Every minute there are reports of a new death, a new outbreak, a new cancellation, a new celebrity announcement, and so on. It is hardly a stretch to hypothesize that such constant attention leads to a state of panic and overreaction – think of the nationwide run on toilet paper. The run on stocks could be another example exacerbated by the failure of the government to have articulated a clear response thus far.
The second possibility is that the virus is more a catalyst than a cause. Readers of this column are aware that for the six months prior to the collapse, I have been worrying that stock prices were running ahead of fair value. It that were true, then starting from a market high of 3386.15 to assess the impact of the virus is misleading. The 7.35% drop should be measured from a starting point of fair value. Unfortunately, there is no clear method to determine what that starting point is. Nonetheless, given this interpretation, it is possible that now, after the drop, the market has returned to a level consistent with fair value.
Investment Implications
It is important to distinguish between the two interpretations because they have vastly different investment implications going forward. To the extent that the market is overreacting, it should return to a level that reflects the long-run impact of the virus as the market regains rationality. In terms of the spreadsheet example, this would be a drop of about 7.35%. However, that assumes the market was fairly valued when the decline started. To the degree that the market was overvalued, and the virus was a catalyst, then the extent of any bounce back depends on whether the market is fairly value at current levels.
If current valuation is fair, there is no reason to expect a bounce back, or a further decline for that matter. As I noted in a previous column, at current levels there appear to be numerous attractive opportunities, suggesting that the market has reached a reasonable valuation. I offered General Motors as one example among many.
Obviously, a critical question for investors is which interpretation is correct. In my opinion, the answer is a combination. The size and swiftness of the drop based on what is almost certain to be the short-run impact of the virus appears unjustified as the spreadsheet implies. However, it was also hard to justify the S&P 500 at 3386.15 before the collapse began. As a result, it is my view (yes it is a view not a scientific assessment) that some rebound is to be expected as the impact of the virus fades, but not to previous levels.


