The Dow Jones Industrial Average and S&P 500 both plunged into correction territory this week as fears about a coronavirus pandemic worsen. It would seem like perfect conditions for a soaring gold price, but the yellow metal is also struggling today. Now one firm points out that a number of potential recession signals are flashing.
Macro model flashed previous recession signals
Tavi Costa and Kevin Smith of Crescat Capital presented their updated macro model in a recent YouTube video. Their model is only three percentage points from record overvalued levels. Thus, they argue that the U.S. business cycle has probably peaked and that we are a long way from a market bottom. They noted similar peaks in their macro model in 2006 and 2007 and 1999 and 2000.
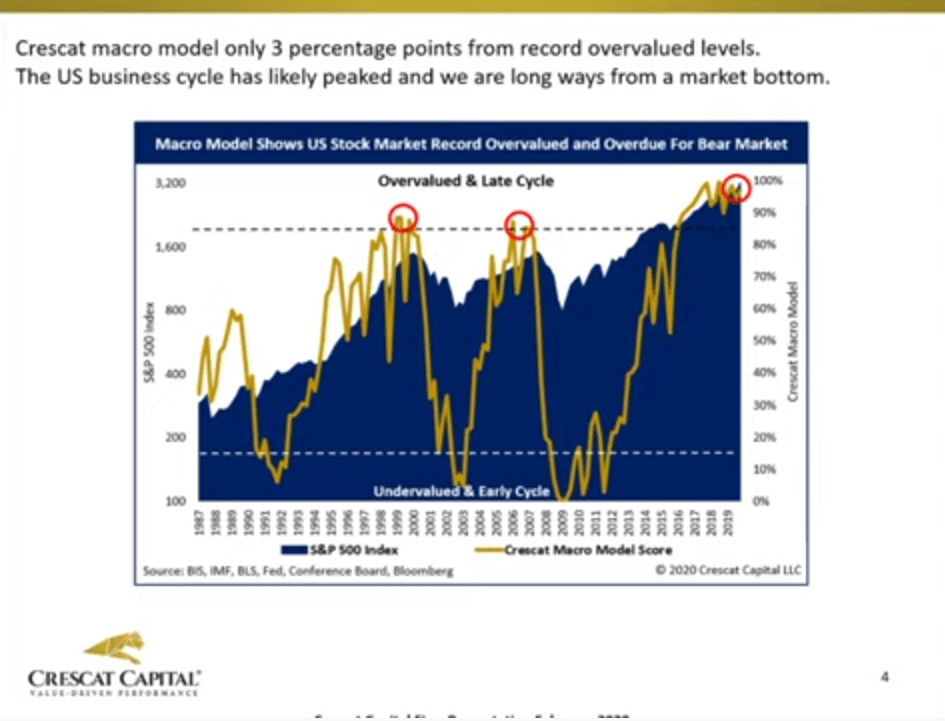
The last time their macro model was at the same heights as the last two major stock market crashes was in 2015, so it has continued to climb since then to reach new heights. Their model didn’t predict a recession at that time for a number of reasons.
They note that in 2015, we didn’t have the same level of yield curve inversion that exists today. The current cracks in the labor market and consumer confidence also weren’t in place. Further, they said business fundamentals have weakened, and macro indicators have been deteriorating.
Additionally, valuations reached record levels recently. They add that the disconnect between asset prices and ruptures in the economy is unsustainable.
Most overvalued stock market ever
Based on the eight fundamental measures they track, the stock market is the most overvalued it has ever been. They describe it as a “speculative mania,” adding that the measurements are higher than the tech bubble.
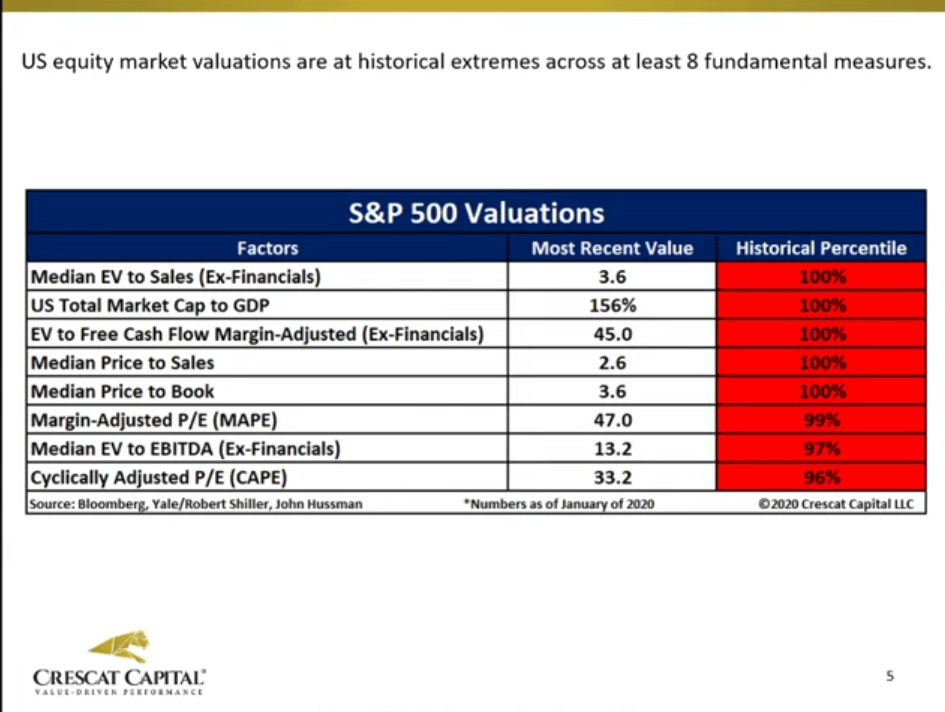
The median EV to sales ratio is twice as high as it was at the tech bubble and the peak of the housing bubble. They look at enterprise value because it includes debt, while PE ratios don’t factor in debt.
They also said eight of the 11 sectors are at record valuations, which is unlike anything seen in the last 30+ years.
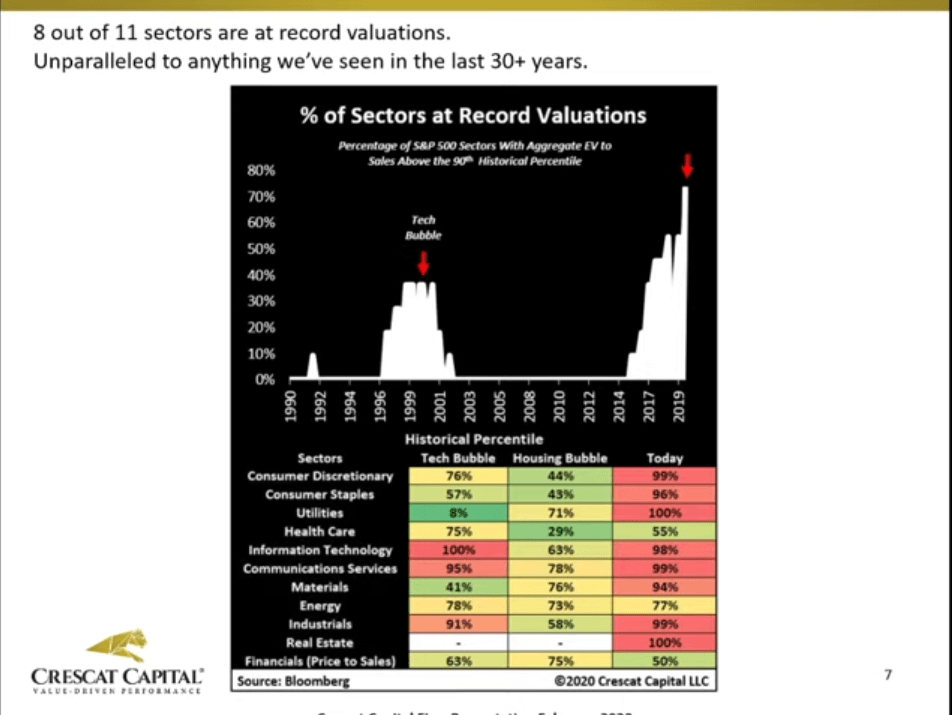
During previous bubbles, only select sectors were overvalued. For example, the tech bubble saw tech, communication services and industrials overvalued. During the housing bubble, builders and banks were overvalued. However, today eight of the 11 sectors are above the 90th percentile in EV to sales.
Consumer confidence as a contrarian recession signal
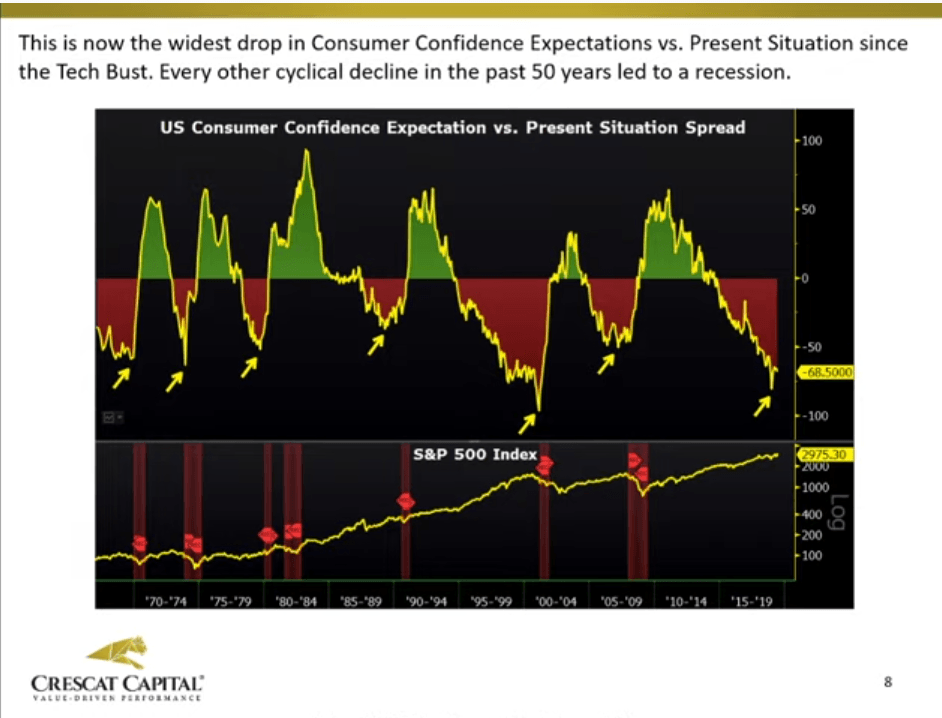
One other thing the Crescat team looks at is consumer confidence. They say it’s a contrarian indicator, although most investors think it just means everything is great. However, at the peak of every cycle, consumer confidence is at a cyclical high. They look at two components of it, which are future expectations versus the present situation.
And they said when future expectations start to diverge from the present situation, it’s an indicator that the stock market has peaked and the business cycle has reached a top. They see a strong divergence between these two measurements today, indicating the peak of a cycle.
In fact, this is the widest gap between expectations and the present situation since the tech bust. Every other cyclical decline over the last five decades resulted in a recession.
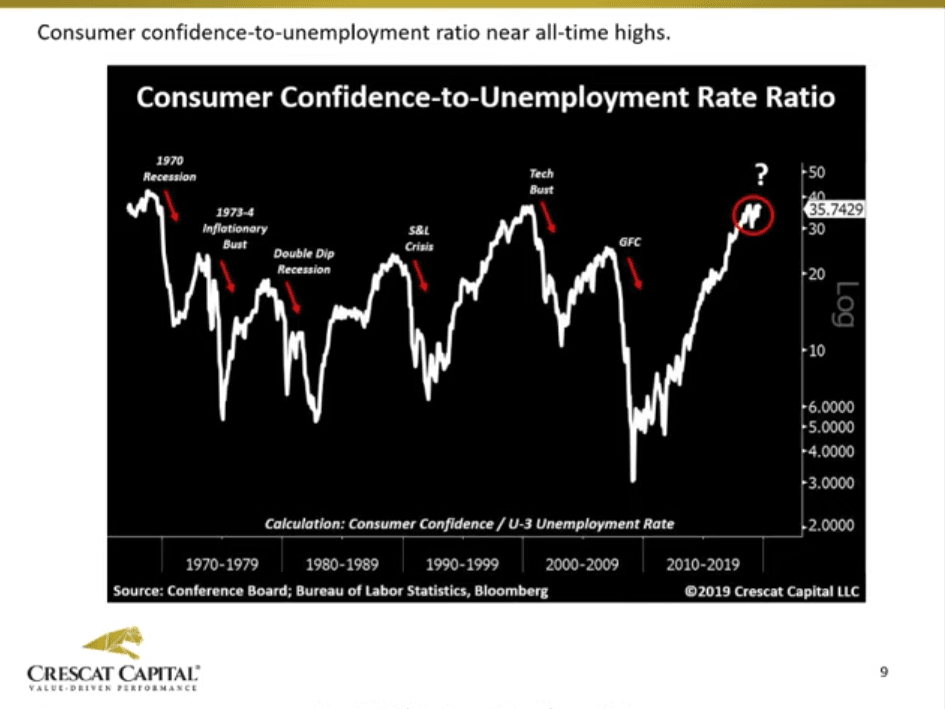
They also look at consumer confidence against the unemployment rate, another ratio they say is close to all-time highs. They note that it’s retesting the levels seen during the tech bust and the 1970 recession.
Recession signal: earnings and labor market cracks
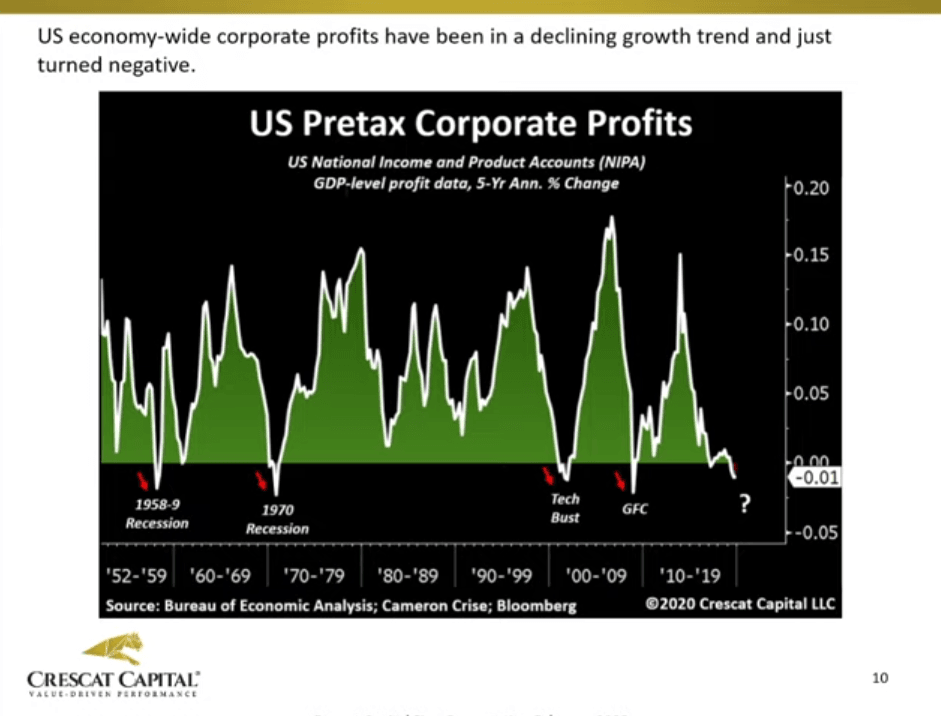
The Crescat team also studies pretax corporate earnings across industries in the U.S. They said the tax cut in 2018 did help companies’ bottom lines, but it didn’t bring any sustainable change. They said company fundamentals have been flat for the last five years. Corporate profits have been declining and just turned negative. However, the stock market has been soaring to new all-time highs, and multiples have reached record levels.
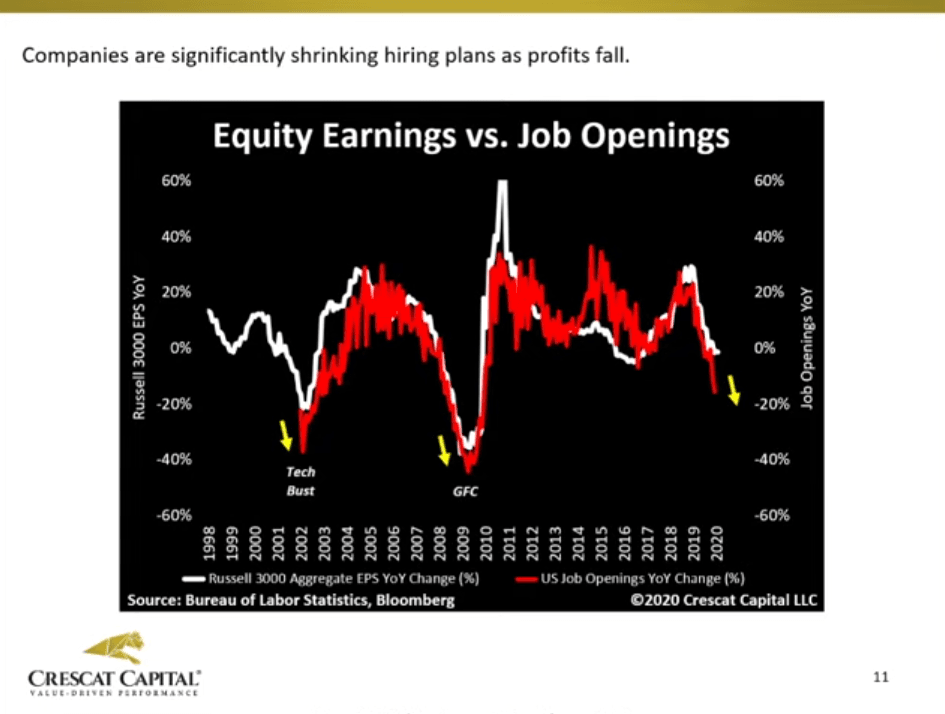
They also look at earnings versus job openings. As earnings have started to contract, job openings have been plunging. They said this trend also follows GDP growth, suggesting massive deceleration in GDP growth.
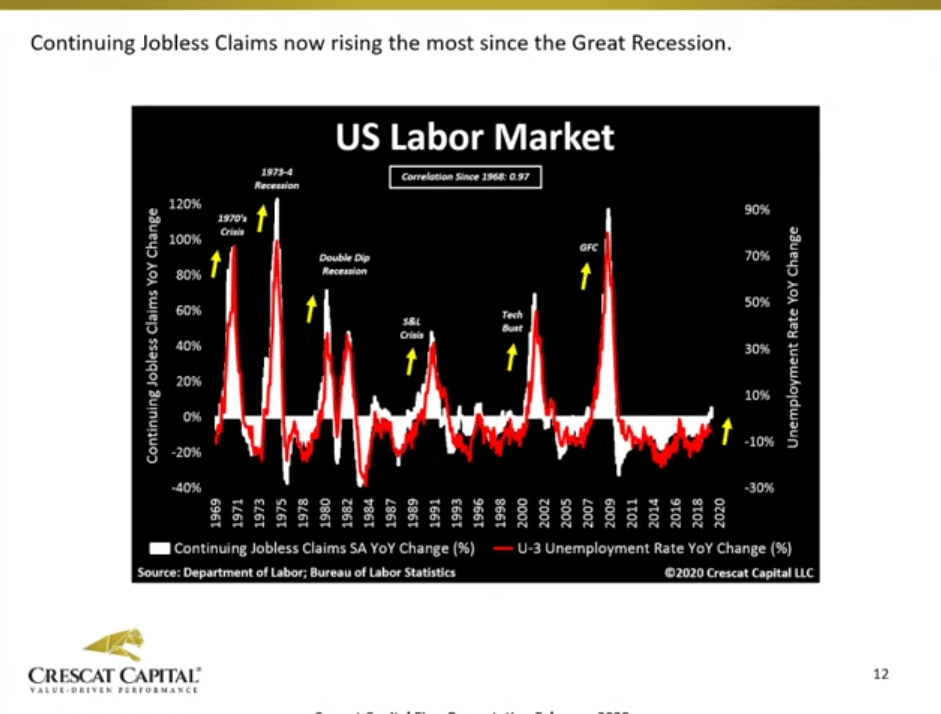
They also pointed to other cracks in the labor market. For example, the number of jobless claims just rose above zero. Jobless claims have been rising the most since the Great Recession. They added that this indicator follows changes in the unemployment rate closely.
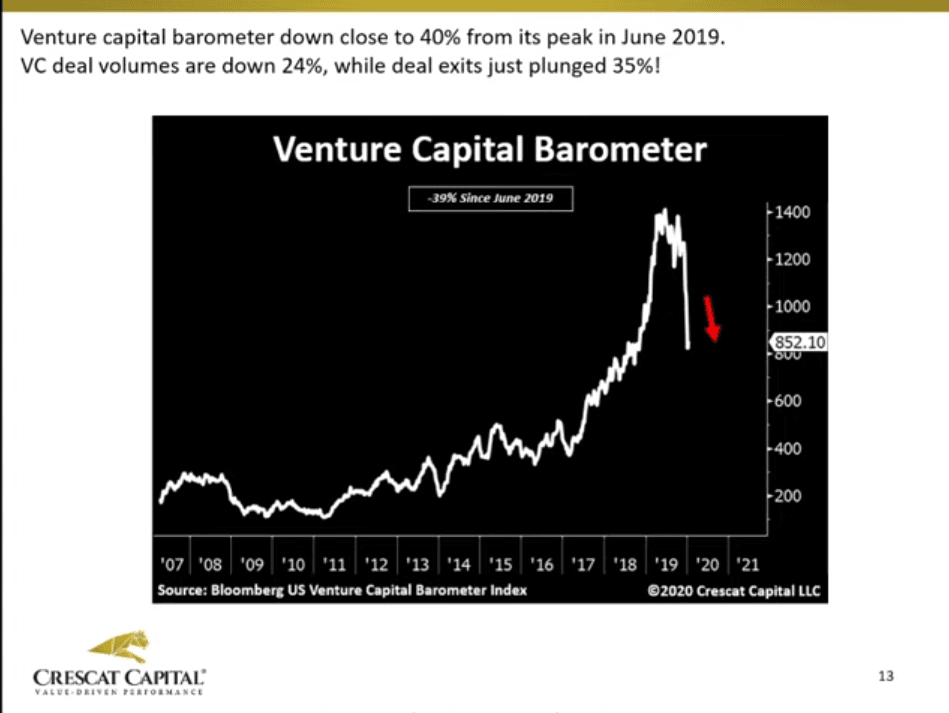
Crescat’s venture capital barometer has also been plunging. It peaked in June 2019 but is down more than 40% since then. They note that last year brought many broken initial public offerings, such as Uber, Lyft, Beyond Meat and others.
They add that venture capital volumes are drying up significantly, and it ties back to the labor market because starts are slowing or falling apart.
End or beginning of an expansion?
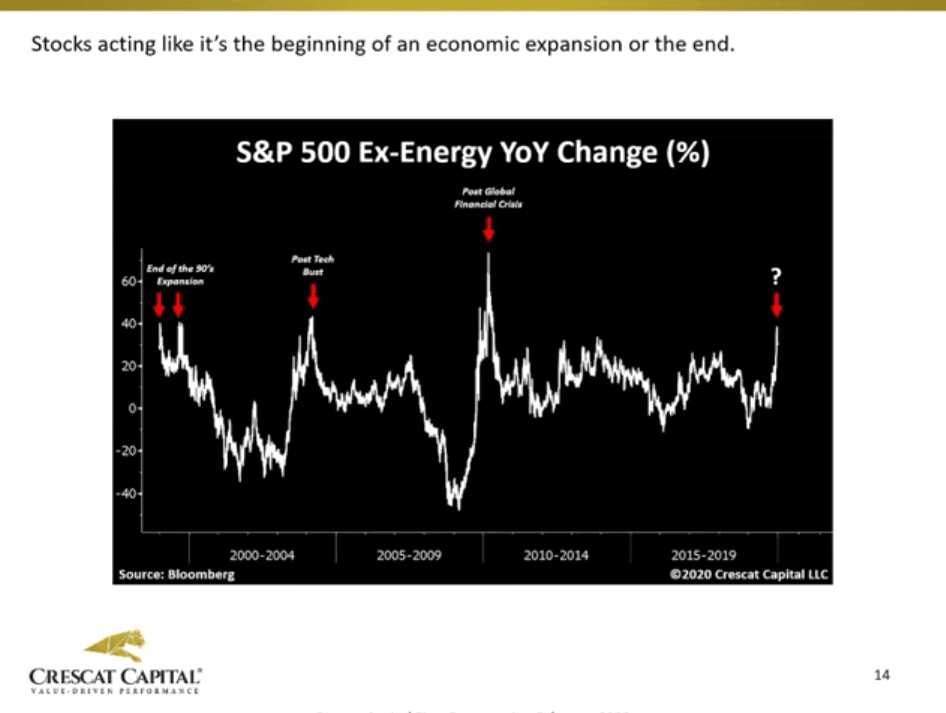
They also looked at the S&P 500 excluding energy. They said stocks have been acting like it’s the beginning or the end of an economic cycle. It’s either late in the cycle or early in the cycle. Since the cycle is the longest in U.S. history, and we are in a record long bull market, it must be the end of the cycle. Thus, stocks may be considered another recession signal.
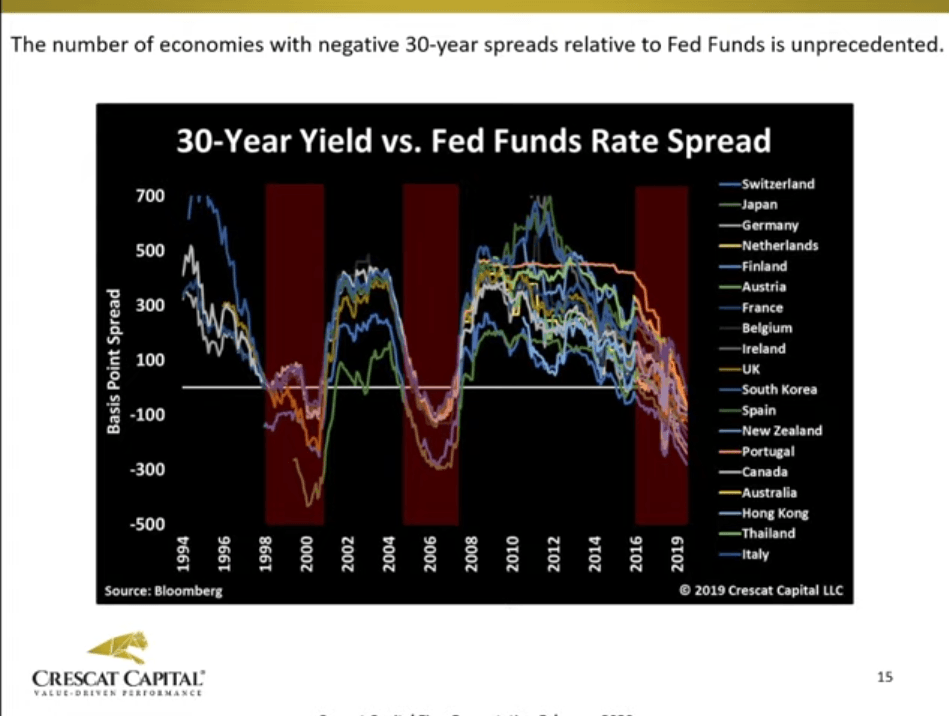
The Crescat team also looked at the global yield inversion, comparing the federal funds rate to 30-year yields across 25 countries. They said an unprecedented number of countries have their 30-year yields below the U.S. overnight rate. They add that this is a unique phenomenon. The fact that it occurred at the peak of the tech and housing bubble suggests it could be another recession signal.
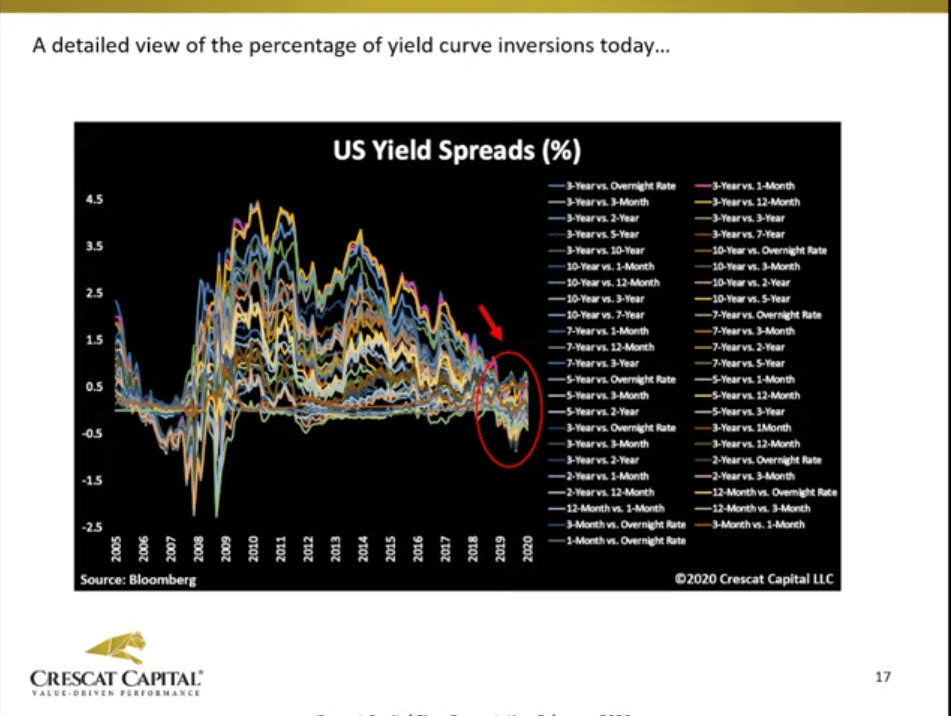
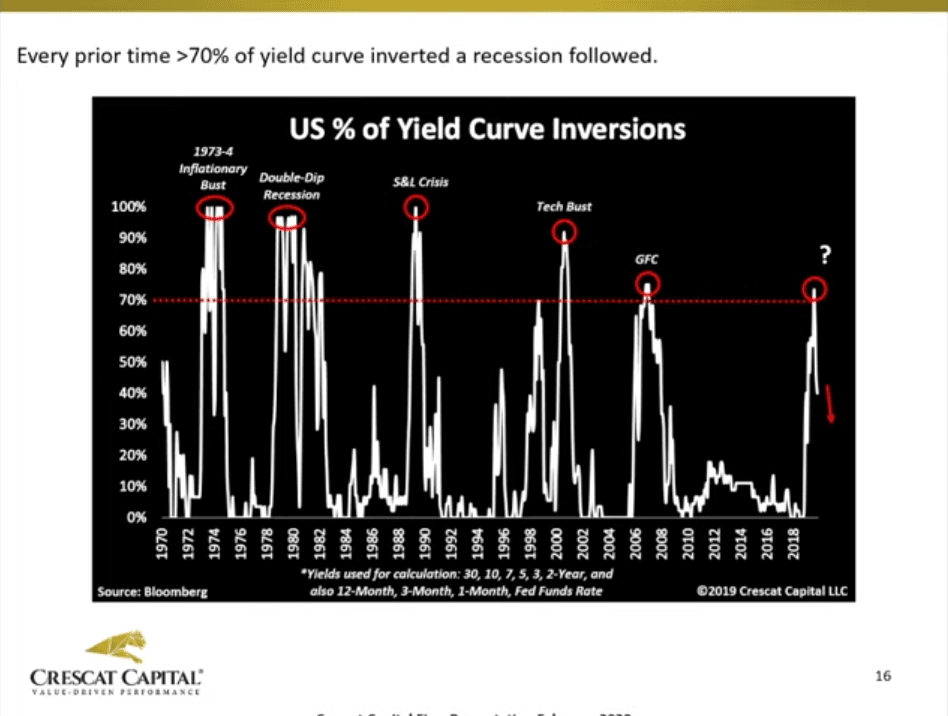
Looking at the U.S. yield curve only, they add that every other time more than 70% of the yield curve inverted, a recession followed, which is another signal that’s flashing right now. They say in 2016 and 2015, there were no yield curve inversions, but today, 73% of the yield curve was inverted as of August 2019.

They also showed all parts of the yield curve that inverted, adding that more and more of the yield curve is starting to invert today. They said nearly 50% of the yield curve is inverted, and every time it hit 70%, it has been a recession signal.