A fascinating look at equity market returns over the past century or so and what value investors should heed from these lessons.
I recently came across a chart that shows 90 years of stock market returns year by year. And then I said, I thought I could combine that to a chart that shows the evolution of the stock market over over a more than 90 years, 120 years. And then I could make a great video showing what really matters when it comes to investing in value stocks. Where are we now and that will give you a perspective also where you are in your point in life and how the stock market can add value create wealth for you, or you are looking at the stock market it trying to make money, but actually to risk depending where you are in life and what are your financial goals. So let’s immediately start with the two charts.

Equity market returns - what the charts say
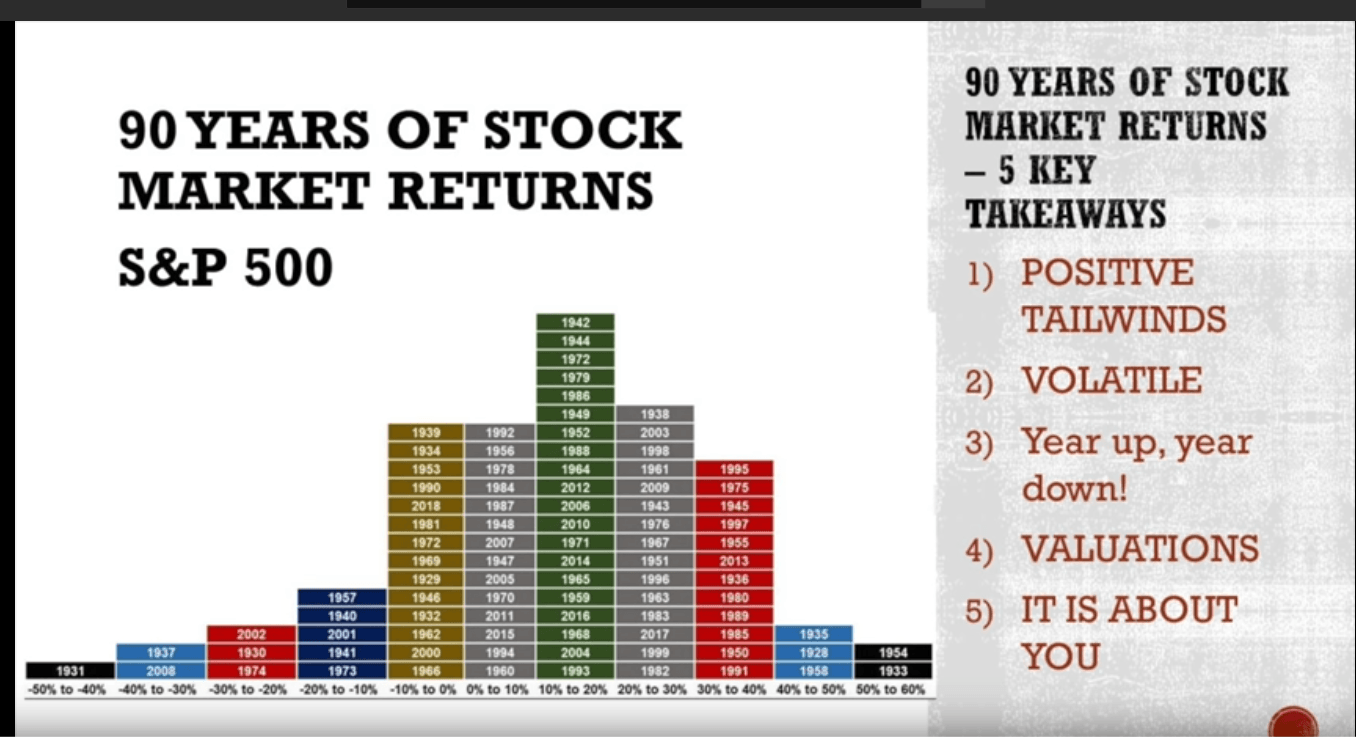
One chart is this 90 years of stock market returns s&p 500 and I wish to discuss positive tailwinds of stock market investing volatility, how it evolves year up year down here in year out The valuations and then how it is all about you and that we'll be discussing. also taking into account this chart from the Dow Jones, this is up to 2014. Now we are 29,000 up for from the 24,500 level there, but still very, very good historical lessons to be taken from the two charts. So let's start with the first chart we have year by year split of all the equity market returns over the past 90 years. And the key is that there have been 66 positive years and 25 negative years.
Markets are not zero sum
This means that investing in the stock market is a positive sum game, which means that if you do it smartly, you will win a lot you'll end up well of and you will gain very very much from investing in the stock market over your financial life cycle which is crucial when it comes to investing.
The Dow Jones index went from 16 Yes, one six points hundred 20 years ago to the current 29,000 something which is an insane a remarkable feature, especially as all the stocks that were in the Dow Jones index are not in it anymore, which means that even if things change and I'll make an update, update on how to invest in index funds, how to get take advantage of index fund investing, also for my stock market free stock market investing course that you can find the link in the description below. But I also upload those videos on YouTube.
Stock markets over the long run
So don't forget to subscribe and click that notification bell. So positive tailwinds is what we are talking about when it comes to investing. But you have to also keep in mind volatility, you have to expect that there is a 5% chance that you will see your portfolio go down more than 20% even to 50% in a year, and that there is a 10% chance that they will drop more than 10 percent in a year 50% down in a year is possible. However 50% or more up in a year is also possible, especially on individual stocks.
So keep always in mind, the volatility when it comes to investing year in year out, it doesn't really matter. The stock market will see later moves often in trends, and therefore it's very important to see okay, which trend are we in and later we'll compare it to valuations. 1930 was down 20 to 30% 1931 50 to 40%. If we look at 2016 was a positive year 10% to 20%, up 2017 positive year 20 to 30% of 2018 was a slower year, let's say at zero with the dividend and then 2019 was a great year with a 30% increase in the s&p 500 however, The stock market as I said usually works in trends.
Equity market returns and bubbles
And there have been 20 years of stock market returns nominal stock market returns being at zero, the last 12 years have been from the peak of the.com, bubble 1999 to 2012. Then stock market reversed and went up significantly before that from the 1960s till 1982 17 years of zero returns, and also 25 years of zero returns from the 1929 stock market bubble.
And this is something you have to keep in mind. But if you are a real investor, then things are again easy, because let's say you invest now, and over the next three years, the stock market crashes 50% many would be devastated. I was be happy because most of us especially the YouTube investor base are Net investors, which means that each month each year, we add money to the stock market, which means that the lower stock prices are, the higher our long term equity market return will be.
Market cycles good for long term investors
And that's a win situation. If you invest now and stocks go continue to go, go go up, up and up. It's again a win situation. It's always a win win situation, but you have to apply common sense and invest properly. So dollar cost averaging, some might call it but if we constantly add investments over our investment lifecycle, then stock market is a win win situation. So the key thing to really keep in mind is that we buy businesses we accumulate wealth over the long term, Long Term Life Cycle.
And when stocks go down or are down, you buy things on a discount, that will increase your investment returns, and then on the discount, a good thing to watch our value This is the cyclically adjusted price earnings ratio that shows the average 10 year earnings in relation to the price of the stock market.
CAPE ratio by year
So, in 1929, the cyclically adjusted price earnings ratio was above 40. Now it's at 31. Also, it was about 40 during the.com bubble, and if you look at the long term returns afterwards, those weren't that good. So there is a pattern when it comes to investing related to valuations, as I said, 2001 2002 and then also 2020, the price earnings ratio is 32.
So the stock market from a historical perspective is very, very risky. But if the valuations are down like it was the case in 2009, with the price earnings ratio of just 14, that implies a seven 8% equity market return.
That is what we enjoyed over the last 10 years. So valuations really, really matter when it comes to investing also if you compare the valuations very low in the 1930s, very high in 1929. Subsequently those that invested in 1932 did much much better than those that invested in 1929 similar situation 1960s similar to thousands and similar later, the key is that you have to always implement all the ifs when it comes to the stock market, what would I do if my portfolio crashes 50% next year, it is a possibility.
Therefore, you have to keep that in mind when it comes to investing. If you know exactly what you will do, you are an investor and you are ready to invest in the stock market if my portfolio crashes 50% next year, I have my 70% cash allocation at the moment 17% cash allocation I will deploy that probably take some margin depending on the dividend deals and what's going on with the businesses.
Asset allocation
I own if it goes up another 50% I'll probably look at what are my other Investing Options with lower valuations and then switch on to debt. So if you know all your IPS, and this chart shows whatever can happen in the stock market, you have to be ready for anything. And this is the beauty of this chart. You have to see how this fits your current financial situation. And if there is a scenario that you can't weather from your current financial situation, then the answer is pretty simple.
Don't invest because it's too big of a risk. And usually people do the wrong thing at the wrong moment in time. If you can handle this 25 years at zero and add money during those 25 years. And that will give you greater returns, then you shouldn't be investing in stocks at all.
I'll tell you a very important story when I was a accounting professor at the Amsterdam Business School, a former colleague or colleague of mine, also finance Teacher He sold He has been accumulating 10 years prior, he sold in 2008. And this is the Amsterdam Stock Exchange index. And we spoke in 2015 2016 sorry, and then he started to slowly go back in with what was left of his money.
Equity market returns: Conclusion
But he lost a huge amount of money when selling and he sold at the wrong time because he couldn't watch his portfolio deteriorate over that time, the poor guy lost probably more than 25% of his life cycle wealth, because he saw that the wrong moment in time, he was panicking watching those stock prices instead of buying more of good businesses or knowing what he was holding onto.
He sold in panic late October 2008 and then didn't returning to the market till 2015 16 slowly starting to get them back into the market, the loss if he will just have reinvested the dividends back then he would have a huge return, which would now would be 50%. And more of his net wealth, making the right financial decision over a long period of time, at that moment when those moments like 2008 calm is crucial, and therefore, you have to keep all the ifs in mind, and what you would do when those ifs come and by looking at the stock market history, you learn what can happen and how you would and how you would react to that and be prepared. That's the key when it comes to investing in the stock market.
The second key is, of course, subscribe to this channel, click that notification bell so that you don't miss any videos that might add value to your financial life to your financial decision making where the mission of this channel is to help you make better financial decisions in time.


