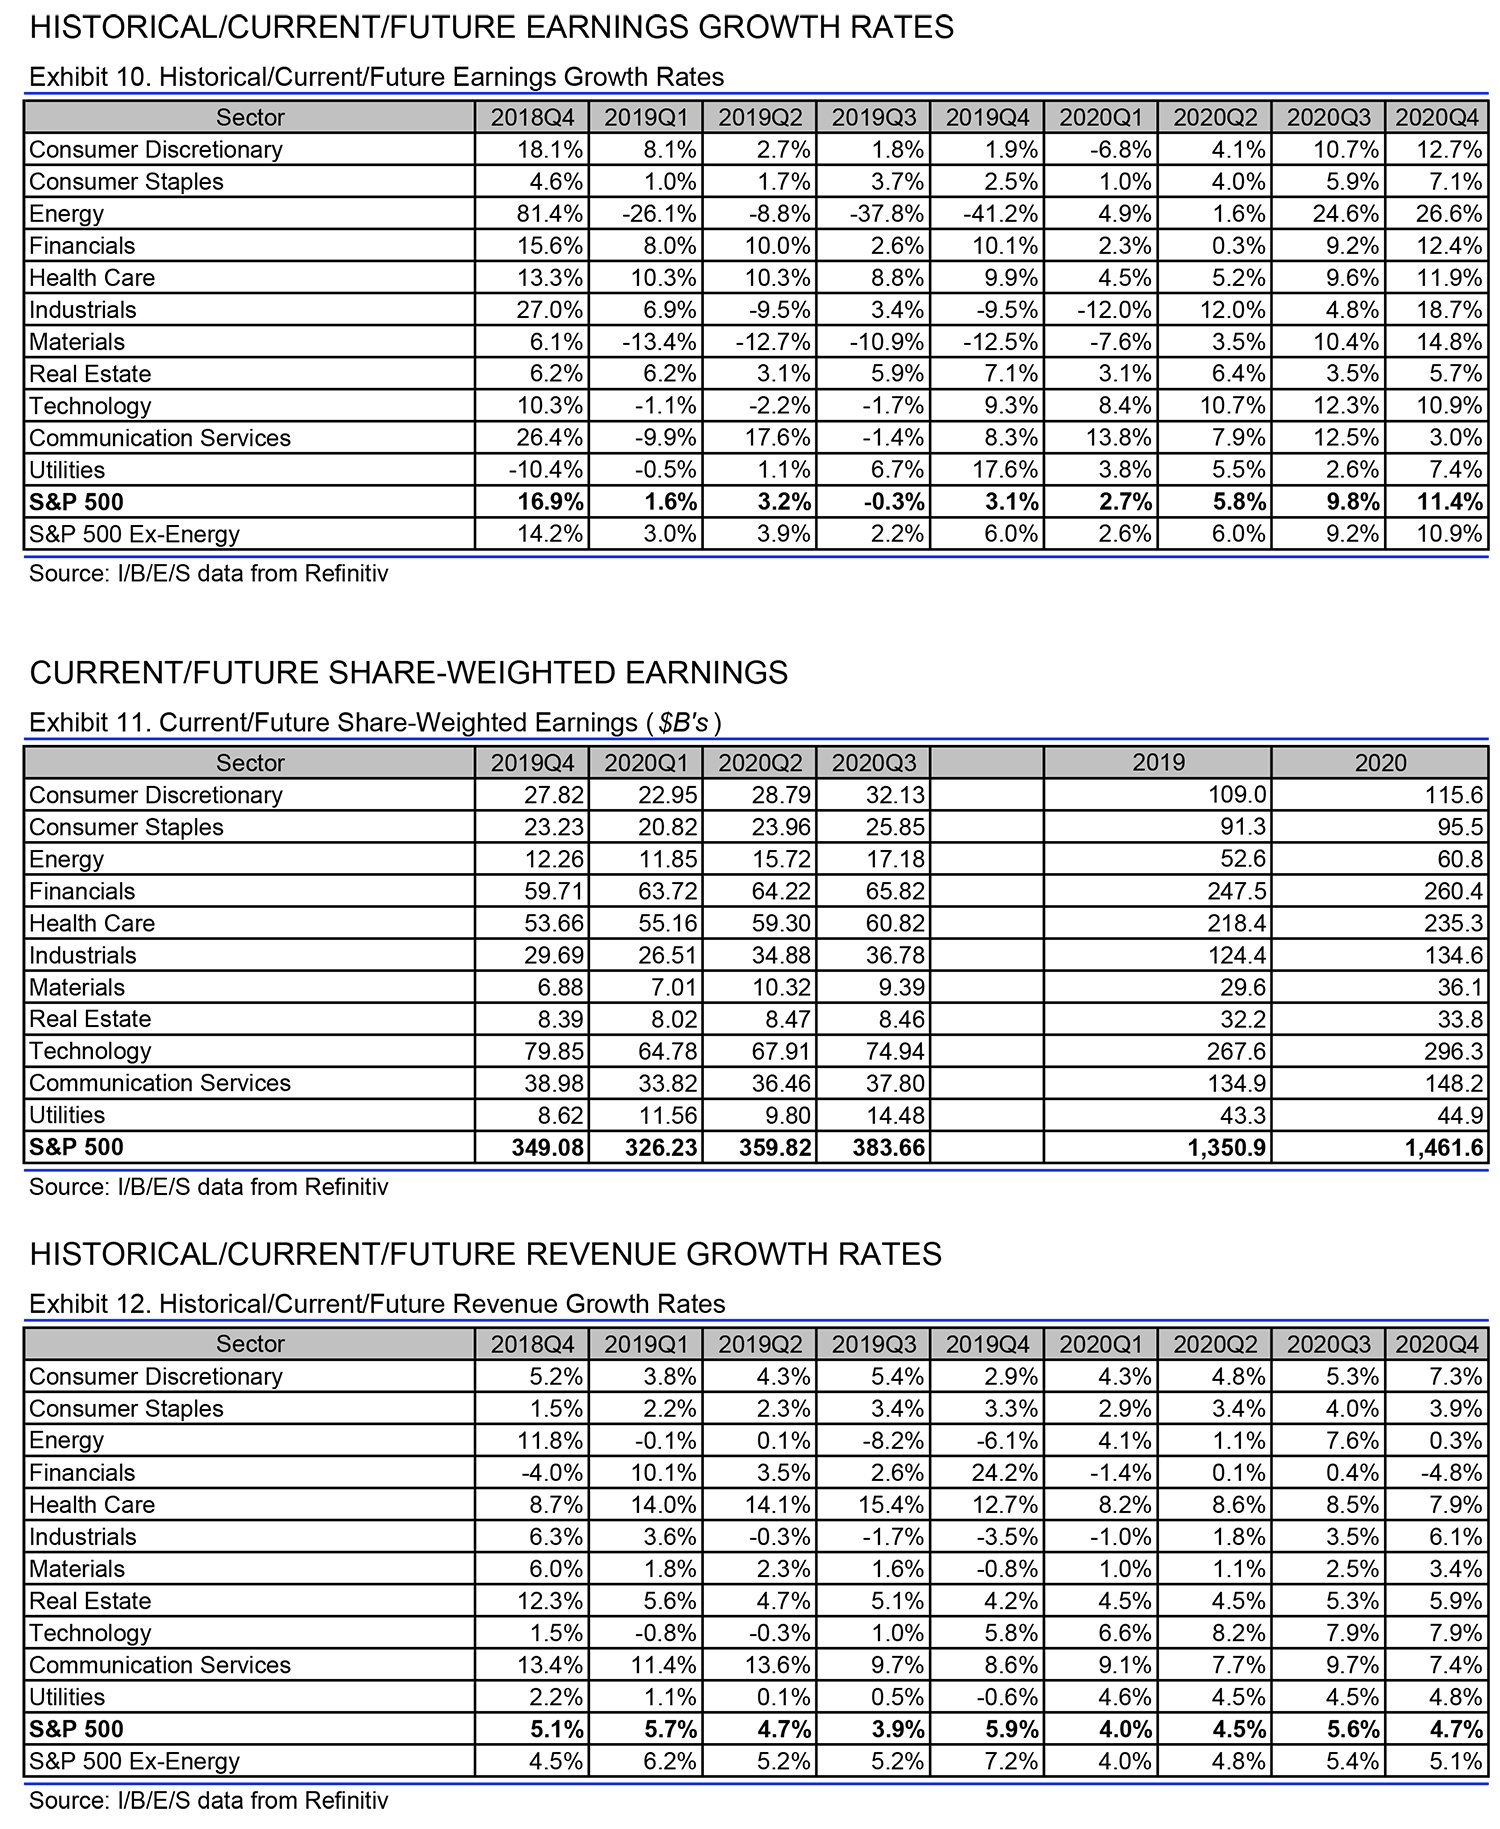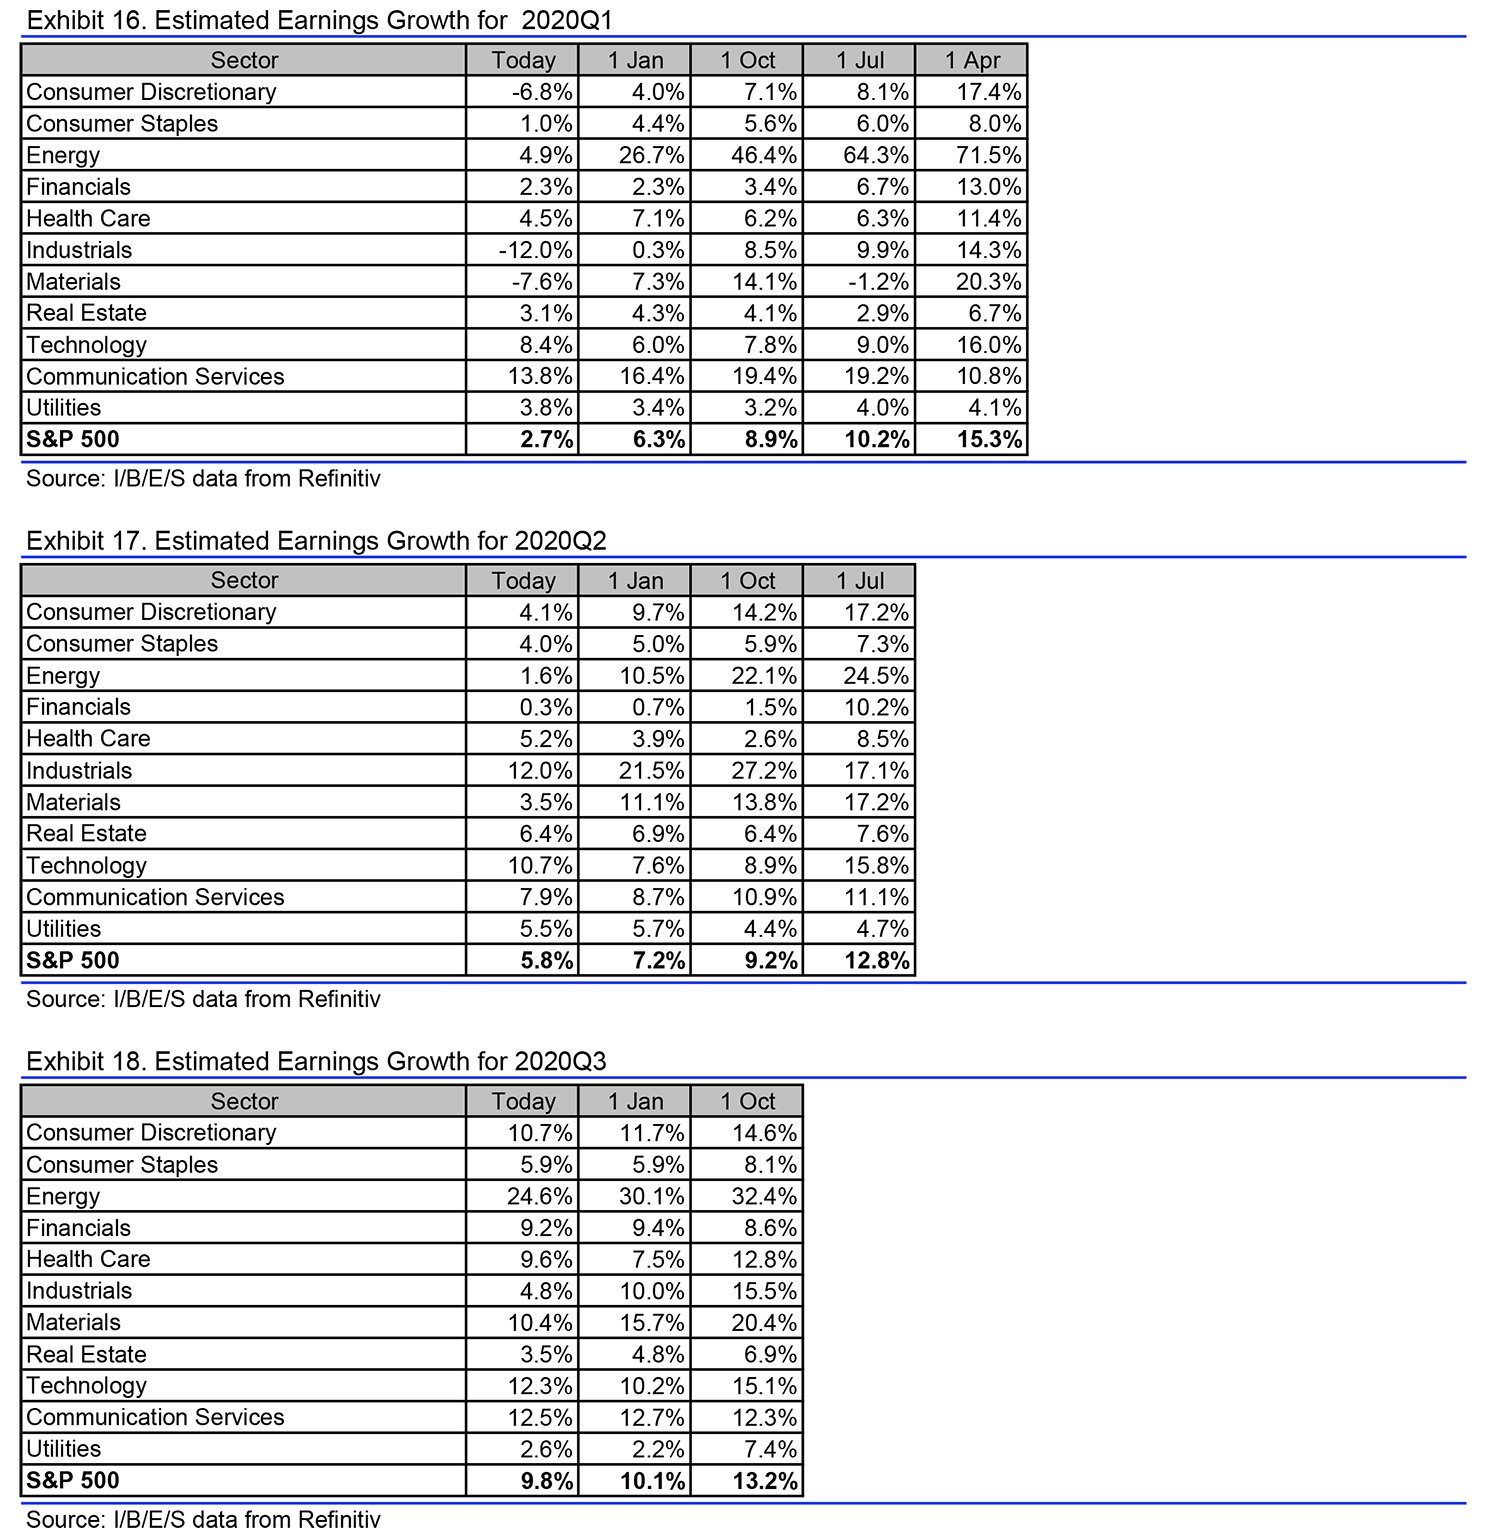
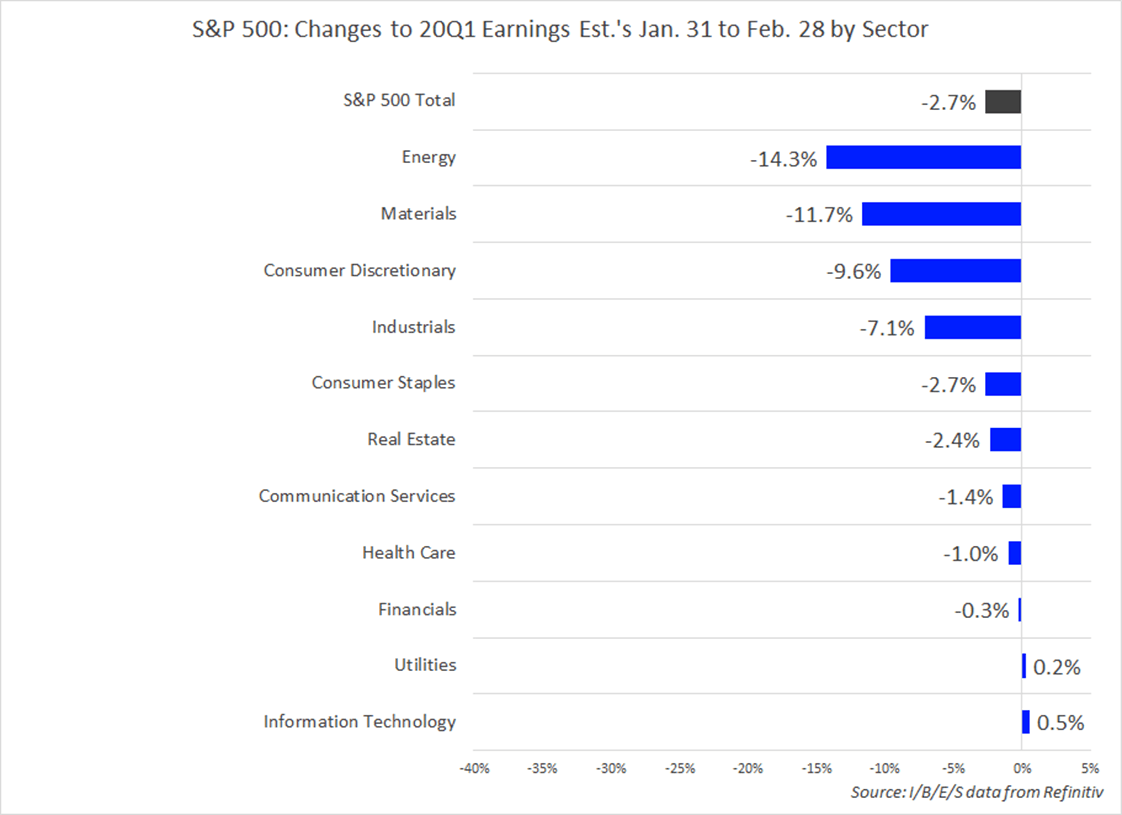
“As the coronavirus spreads to new areas analysts have been cutting their 20Q1 earnings estimates. As a result, the S&P 500’s 20Q1 earnings estimates have fallen 2.7% since Jan. 31, bringing the expected Y/Y growth rate to 2.7% from 5.4% on Jan. 31. This 2.7 percentage point decline in the first quarter growth estimate exceeds the typical 2.3 percentage point decline seen between the start of the quarter and the start of earnings season, and there is still one month left before the 20Q1 earnings season begins.
Steep declines in commodity prices following the coronavirus outbreak are expected to impact the energy and materials sectors, which have seen their 20Q1 earnings estimates come down 14.3% and 11.7% since Jan. 31. Travel and supply chain disruptions are expected to have notable impacts on 20Q1 earnings for the consumer discretionary and industrials sectors, as a result, since Jan. 31, analysts have reduced their first quarter estimates for the two by 9.6% and 7.1%, respectively,” comments David Aurelio, Senior Manager, Equity Markets Research, Refinitiv.

Q4 2019 hedge fund letters, conferences and more
Daily Earnings Update - S&P 500 Earnings Scorecard: Friday, 2/28/2020
Today’s Highlights:
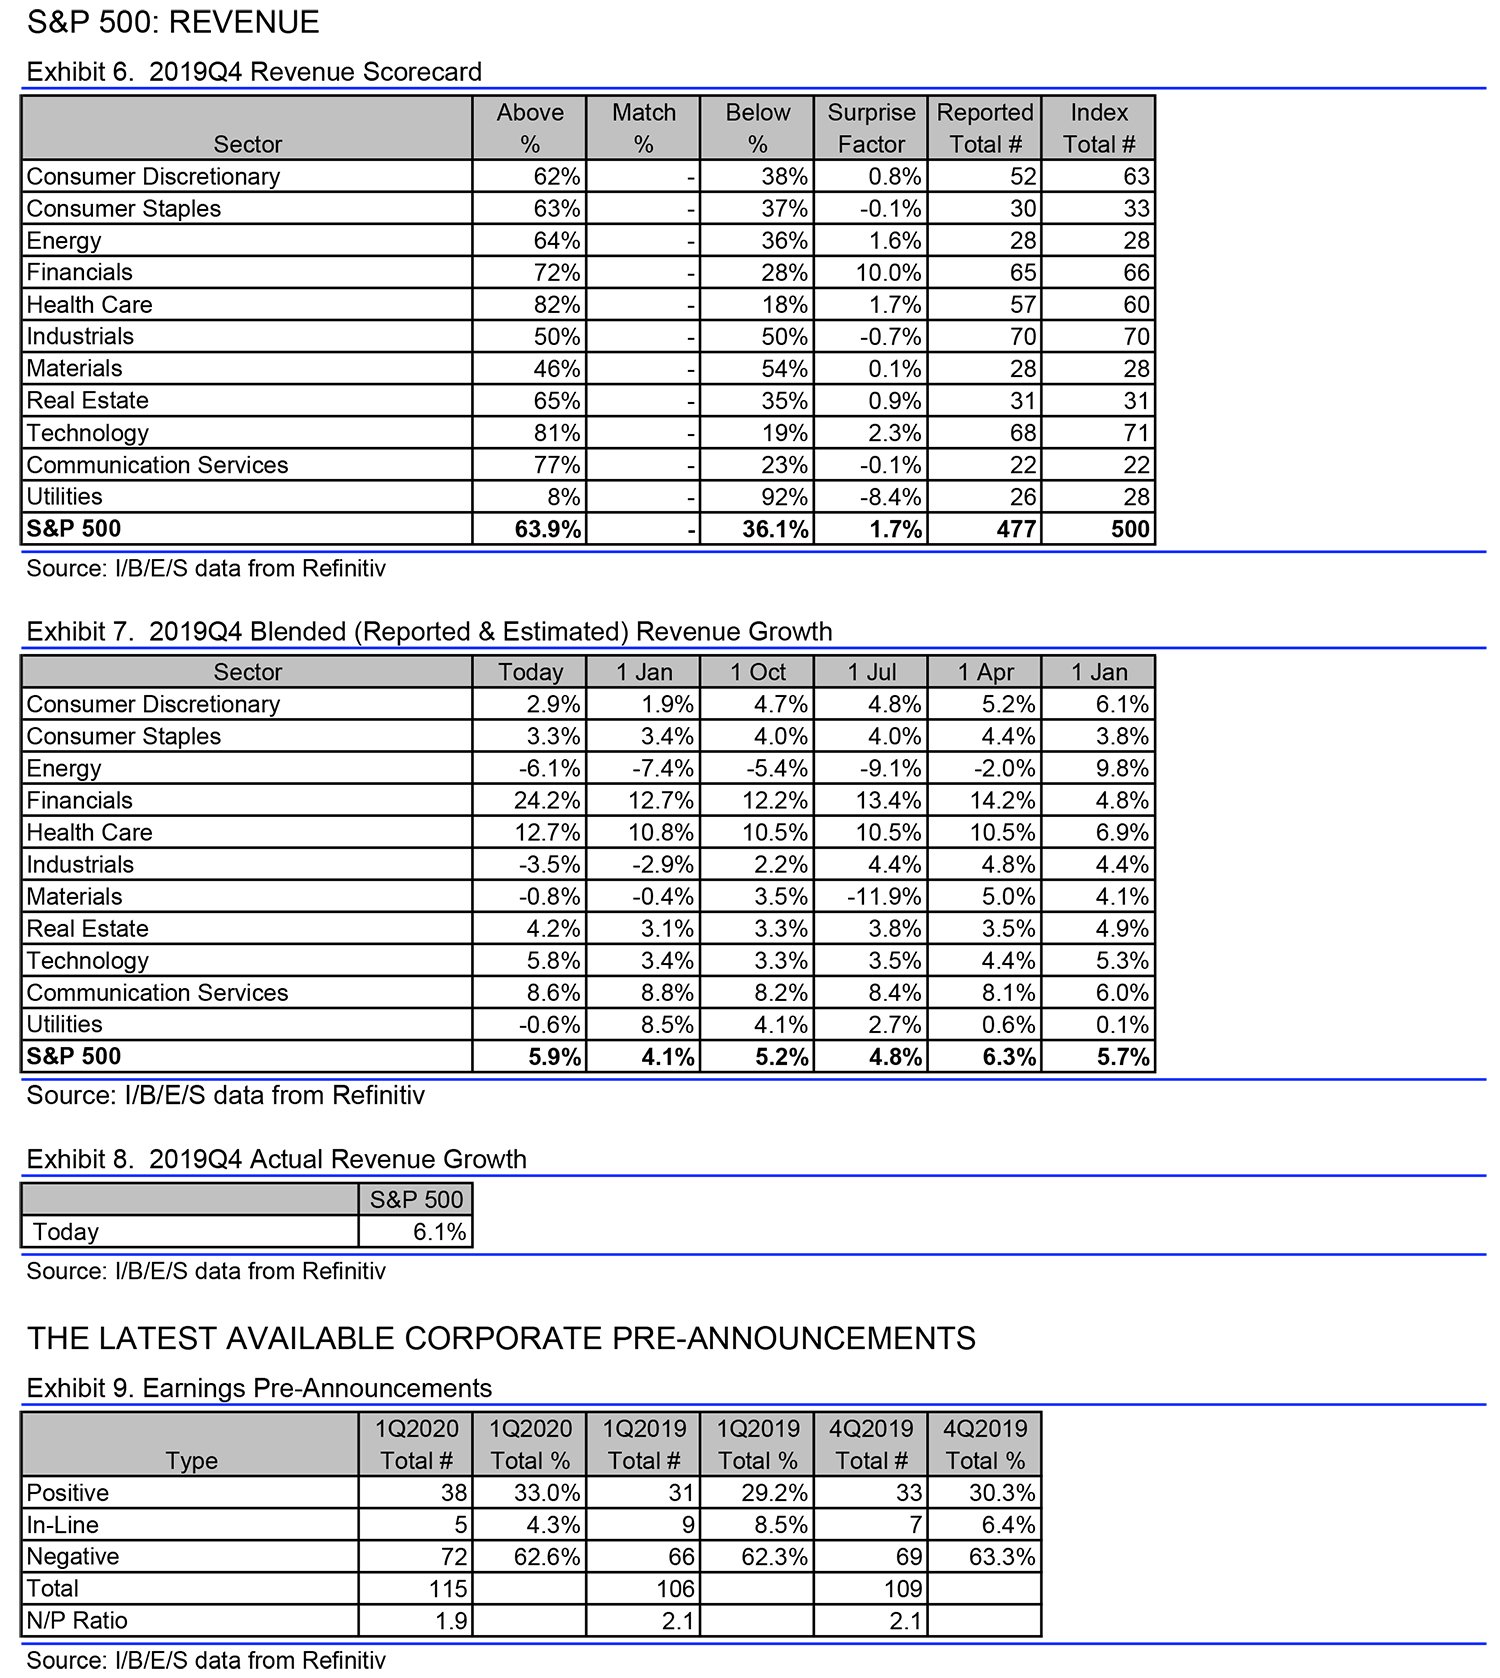
- Guidance: For 20q1 earnings, there have been 72 negative EPS preannouncements issued by S&P 500 corporations compared to 38 positive, which results in an N/P ratio of 1.9 for the S&P 500 Index.
- This N/P ratio of 1.9 compares to a long-term average (since 1997) of 2.7 and prior four quarter average of 2.8.
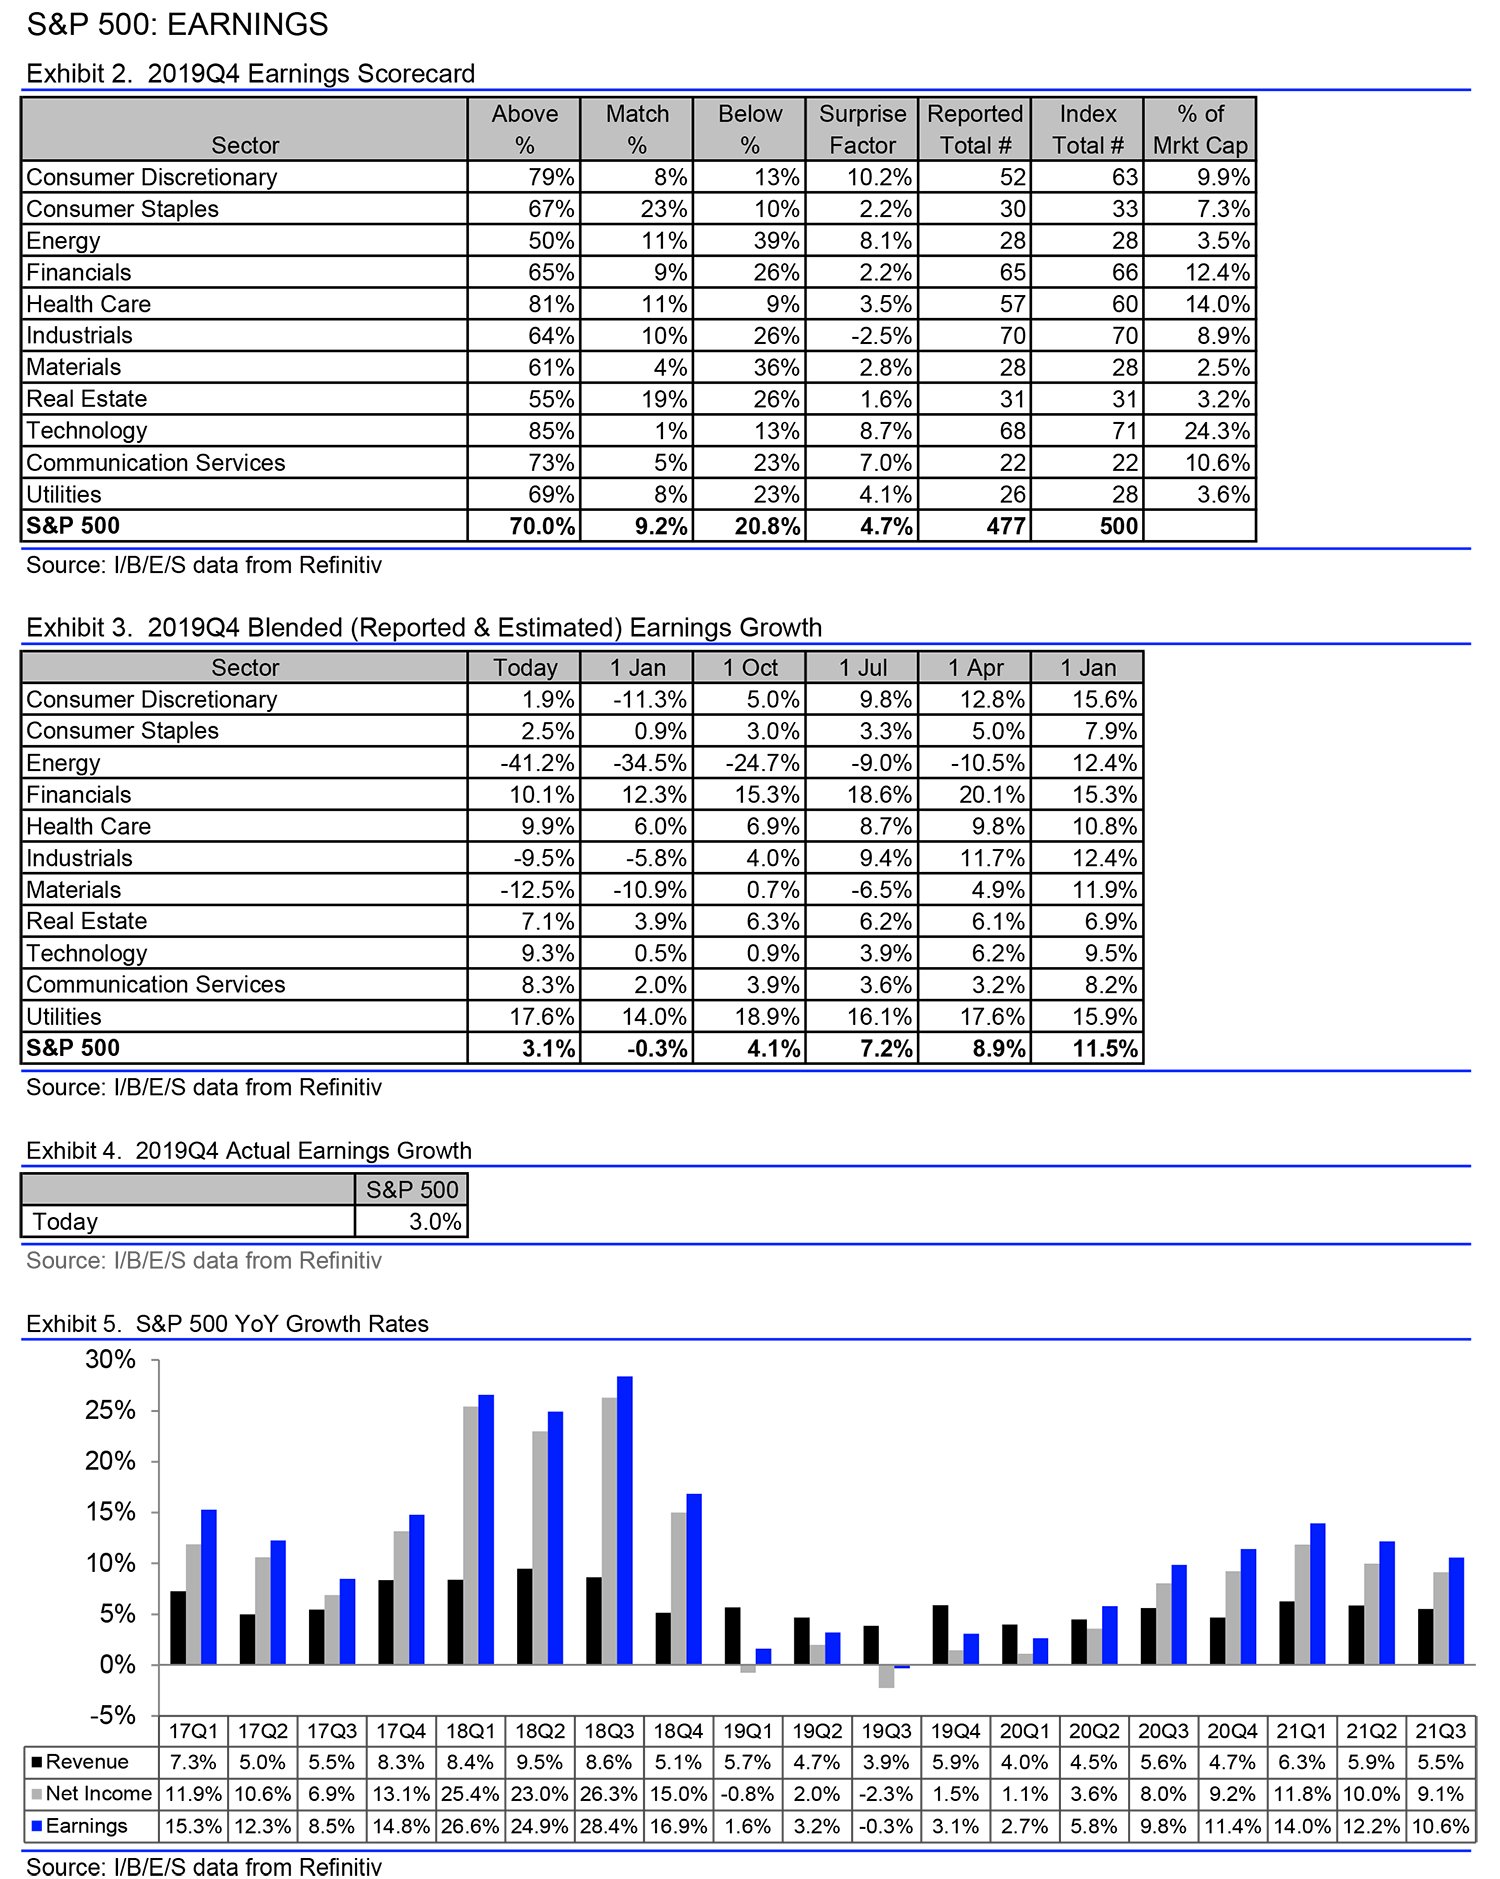
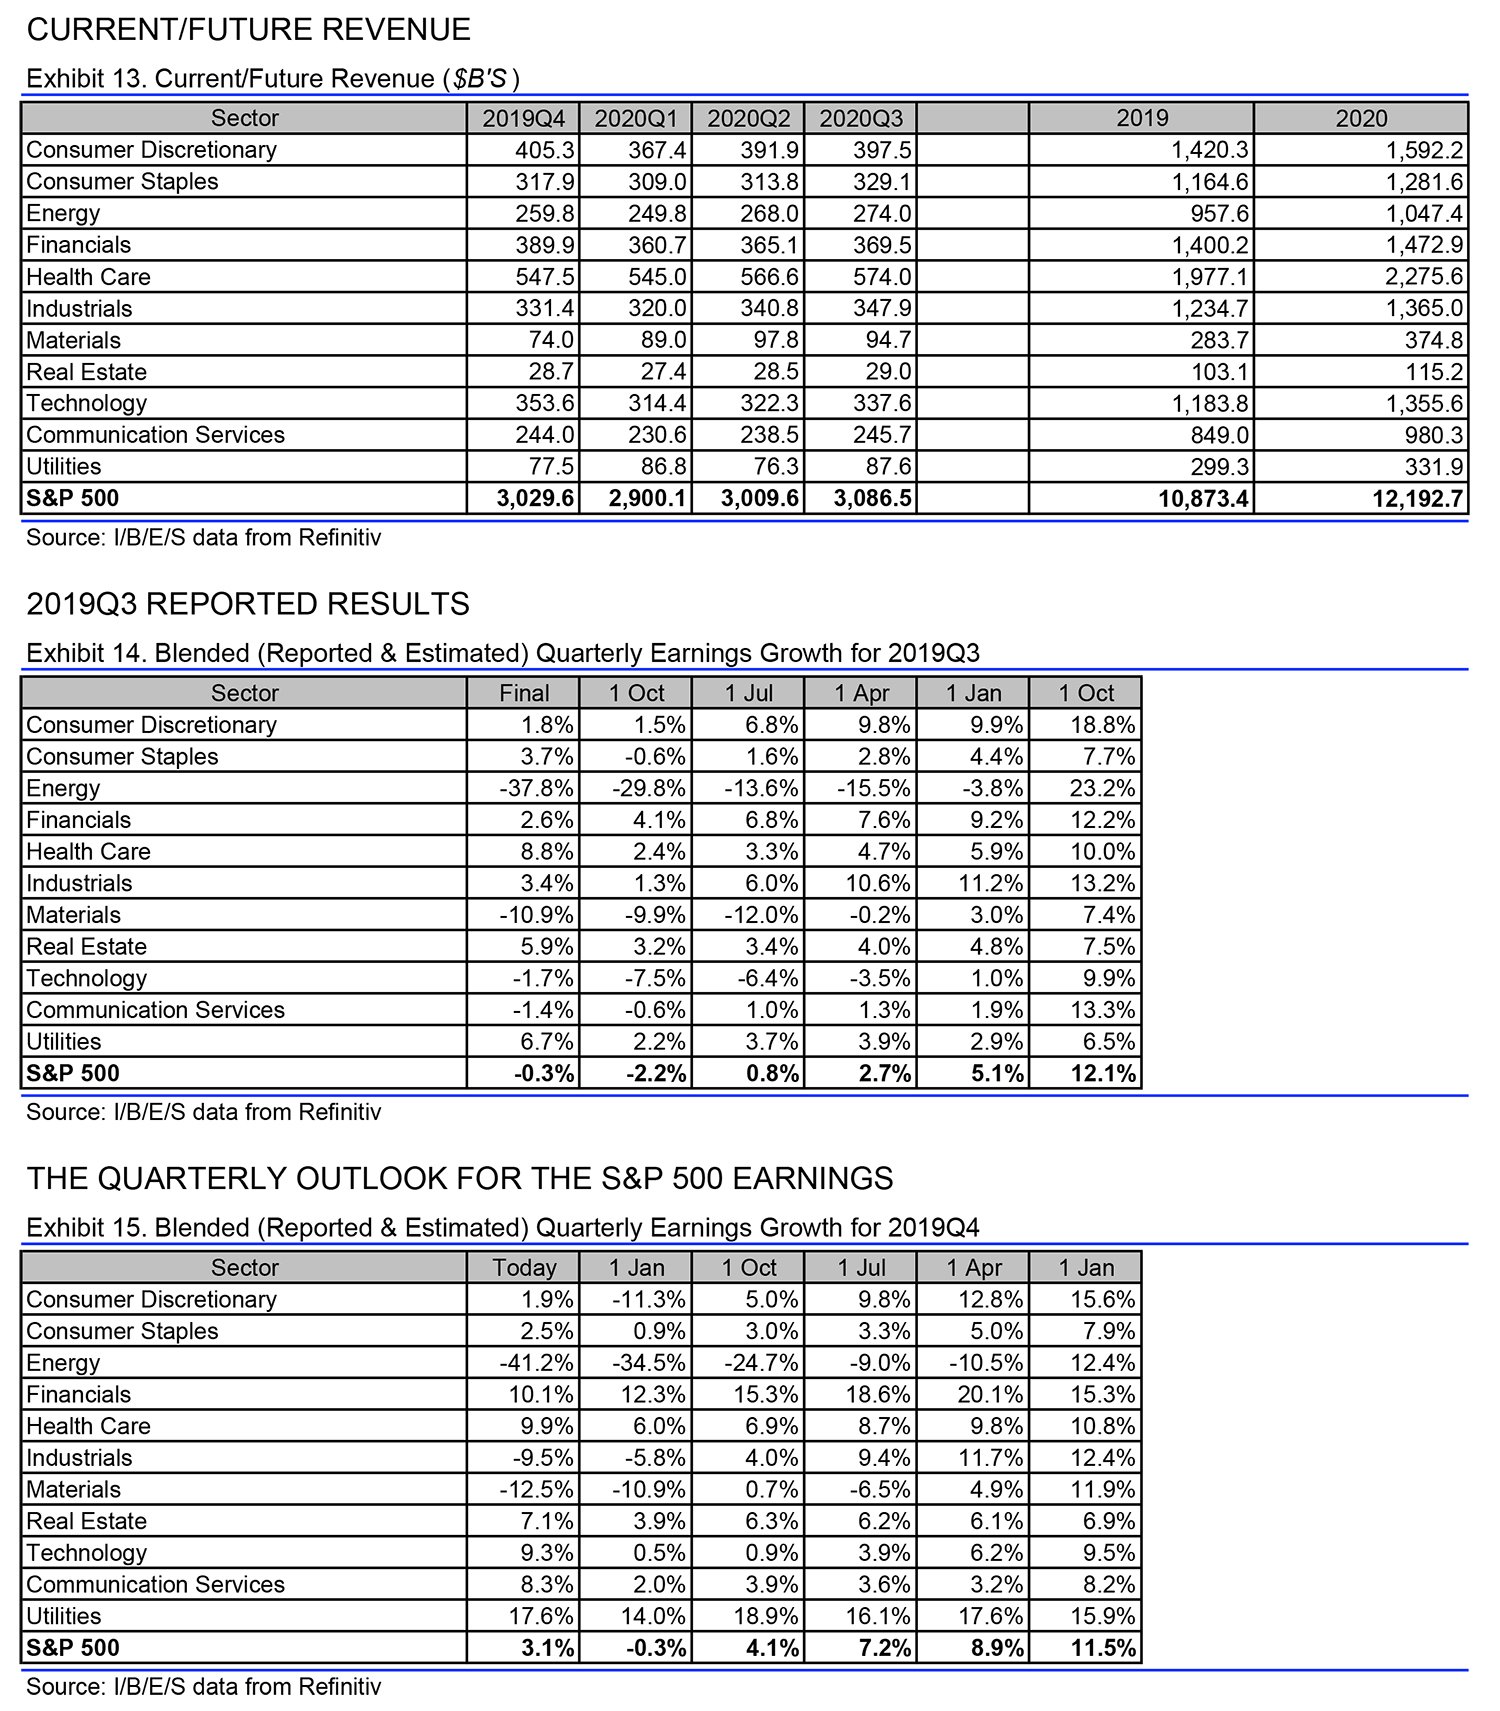
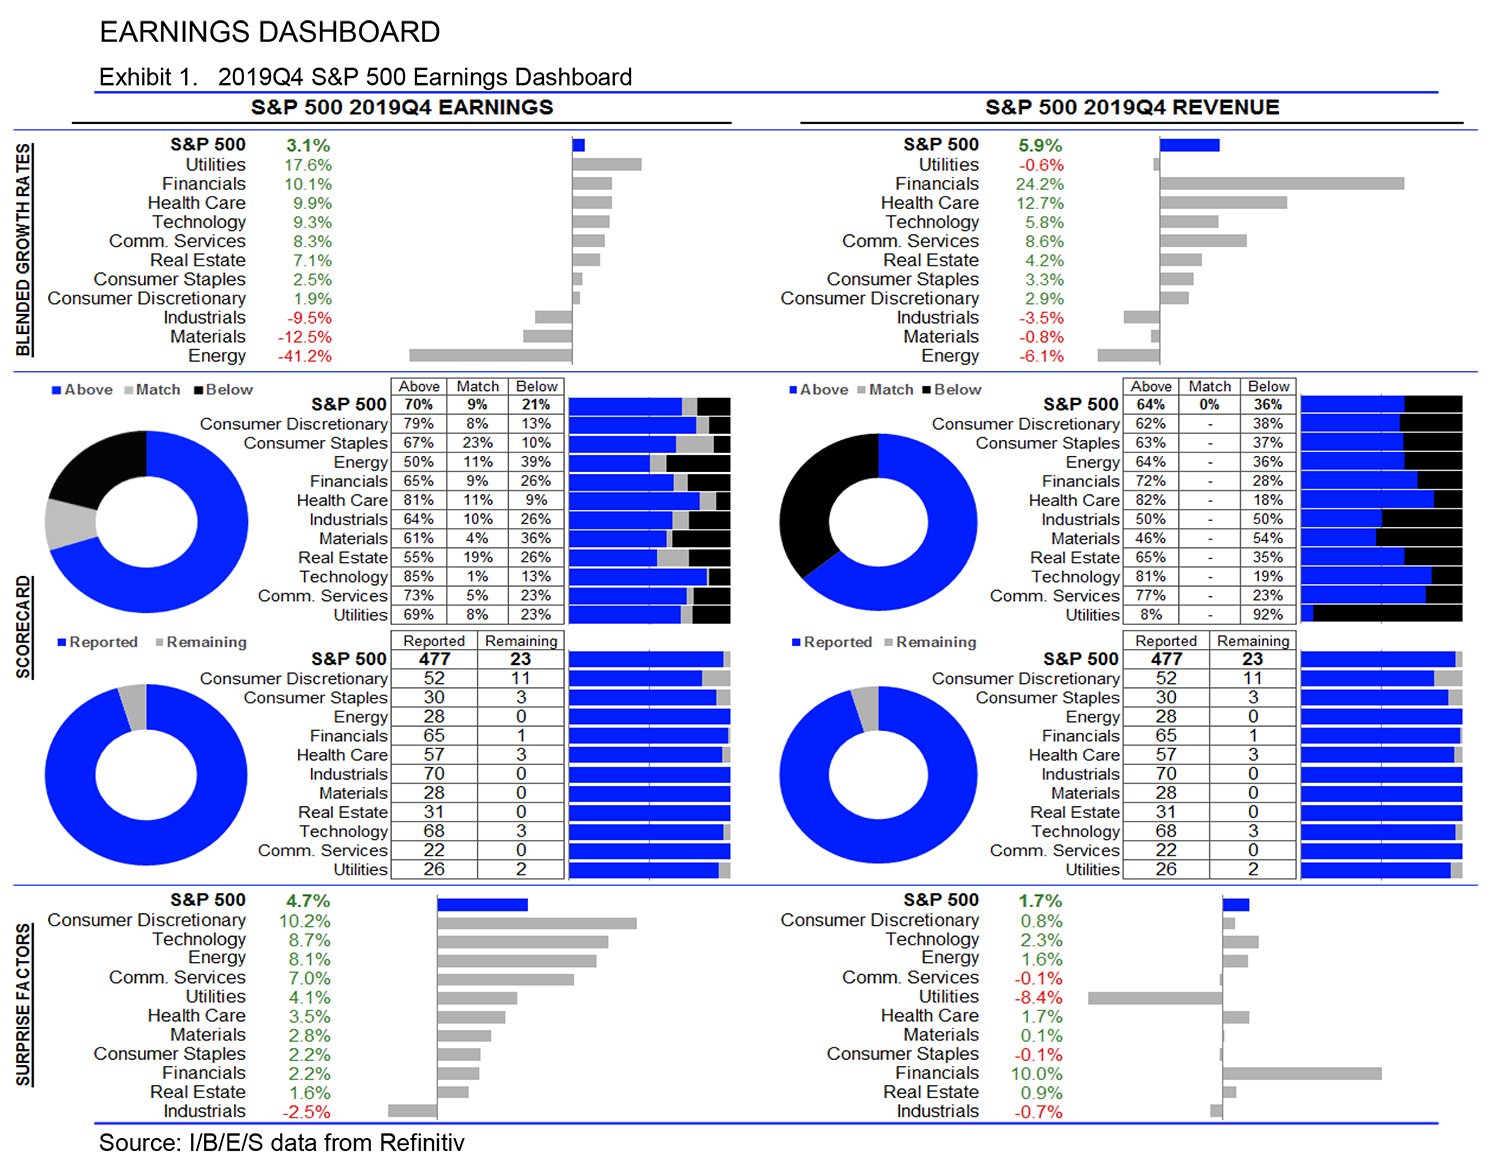
- Earnings: The 19Q4 Y/Y blended earnings growth estimate is 3.1%. If the energy sector is excluded, the growth rate for the index is 6.0%.
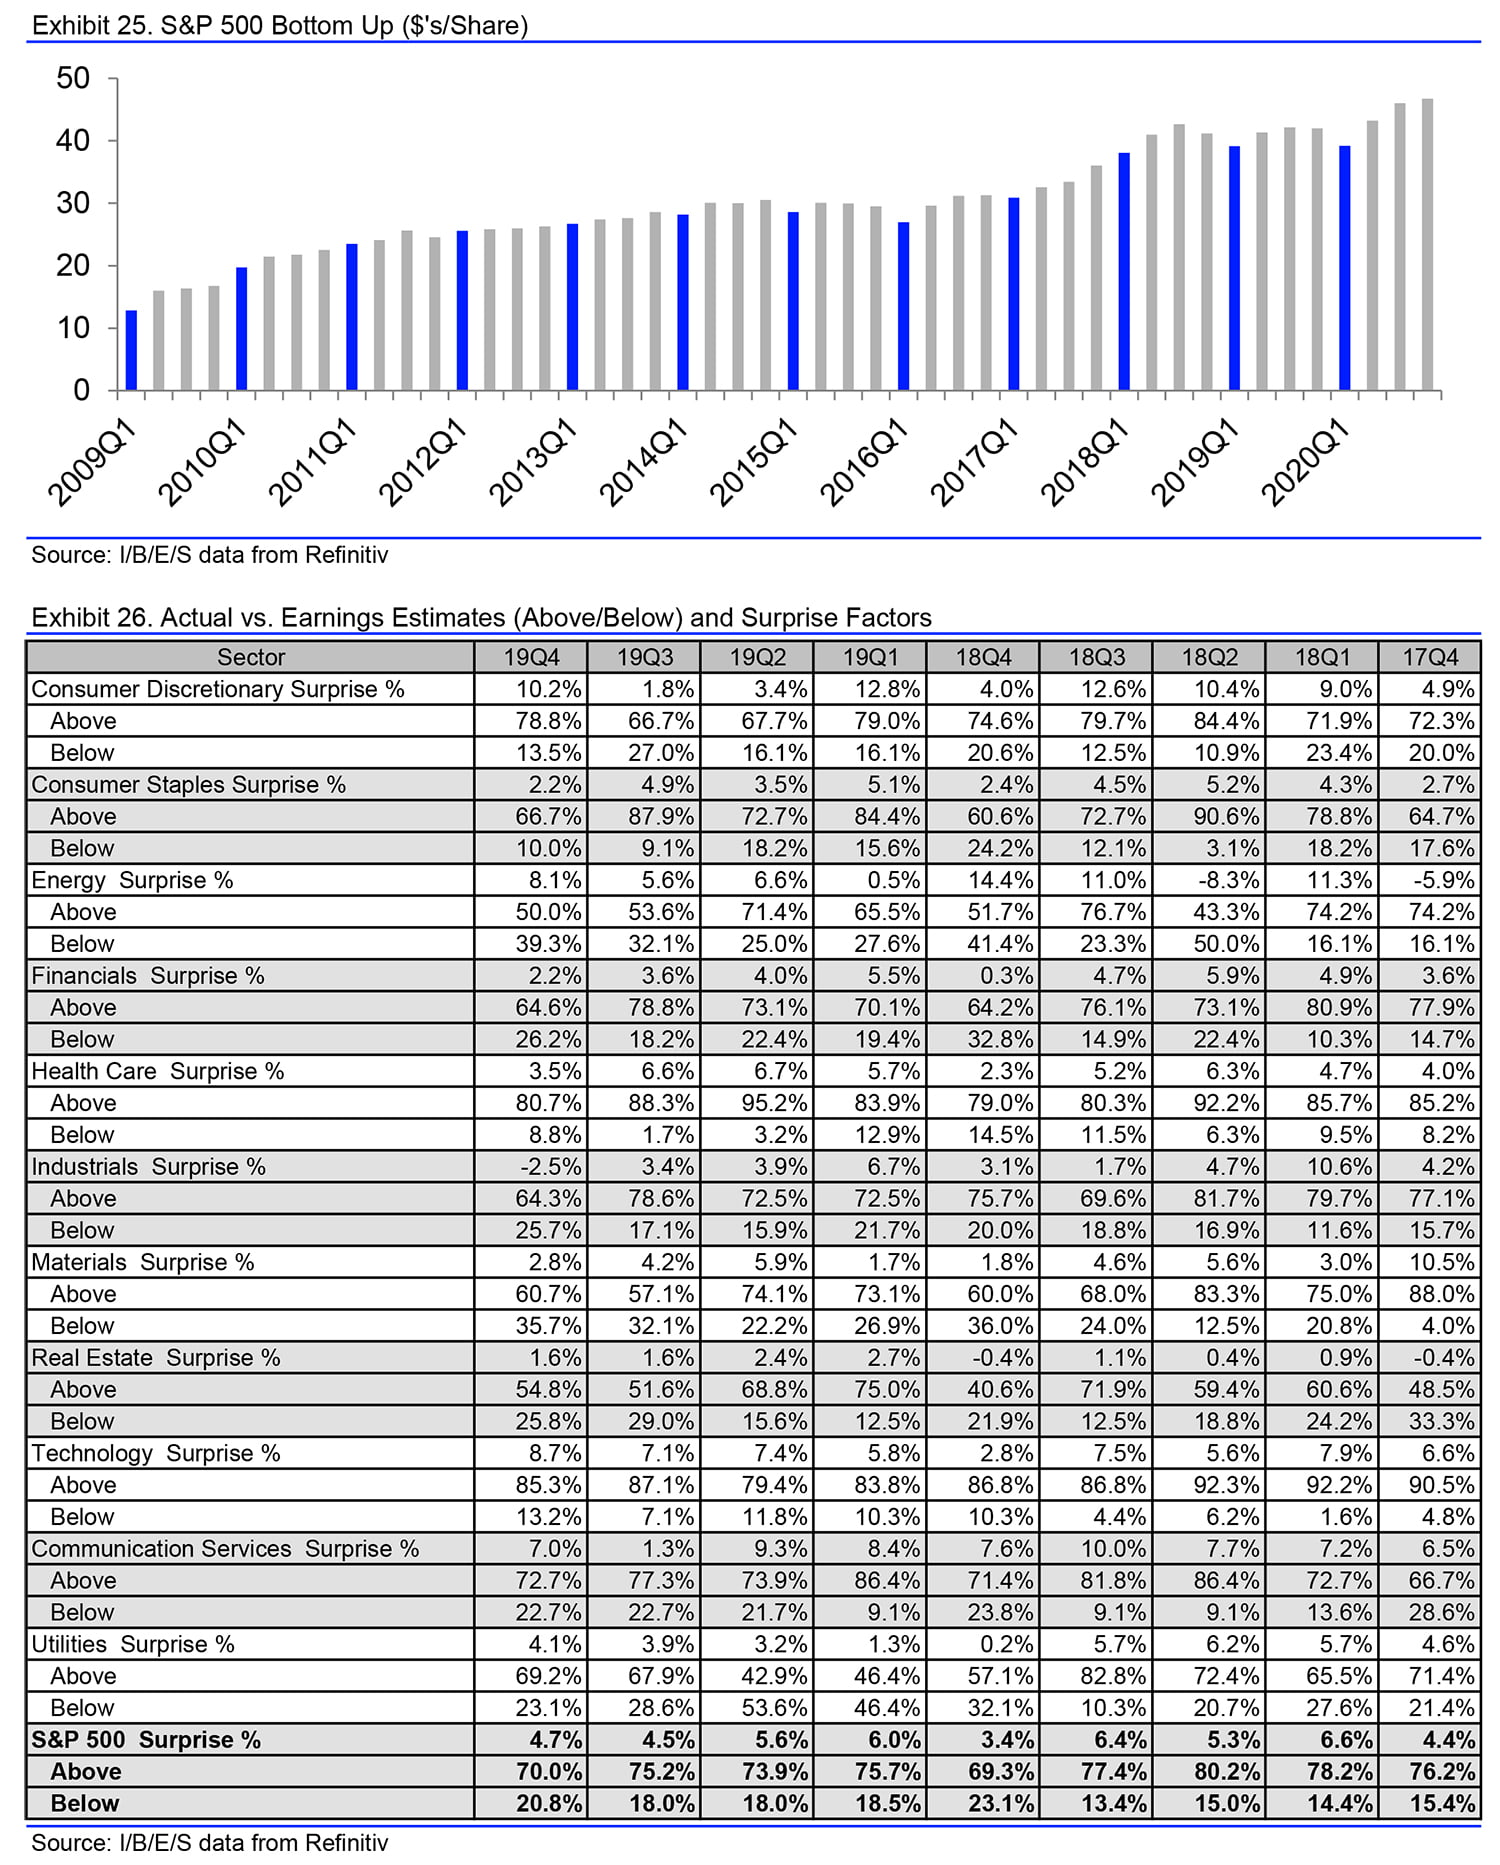
- 19Q4 Performance vs. Earnings Expectations:
- Of the 477 companies in the S&P 500 that have reported earnings to date for 19Q4:
- 70.0% reported above analyst expectations
- 20.8% reported below analyst expectations
- Of the 477 companies in the S&P 500 that have reported earnings to date for 19Q4:
- Historical Average Performance vs. 20Q1 Earnings Expectations:
- In a typical quarter (since 1994), 65% of companies beat estimates and 20% miss estimates.
- Over the past four quarters, 74% of companies beat estimates and 19% miss estimates.
- 19Q4 Performance vs. Earnings Expectations:
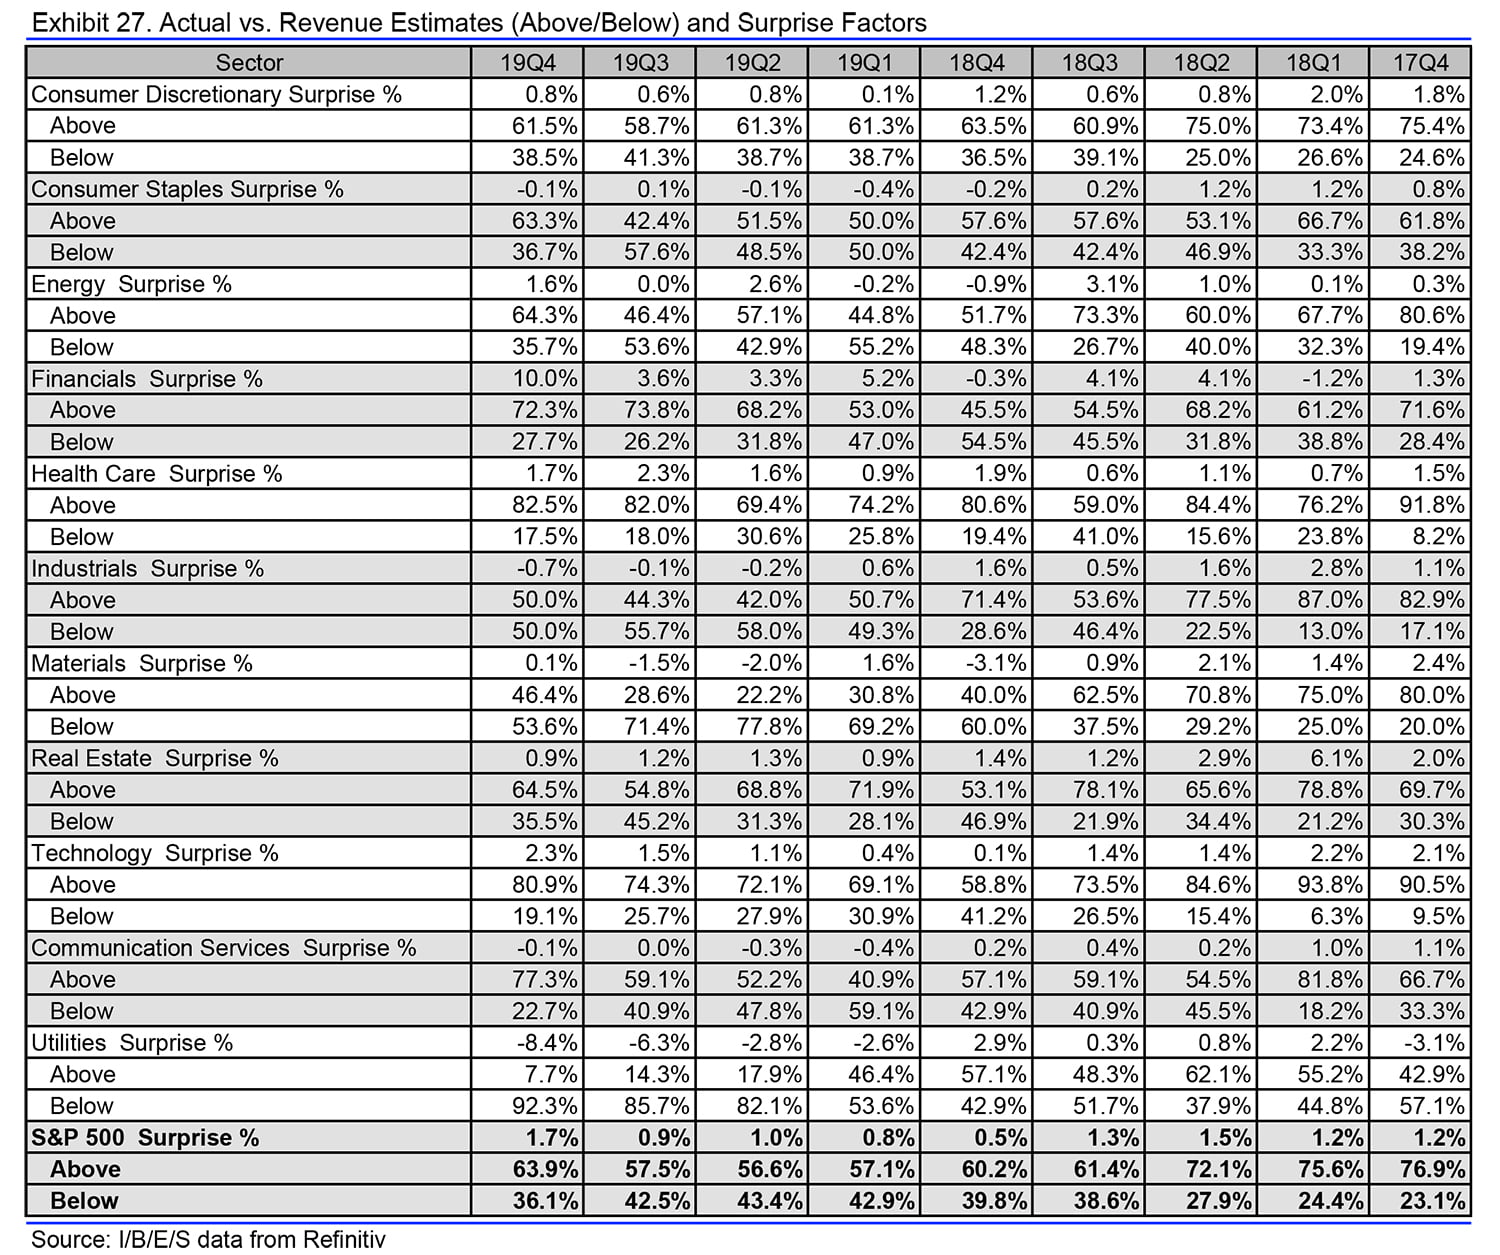
- Revenue: The 19Q4 Y/Y blended revenue growth estimate is 5.9%. If the energy sector is excluded, the growth rate for the index is 7.2%.
- 19Q4 Performance vs. Revenue Expectations:
- Of the S&P 500 that have reported revenue to date for 19Q4:
- 63.9% reported above analyst expectations
- 36.1% reported below analyst expectations
- Of the S&P 500 that have reported revenue to date for 19Q4:
- Historical Average Performance vs. Revenue Expectations:
- In a typical quarter (since 2002), 60% of companies beat estimates and 40% miss estimates.
- Over the past four quarters, 58% of companies beat estimates and 42% miss estimates.
- 19Q4 Performance vs. Revenue Expectations:
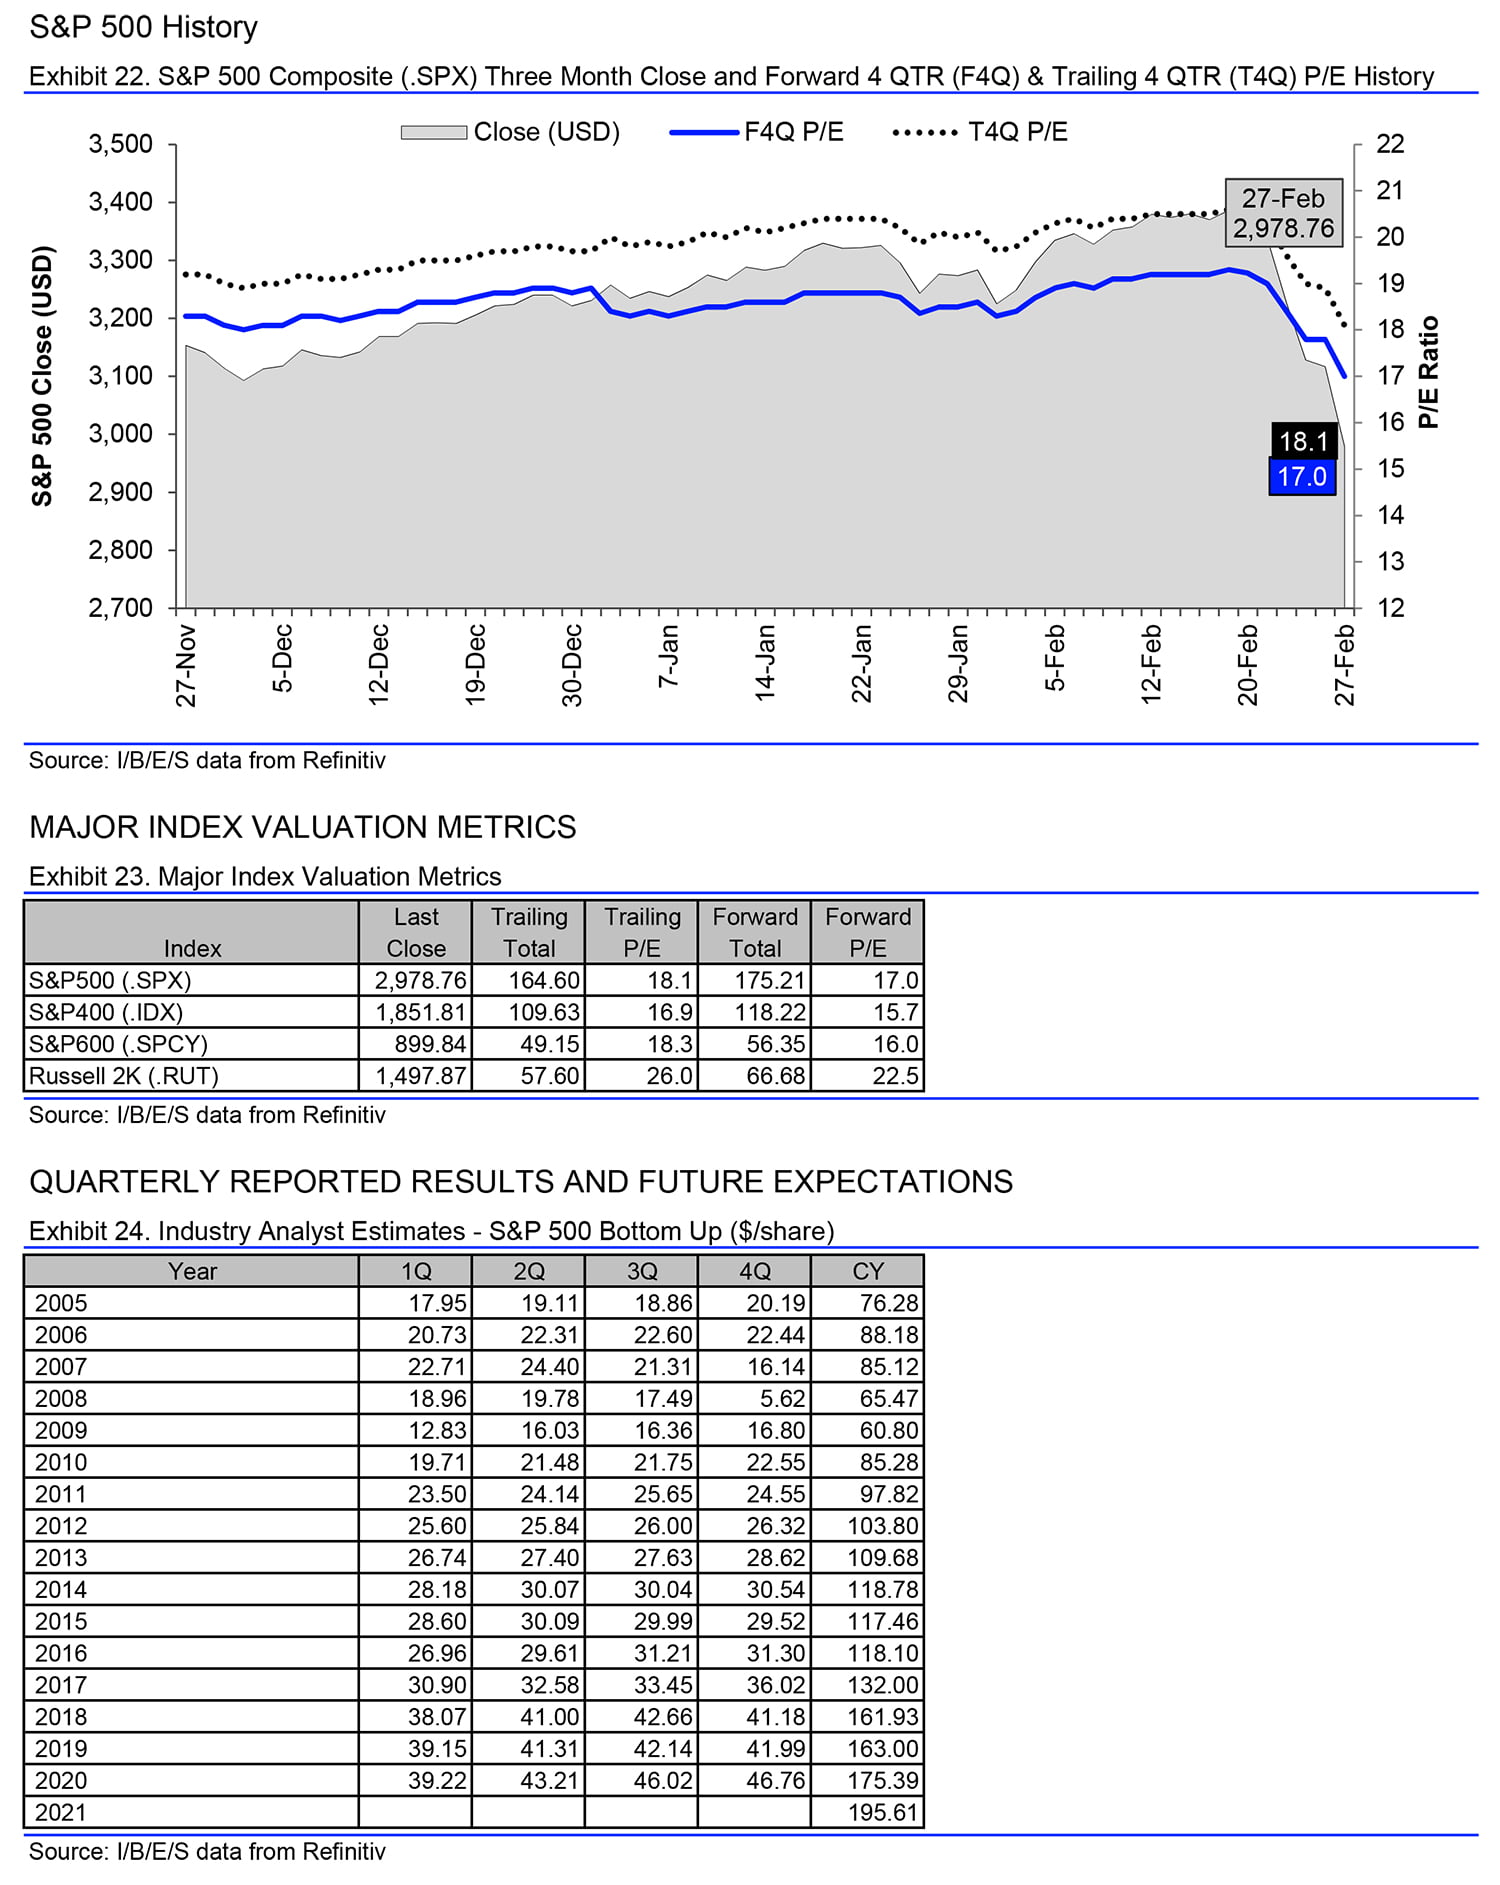
- Valuation: The forward four quarter (20Q1 – 20Q4) P/E ratio for the S&P 500 is 17.0
S&P 500 20Q1 Earnings Estimates
Aggregate earnings and revenue performance vs estimates
The S&P 500 Earnings Scorecard is the most comprehensive and up to the minute compilation of aggregated earnings growth and market intelligence covering the companies included in the S&P 500 Index.
This report combines I/B/E/S's unrivaled historical earnings database, in depth coverage of Wall Street analysts' bottom-up corporate earnings estimates, and the analytic capabilities of the Proprietary Research group and desk-top solutions.