In this video, hedge fund managers, Kevin Smith and Tavi Costa, share their reasons why Crescat is short China and the debt that the Chinese property developers have accumulated.

Q4 2019 hedge fund letters, conferences and more
Another Reason To Short China: The Net Debt Of The Chinese Property Developers
Transcript
What's important here, which is key is you don't have to make a call on inflation at all. In this situation because gold and silver and precious metals overall are so undervalue, historically speaking, that you know, it's just such a an incredible, safe haven asset that can outperform incredibly well if if this downturn really unfolds, but this is another way to look at the silver, which in our view, is probably the cheapest macro asset in the world today, financial markets today. And it's just looking at silver relative to the Russell 3000.
So a broad way of looking at equities here in the West and you can see here, you know, it's great when you can align macro with fundamentals because we're value investors at first and foremost, and now also, we like to look at macro in a huge way, but when you can align the two with technicals, that's key and here you have a pretty much a double bottom, historically for this ratio, it looks incredible. Just started rising, in our view this looks a lot like the the setup that we had in early 2000s a very early stages of a large move in silver.
And then when we look at the the gold and silver mining stocks would as measured by the Philadelphia XAU index and we look at that relative to gold itself. What we see is that we've been in a bear market for mining stocks now, really for a decade relative to gold itself and normal normally when you see gold going up, you think gold mining stocks, well, they're going to have high beta to gold. And that's where you can get the outperformance and that can be very true. And we think it's about to become very true. We saw it start to work in in in 2015 or I mean early 2016 where you can see this chart bottomed at that time and we had we had some silver stocks that were up to 300%. And we've pulled back and we've kind of broken out here recently.
So at Crescat we are value investors, we're macro investors like Tavi just said. But we're also stock pickers and, and we have done a deep dive on the, on the mining industry. And we've talked to probably 50 different management teams over the last couple of quarters here. And we are really excited about the portfolio of mining stocks that we have in most of our strategies today.
Now, we're going to shift a little bit to talking about about one of the third lakes of the macro trade of the century. And that's China, we believe that China is the biggest debt bubble in global financial history. And, and it's one that is starting to burst and now when we look at prior debt bubbles like Japan and 1989 for instance, with which is shown here, what you see is that that you tend to see private non financial debt, which means household and corporate debt, as a percentage of GDP tends to reach an unsustainable level.
It happened in other countries that you know, before that Asian financial crisis and the housing bubble, and you know, as shown here in this chart 2 but the three big, private non financial debt to GDP bubbles that we see in the world today are really China, and then other other, you know, fairly big countries, Canada and Australia as well. But the biggest bubble by far is China.
And we we think, honestly, it's an outright Ponzi scheme, and that is because they have grown their banking assets at an impossible to believe 400% of growth rate over the over the last decade since the global financial crisis. Compare that to Japan, the US the Eurozone. In this chart here we see how big those banking systems have grown. This is the miracle story of China is this as the growth is has been, to whatever degree it's been caused, it's been caused by the impossible growth of their banking assets.
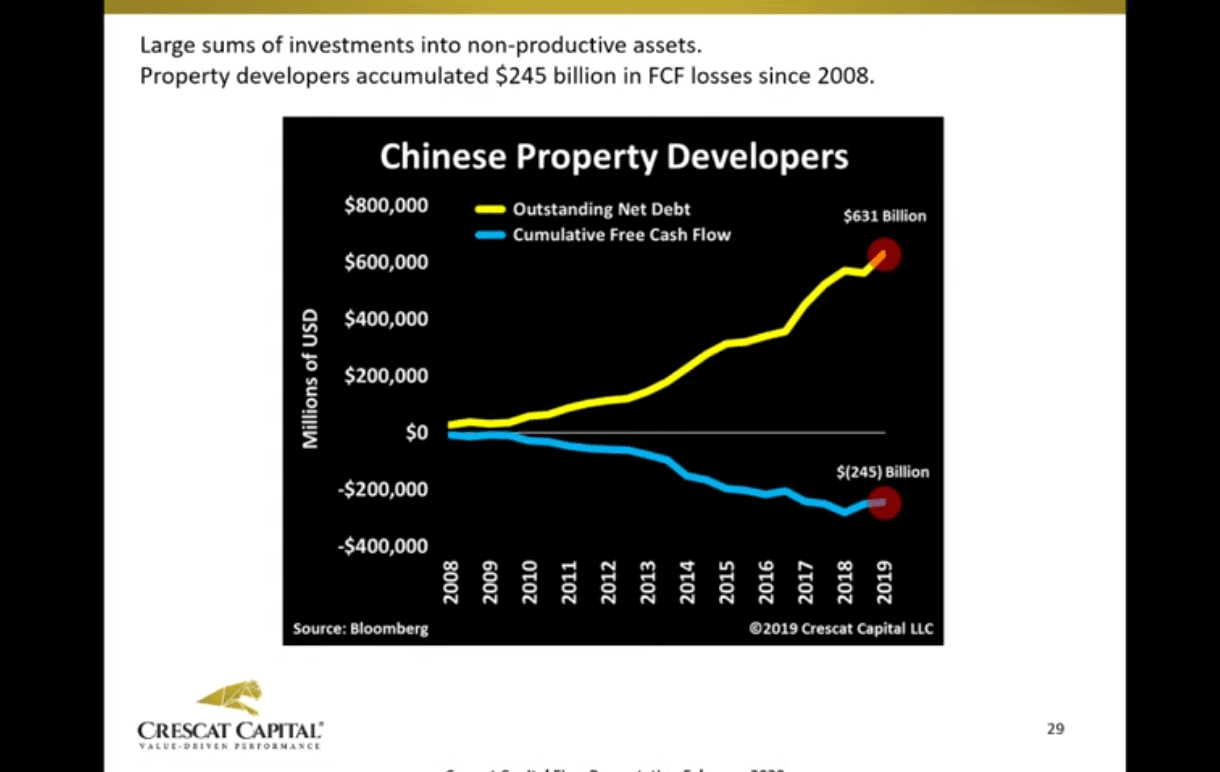
Here's just an example of something that looks a lot like 2008 and also here in the US at least in a comparison. But also another way to see this imbalances that Kevin was referring to is in the Chinese property developers. You can see Chinese property developers have been accumulating net debt close to $631 billion worth of net debt. At the same time this companies have made no money they're generating absolute none.
They're actually losing $245 billion accumulated since since 2008. This is a big story. A lot of those Chinese property developers look a lot like Chinese Home Builders here in the U.S. back in 2005, 06 and 07. And we think that this is just another part of the story, the real estate business in China overall, it is also a bubble. We think that this is it's an important to point out that what is the consequence of damage of all this debt build up in China, in our view is that the currency is poised to devalue significantly.
There are plenty I recently put out a thread on Twitter about many ways you can see this divergences, they're kind of ending up recently, along with the coronavirus situation along with the pork prices rising in China and all that. And this is a big deal right now we have China is starting to ramp up its its losing policies in general, losing significantly more recently. And that has to have an effect on the currency at some point.
One way to see this is this 20 year link between the Chinese currency and required reserve ratio among major banks in China. And you know, as we start seeing this red line drop significantly, you should see the white line starts to follow on the downside. So we think there's a catch up on the downside here, just one chart.
Another chart you can see this issue is is looking at us a real yield China and US real yield differential by that we're calculating by looking at a Shibor overnight rate minus the China CPI which has been rising at the same time minus the Fed funds rate versus the CPI spread here in the US and you can see this is the largest spread since the global financial crisis. And it's another divergence that kind of gives you an idea that the Chinese currency is again poised to devalue significantly.
Here we're looking at the net money printing in China, by the PBOC. And people think, well, the Fed is back in QE four, and it's true they are. But the the sheer amount of money printing that's been going on in China exceeds the level in the US, as it did back in 2015 and 16, as we show here, when when the pboc had net liquidity injections into their system. And, and we had that surprised Yuan evaluation in 2015? By the way at Crescat, we most of you who've been following us for a while now. We've been bearish on the Chinese currency for some time and we and you know, we we had our Chinese currency short back on at that time in 2015, and did very well with it.
But the bubble has only gotten bigger. And now so since August, the Fed has has increased its balance sheet by about $420 billion. And that's over a period of almost six months, in a period of just one month in the last month, the pboc increased its balance sheet by almost $400 billion US equivalents.
So the rate of the rate of money printing that has just ramped up now in China is about seven x of what's going on here in the US just another reason for the timing of the likely devaluation of the currency here to take hold again.
China in trouble
Now let's add another factor here. The current account has been declining. I think guys like Kyle Bass had pointed this out as well. This is an important point, I mean, current accounts when they start to shrink significantly, you tend to see the valuations of currencies and this is your outlier event was really Argentina there that lost close to 95% or so of, of the peso, Argentina. So since the global financial crisis at the same time as its current account declined significantly since the same period and here, you have have China, Hong Kong and Saudi Arabia at this quadrant that we call the currency devaluation risk are the only countries in the world today that still have no either not actually appreciate it or just barely depreciate it.
Even though they're the current accounts have been they have been shrinking significantly since then. We think this just adds another pressure to not just the Chinese Renminbi but also the Hong Kong dollar.
Hong Kong dollar looks very looks a lot like that the Chinese Renminbi, especially because of the banking system, size relative to the economy of Hong Kong, the political crisis, and other issues that we see in the same place. And the great thing about is that those two currencies have incredibly low implied volatility, and it's, you know, actually relatively cheap way to to, to bet against those two currencies.
Chinese property developers and GDP
What we have is a problem here is a toxic combination in China, which really shows a stagflation problem and Chinese inflation had been has been increasing recently, as you probably heard, and at the same time as the Chinese economy has been decelerating significantly, this you know, just add that to the Khurana buyers situation, which is which is incredibly important. And you know, you have empty roads you have no one is spending any money you have all the manufacturing plant of plants in the world, they're in China, they're all halted. You have no airlines wanting to to fly to China anymore. I mean, there's there it's a big deal.
I think in China's be responsible for about 60% of of the growth in global GDP since the global financial crisis. And if you think about China, having issues here economically speaking, I think that's going to have a lot of a lot of it added a lot of impacts in the world economy. This chart, the point really shows that this is not 2017 again, a lot of people have been calling this as a reflation trade. This is not 2017 at all. They actually Chinese growth is not picking up again, it's actually falling apart and just look at copper prices.
It tells a story very quickly, copper prices are not rising like they did in 2017. They're actually collapsing. You know, if you remember looking at this chart, we reached that peak in a very early 2018 and 2017, which was called the the peak synchronised growth narrative. And I think most of you remember that narrative was very common to hear the very conventional thought and that completely faded away.
Chinese property developers way overlevered
And copper has been just falling apart since then. More recently with the corona virus situation, corporate has been adding a lot of pressure. And it is a way in a huge way to look at the health of the global economy. We talked about yield curve inversions in the US, that is a big deal.
But we see that globally. This is not just in the US. I mean, look at Canada, Canada percentage of inversions the Canadian yield curve is today close to 89 to 90%. It's actually retesting the exact peak of the tech bubble in the US. We think we're you know, this is not the only place either immediately Hong Kong they got close to 90% as well of inversions, you have Australia and you have Japan that is the highest since the early 90s. There's there's there are plenty examples of of imbalances in distortions in credit markets worldwide.
And watch the FX market mean the currency markets are showing you something that perhaps they're warning us about something that is perhaps about to happen look at the present of reality now. Now, you know breaking out as you can see there, I should say it at its worst level in history. And you have also the Canadian dollar for me a bearish flag or a pen and as you can see there it's another economy that is that has a strong ties with China commodity economy. And it just gives you another another reason to to be short China overall.


