The following Silver Price History content is provided by SD Bullion.
Given that most Value Walk website visitors are from the United States of America (USA), we will begin by covering the historic US dollar silver price charts since before and after the founding of the USA.
Q4 2019 hedge fund letters, conferences and more
Silver Price Chart Long-Term USA
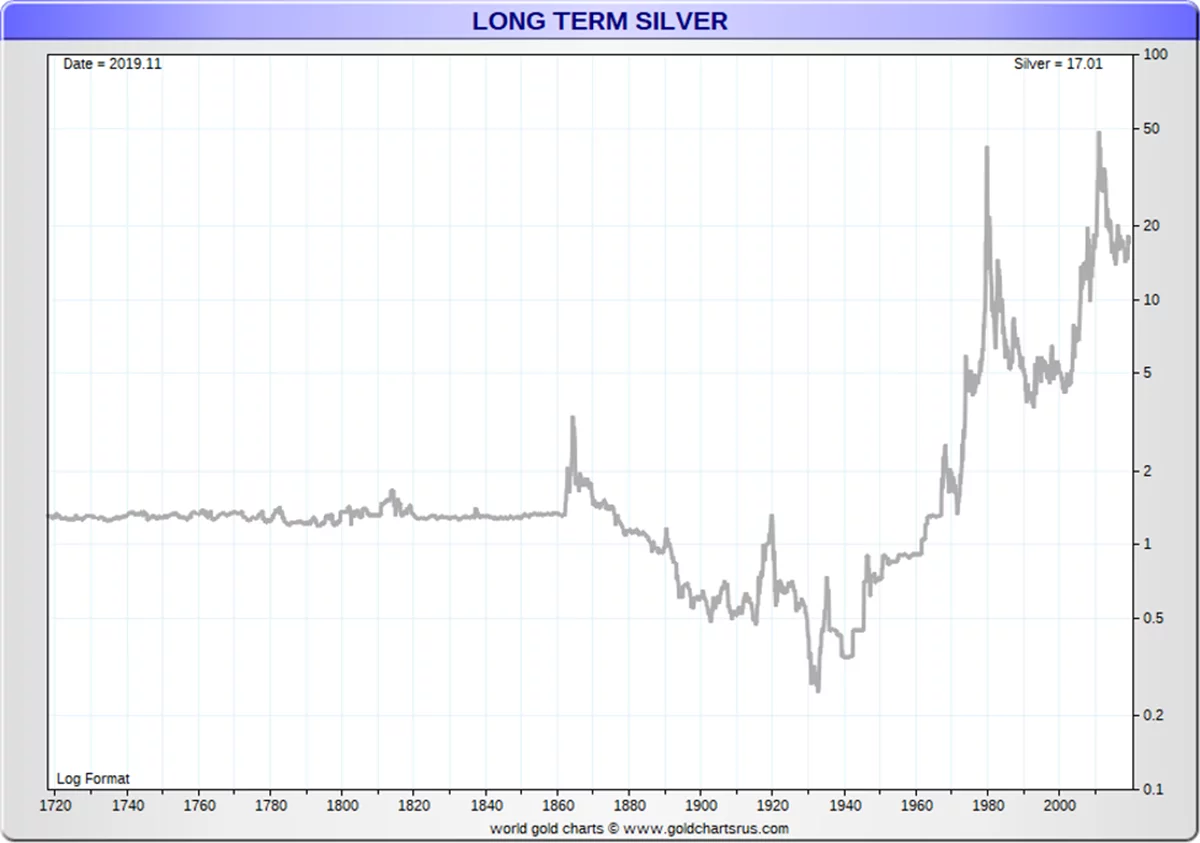
In our nation’s historically brief near 244 year history, the price of silver has swung from as low as 25¢ oz amid the Great Depression 1932-1933 to two various high points where silver spot prices peaked near $50 oz in fiat Federal Reserve note valuations (January 1980, April 2011).
In the US silver price history chart above, you will see the first price spike occurred during and just after the US Civil War ended and price manias in both silver and gold ensued. Perhaps much in part thanks to the large issuances of fiat currency Greenbacks to finance the Union's war victory.
The price of the metal reached as high as $2.94 oz all the way back in the year 1864. By the year 1869, the cost of gold had done a near 8X multiple from its long-enduring $20.67 oz USD price when touching about $160 oz USD that fall.
Below you can examine some significant historical dates and charts for US dollar silver prices as well as current values versus the past.
We will begin with a US dollar silver price chart covering more than the entire history of the United States of America to date.
Silver Price History gets very volatile after the US Civil War and Silver Demonetization
For the majority of beginning non-war US history held a $1.29 oz USD price defined by the 1792 Coinage Act.
Price volatility changed significantly for US dollar silver prices during and following the Civil War era to today.
In the image above you can see losing stock speculator, Walter Thornton of New York, offering to sell his Chrysler Imperial Roadster for $100 USD, one day after the stock market crash (October 30, 1929).
Lowest Price in History? | 1934 Silver Nationalization - Executive Order 6814
The lowest silver price per troy ounce in US dollar terms was 25¢ oz reached in late 1932 and into the year 1933.
See this fact reflected in the brief silver price chart below spanning the end of the roaring 1920s into the 1930s Great Depression below.
It was not but months later that the then US President Franklin Roosevelt issued Executive Order 6814 nationalizing the domestic private and mined stock of silver at 50¢ oz USD.
The result of this was some 109 million oz (see page 268) of physical silver delivered to the US Treasury in 1934. Read more about modern silver nationalization and gold confiscations.
Records: 1980 and 2011 Silver Price Nominal Highs of $50 oz USD
The highest prices for silver in US dollar (Federal Reserve note) terms are in the two charts below which span the respective 1970s and 21st Century silver bull markets respectively.
The late 1960’s collapse of the price rigging London Gold Pool was followed by the August 1971 Nixon Shock which ushered in our current floating fiat currency exchange standard where prices seemingly generally gain value versus fiat currencies over the long term.
The late 1970s and early 1980 nominal price peaks, not only in silver and gold, but also in platinum, palladium, and other major commodity prices was a signal that the world was doubting the full faith and credit of the fully fiat Federal Reserve Note post-1971.
Below is a chart of silver prices in US dollars during the years 1975 to the end of 1984. Note the price high in late January of 1980 for silver.
Silver Price Record 1980
Next is a chart of silver prices in US dollars during the years 2005 to the end of 2014.
Within the following price chart, you will see silver's price run-up starting in late 2009 and into the spring of 2011 went parabolic (almost straight up to then near the end of April 2011).
Silver Price Record 2011
In both early 1980 and in the start of spring 2011, the fiat US dollar price per troy ounce of silver spiked to reach around $50 oz USD.
With the context of underreported real price inflation compounding decade after decade since the year 1980, we presume that the next all time price high for silver in nominal fully fiat Federal Reserve notes will likely peak multiples highers than either the 1980 or 2011 price highs.
Using the old 1980 methodology for reporting price inflation compounding we see that the 1980 peak for silver in today’s fiat Federal Reserve note purchasing power is now north of $800 per troy ounce.
Even the 2011 price high for silver is now valued near $100 oz less than one decade after the fact. This makes sense if you understand that real inflation has likely been averaging over 7 to 9% since that 2011 high silver price mark.
See the Shadow Government Statistics Alternative Silver Price chart below to verify these points.
One of the best ways to understand silver’s ongoing trading value is to measure it against its precious monetary cousin, gold.
While only about 8 parts of silver are mined for every single one part gold, the current valuation relation between these two historic monetary metals has blown wide apart.
Silver vs Gold Mining Production History
For this investors often use the historic Gold Silver Ratio to understand perhaps which metal is undervalued vs. overvalued short, medium, and even in the long term.
Here is a short definition of the Gold-Silver Ratio:
Gold Silver Ratio - (n) how much silver one can buy with gold, and vice versa. The gold to silver ratio is typically attained by simply dividing the current gold spot price by the then current silver spot price.
For recorded history, the gold-silver ratio has been as low as 2.5 to a somewhat recent all-time of about 100 in the early 1940s, 1990s, and even now still in the mid-80s te begin the 2020s.
The gold-silver ratio dropped to as low as about 16 in early 1980 as silver and gold prices peaked.
The gold-silver ratio dropped to as low as about 33 in spring 2011 as silver prices then again peaked, followed by gold’s price peak in August 2011.
As of producing this content, the gold-silver ratio has risen again near and even recently above 80.
The following long term charts show the respective history of gold vs. silver price ratios over 300-year timespan.
Silver Price History Compared to Gold
History vs. Gold Longterm
Sourced from the book called ‘Silver Bonanza,’ authored by James Blanchard III released in 1995, the following historical data directly shows how much more highly valued silver has been for the majority of recorded human history.
| TIME FRAME / ERA | Sell 1 oz Gold | To get X oz Silver |
| Menes, Egypt 3200 BC | 1 | 2.5 |
| Egypt, 2700 BC | 1 | 9 |
| Hammurabi, Mesopotamia
2700 BC |
1 | 6 |
| Egypt 1000 BC | 1 | 10.0 |
| Croesus, Lydia 550 BC | 1 | 13.33 |
| Persia under Darius, son of Hystaspes (father of Xerxes) | 1 | 13.0 |
| Plato, ca. 445 BC | 1 | 12.0 |
| Xenophon (in Persia) | 1 | 11.66 |
| Menander, ca. 341 BC | 1 | 10.0 |
| Greece, ca. 300 BC | 1 | 10.0 |
| Rome, 207 BC | 1 | 14.5 |
| Rome, 189 BC | 1 | 10.0 |
| Rome, 40 BC, Julius Caesar | 1 | 7.5 |
| Rome, Claudius | 1 | 12.5 |
| Constantine the Great | 1 | 10.5 |
| Theodosian Code | 1 | 14.4 |
| Medieval England | 1 | 11.1 |
| Medieval Italy | 1 | 12.6 |
| TIME FRAME / ERA | Buy 1 oz Gold | With X oz Silver |
| Spain, 1497 AD, Edict of Medina | 1 | 10.07 |
| Germany, 1500 AD | 1 | 10.05 |
| 1600 - 1620 AD | 1 | 12.1 |
| 1700 - 1720 AD | 1 | 15.1 |
| 1800 - 1820 AD | 1 | 15.3 |
| 1821 - 1840 AD | 1 | 15.6 |
| 1841 - 1860 AD | 1 | 15.6 |
| 1861 - 1870 AD | 1 | 15.6 |
| 1871 - 1880 AD | 1 | 16.7 |
| 1881 - 1882 AD | 1 | 17.6 |
| 1883 - 1884 AD | 1 | 18.4 |
| 1885 - 1886 AD | 1 | 19.9 |
| 1887 - 1888 AD | 1 | 21.2 |
| 1890 AD | 1 | 18.3 |
| 1932 AD | 1 | 75.0 |
| 1940 - 1941 AD | 1 | 100.0 |
| 1980 AD | 1 | 16.0 |
| 1991 AD (February) | 1 | 100.0 |
| 1994 AD (July) | 1 | 73.25 |
Silver vs Gold Full Fiat Currency Era
The following Gold Silver Ratio chart focuses on the current full fiat currency era we are living in since the end of the Bretton Woods agreement and gold exchange monetary standard in 1971.
The last time we dipped below the green trendline was during the 2011 silver, and gold nominal record price runs, seeing a gold-silver ratio of about 33 being the interim low of the last decades after the early 1980s.

The next silver price history chart covers the last major silver bull market before this 21st Century version began in the early 2000s.
The price peaks of all 4 major precious metal prices occurred within months of one another in the first half of 1980 (gold and silver, followed by platinum and palladium respectively).
This is how silver’s stealth, awareness, mania, and blow off phase looked from 1970-1982.

Hawkish than-Federal Reserve note interest rate policies of near 20% were possible back then given the respective lower levels of debt throughout the domestic and global economies at the time.
Today our global record debt levels and fundamental economic factors are profoundly different than they were in 1980. With over $250 trillion in hard record debt levels worldwide, we will likely never see interest rates more than ten multiples of where they are today ( < 2%).
In the ongoing silver vs. fiat US dollar war, we are more likely to see even steeper negative real interest rates and further fiat currency debasement as two primary ways in which current and future debt obligations get defaulted upon all but nominally so.
Many investment experts expect the 2020s to be great years for silver values respectively.
Some bulls going so far as to say new nominal record prices will ensue from 2022 to 2024 with another global financial crisis likely being the catalyst.
Silver Price Future Potential

Above is a potential roadmap ongoing for a future silver price mania phase to three digits silver priced in fiat Federal Reserve notes.
Time will, of course, tell if the road ahead for silver possibly plays out like this.
Historical Price Date at SD Bullion
In our studied opinion, these last 50 years of silver price data are most important, relative to the somewhat recent time in history that they cover.
The last near 5 decades of our continued time living under a full fiat global monetary order is of most importance when trying to judge where and how far might future mean overshooting go.
You can always find fresh up to date silver price information on our silver price page at SD Bullion.
There you can find links to nearly the last 50 years of daily fiat US dollar silver price quotes and data too. Be sure to bookmark these updating pages if daily silver price history and information are essential to you.
Thank you for reading our guest post and silver price history content here on Value Walk.


