Logos LP commentary for the fourth quarter ended December 31, 2019.
“The world is ruled by letting things take their course.” – Lao-Tzu
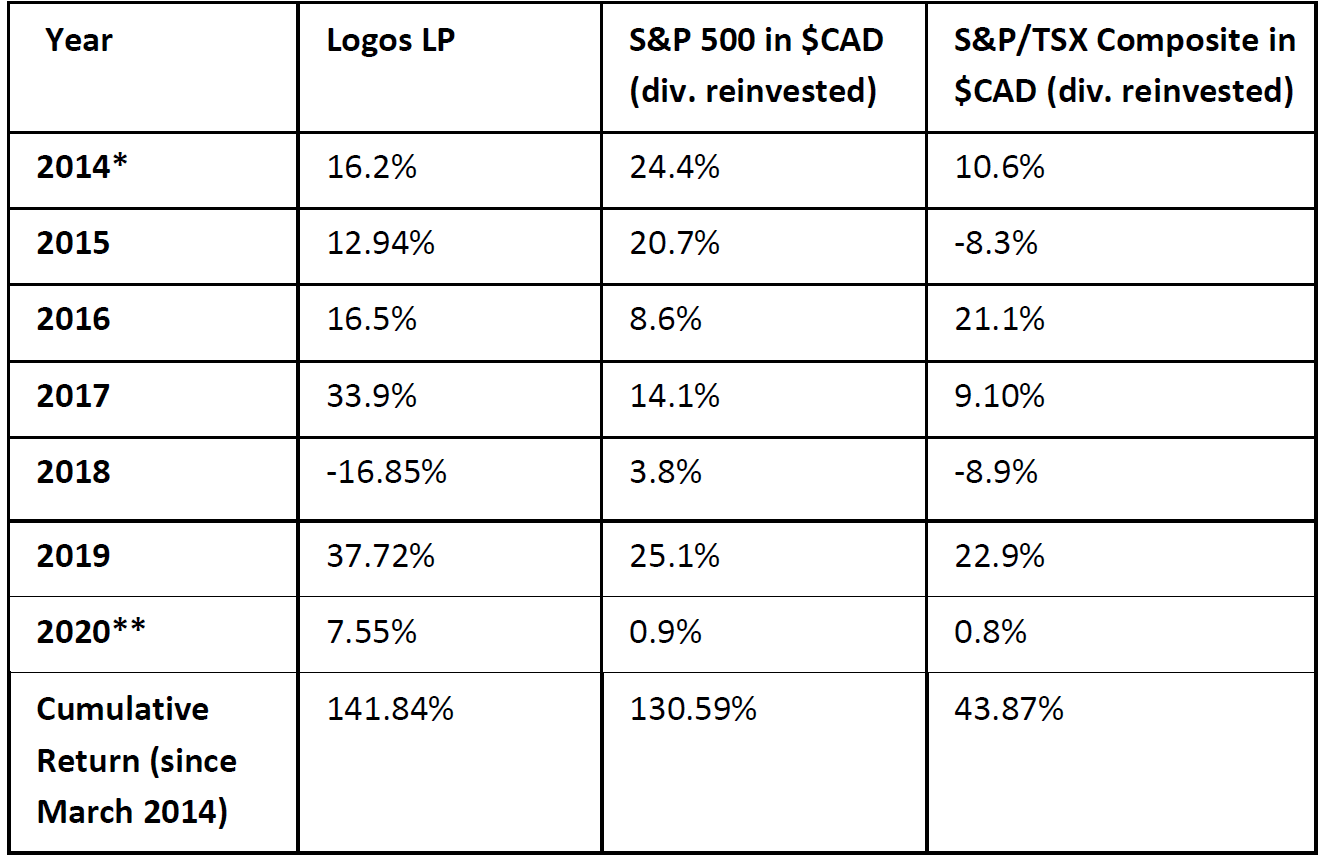
The following table represents Logos LP’s YTD return compared to a basket of relevant indexes. The price per unit as of December 31st, 2019 is $29.13 compared to $21.11 as of December 31st, 2018:
*From March 26th, 2014 to December 31st, 2014
**As of January 10th, 2020

Q4 2019 hedge fund letters, conferences and more
The fund realized a 10.43% gain in Q4 leading to a compounded annual return of 15.8% since inception (3-year CAGR is 15.31% vs. 14% for the S&P and 6.89% for the TSX in $CAD) as of December 31st, 2019. Although the year has just begun, the current price per unit stands at $31.33 representing a 7.55% gain since December 31st, 2019. Currently, there are 31 companies in the portfolio with our top 10 making up 46.52% of the fund’s net asset value. Late Q4 was slightly less active than early Q4, yet our activities centered around removing or trimming certain positions which had reached our estimation of “intrinsic value” as well as allocating to certain select emerging market companies. Below you will find the largest 10 positions in the portfolio as of January 10th, 2020:
- CGI INC (GIB-A.TO)
- ZSCALER INC (ZS)
- UPLAND SOFTWARE INC. (UPLD)
- KINAXIS INC. (KXS.TO)
- TYLER TECHNOLOGIES INC. (TYL)
- ENGHOUSE SYSTEMS LTD. (ENGH.TO)
- MASTERCARD INC. (MA)
- JOYY INC. (YY)
- HUNTINGTON INGALLS INDUSTRIES INC. (HII)
- VISA INC. (V)
A few of these positions were initiated in late Q3 or early Q4 and increased on price dips (i.e. Zscaler, Upland), while others were initiated a few years ago at very attractive price points. As mentioned in our previous Q3 2019 letter, we remain constructive on select opportunities in the software space in light of the fact that many enterprise SaaS companies still haven’t fully recovered from the Q4 2019 selloff.
For example, Upland Software (UPLD), a serial acquirer which collects zombie VC investments (usually those that have run out of runway) within the enterprise work management market was trading at under 4x sales despite ~30-40% top line growth and strong cash flow yield. Zscaler (ZS), a cloud cybersecurity company securing access to cloud applications and effectively replacing corporate VPNs altogether, was trading at under 5.99x 2023 sales assuming the lower end of their growth rate. Overall, trends in cloud computing, public sector software, cybersecurity and AI-based applications for mission critical workflows will continue to attract IT spend in the new decade leading to above average long-term returns. We think multiples for the sector will see a rerate in the first half of 2020 as risk premia come down. This will be precipitated by the fact that we appear to be in a stable growth environment as earnings yields against companies’ own borrowing costs and against the 10-year Treasury continue to make high return on capital businesses increasingly attractive long-term investments.
In light of the above, one theme we have spent a considerable amount of time pondering is how more traditional “value investing” doctrine can be squared with investing in the “high multiple” software sector. It is easy for traditional “value investors” to throw this sector by the wayside indicating that valuations are “elevated” especially when looking at traditional valuation metrics such as book value or the fact that many of these companies are “loss making” entities.
Over the last decade, embracing this bias and for the most part avoiding the sector would have had a significant impact on one’s investment approach and perhaps a quite negative impact on one’s investment returns. As such, we think it worth exploring our own approach to this bias which is rooted in Charles Munger’s teachings on the importance of evaluating the “quality” of a business:
“We don’t know how to buy stocks by metrics…We know that Burlington Northern will have a competitive advantage in years…We don’t know what the heck Apple will have…You really have to understand the company and its competitive positions…That’s not disclosed by the math.” – Charlie Munger
What we glean from Munger’s teachings is his emphasis on ascertaining the existing and future competitive positioning of a company by analyzing the known and making a probabilistic inference about the unknown. When it comes to the software space, we believe that Munger’s teachings suggest to the “value investor” a more rigorous appreciation of how much value many of these intangible-rich companies possess considering the makeup of our intangiblerich economy.
This was explored in Haskel and Westlake’s book, Capitalism Without Capital, which points out the difficulty of tracking the accounts, synergies and benefits of investments made by companies that are very rich in intangibles (which continues to be an ever growing and still an incalculable part of GDP). They reference an interesting book titled The End of Accounting (Lev and Gu, 2016) which suggests that investors should be more rigorous about a firm’s analysis as internal investments in intangibles are hidden from view:
“Lev and Gu looked at companies that went public over each decade from the 1950s to the 2000s. For each of those decades/groups of companies they asked: How correlated are book values and earnings to market values? Their results…show a very clear decline in the correlations over the decades, suggesting that financial accounts have indeed become much less informative of company earnings. This has occurred as R&D and SG&A as a percentage of sales has risen: the point being made that many intangible investments, such as design, are allocated by accounting rules to SG&A.”
What’s more is that the decline has accelerated since 1990, meaning that more and more of these intangible investments are being made at a faster rate than previous decades. As such, we have yet to see the benefits of the processes, synergies, training, designs and other various intangible investments made by these enterprise software companies in high growth markets as they are not coming up in their earnings reports or reflecting on their balance sheets in the short term.
Considering the above, one should ask what is the long-term implication of Zscaler’s partnership with Microsoft? What are the long-term benefits in procurement and what future synergies will arise from Zscaler’s FedRamp approval? What spillover effects will Zscaler see with their Crowdstrike partnership? The answers to these questions are certainly unclear and difficult to answer, but it is important to analyze not only the quantitative but also the qualitative long-term impacts of the intangible investments made by fast growing intangiblerich companies with high prospective ROIC. If we can have success determining answers to these types of questions, in addition to picking up these types of companies after drastic declines or when they are completely out of favor (Zscaler down nearly 47% from highs in Q4; Upland down nearly 40% at lows) then we believe that the “value investor” can obtain attractive odds of reaping the lucrative effects of future scalability over the long-term.
Other portfolio moves include an increase in exposure to emerging markets. At about 20.65% of the fund, the portfolio has more emerging market exposure than previous years, particularly China (YY) and Brazil (PagSeguro Digital Ltd.: PAGS) as global all-industry PMIs2 are suggesting improvement. In addition, we believe certain EM stocks had very compelling valuations last year given concerns about global growth as well as trade tensions depressing multiples. We are especially bullish on China, as trade tensions appear to have subsided and we think China took the first of many steps in January 2020 to prop up their stock market as the nation heads into the 100-year anniversary of the People’s Communist Party in 2021. Hard to celebrate an anniversary when the population hasn’t fully reaped the benefits of financial liberalization.
Outlook
Most asset managers, analysts and pundits are currently being asked the same question: "What is your target for the S&P 500 next year?" or “what will next year hold for equity markets?” As we’ve said in the past, predicting where the S&P 500 is going to be one month from now is hard enough, so trying to predict where prices will be a full year from now is almost pointless.
Who could have predicted at the end of Q4 2018, a time in which stocks had experienced their worst December since the Great Depression, that in 2019 if you add in dividends, the S&P (in $USD) would rally 30%+?
Looking back at our year-end Q4 2018 letter last year we stated the following:
“We also believe that there is a chance (that many are not pricing in) that markets will break out massively to the upside if several uncertainties which have clouded the minds of investors are resolved. To name a few, think Brexit, China-USA tensions, gridlock in Washington and fears of China slowing down. The buying would be exacerbated by the fact that investors have already reduced portfolio risk in 2018 and seem poised to continue to do so in 2019. The FOMO buying by excessively bearish managers caught flat footed could be intense.”
Seems like we may have been on to something as after large selloffs markets tend to recover as the pendulum swings back from extreme fear…
Nevertheless, after a 30% year for the S&P, such a call is certainly more difficult to make and so as a new decade dawns, we feel confident in predicting that the search for outsized yet sustainable investment returns is not going to get any easier. Instead, it will likely get harder as too much capital chases too few good deals.
Interestingly, through the middle of December 2019 sentiment was above average on less than 10% of all trading days. Since 1990, there have only been six other years where sentiment was above average on less than 15% of all trading days, and in the year after each of these occurrences, the S&P 500 was higher for an average gain of 22% compared to an average of just 7.2% for all other years since 1990.
Furthermore, measures of sentiment among institutional investors are still suggesting a major lack of confidence in the bull market evidenced by significant portfolio exposure to cash and cash equivalents.
In addition, data from the 1950s to the 2010s suggests that when the market goes up 5% or less over a 20-month period, returns in the two years ahead tend to be stellar. Taking a composite of these periods implies a 53% return for the S&P 500 over the periods that follow flat markets.
This points towards returns that could top 25% for the S&P 500 in 2020, with 2020 potentially serving as the mere beginning of this new breakout rally.
Regardless, the pendulum can often violently swing from extreme fear to extreme greed and thus we will continue to look for signs which confirm that markets have entered into the “belief” stage or even final “euphoric” stage of this secular bull market. Nevertheless, we feel like we are simply exiting a mid-cycle correction period rather than entering into an “end of cycle” period, yet time will tell. On a more specific level, we believe that this year will be the year of fiscal expansion as monetary policy is running out of road. As such, the biggest (obvious) risk facing investors will likely be if monetary policy loses all effectiveness and governments shy away from fiscal stimulus.
As for the U.S. specifically, we believe that if unemployment remains low, and wage growth picks up, Trump is likely to be re-elected and his re-election could bring more relief to markets, as Wall Street will know who they are dealing with. Furthermore, the U.S. tends to be politically aligned with trends in the U.K. and we just saw Boris Johnson win by a landslide…
To wrap up the decade, contrary to the 24/7 news cycle and the default outlook of pessimism which seemed to pervade the 2010s, we believe the past decade just might be the best in history.
The world is far from perfect but we’ve seen unbelievable improvements in areas like extreme poverty, technological innovation, and living standards over time.
At Logos LP we choose optimism as the default setting and as we move into the next decade we do so with the following reflection:
“Praise and blame, gain and loss, pleasure and sorrow come and go like the wind. To be happy, rest like a giant tree in the midst of them all.”-The Buddha
We are grateful for your continued support and will continue to dedicate our time and effort on your behalf. In the meantime, if there are any questions please feel free to reach out to us and we would be more than happy to answer.
Sincerely,
Peter Mantas
General Partner, Logos LP
Matthew Castel,
General Partner, Logos LP


