In 2018, almost every major asset class posted disappointing returns as markets priced in an immediate recession that failed to materialize. 2019 began with a “miracle recovery” as equities captured new highs and declining interest rates boosted bonds. In recent weeks, anxiety and volatility have spiked once again amid escalating uncertainties. Headlines suggest that a global recession and accompanying 2008-style financial market collapse are imminent. While we agree that recession risks are higher today than they were 6 months ago, we believe the onset of recession in 2019 is unlikely and see potential for the expansion to continue into 2020.
Throughout 2018, but particularly in the fourth quarter, investors became increasingly anxious about the prospect of a recession. While many of the economic concerns contributing to the selloff remained, most asset classes recovered significantly in 2019. However, the environment has become increasingly tenuous in recent months.

Q2 hedge fund letters, conference, scoops etc
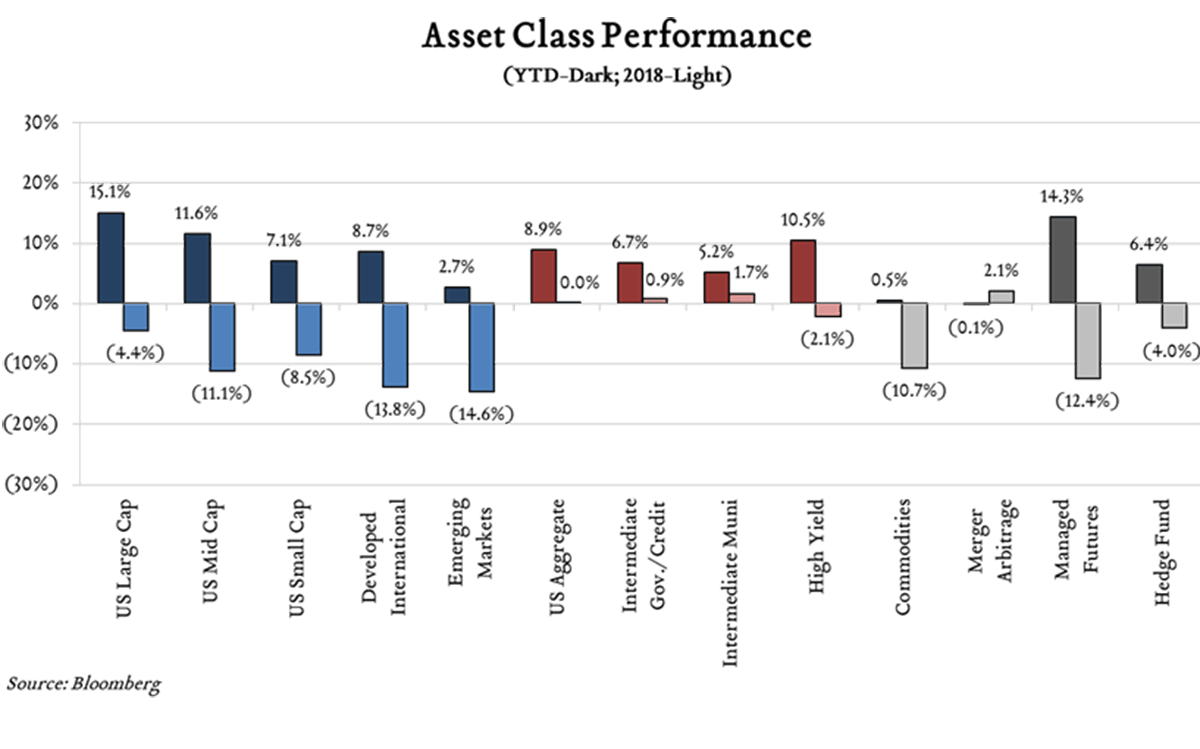
- Global Equities: In 2018, global equities declined 9%. Domestic large caps fared “best” (down 4%) while developed international and emerging market stocks posted double-digit declines. As of this writing, global equities are up nearly 12% in 2019 led by domestics (+15%) and followed by developed international (+9%) and emerging markets (+3%).
- Fixed Income: In 2018 rates were largely on the rise. From a starting yield of 2.40% on the US 10-year treasury, rates peaked at 3.24% in November and closed the year at 2.68%. As a result, bond returns were either flat or negative in 2018. In 2019, rates have moved lower, briefly falling below 1.50%. As a result, broad bond indices have rallied nearly 7% year-to-date.
2018 Fears Resurfacing in 2019
Key sources of uncertainty in 2018 included US/China trade negotiations and Federal Reserve Policy. Unsurprisingly, these themes have continued to carry significant influence in 2019.
- Trade Policy: Evolving U.S. trade policy introduced uncertainty and fears of an all-out trade war between the U.S. and China in 2018. In 2019, a trade agreement remains elusive despite escalating tariffs between the two countries. Heading into the 2020 election President Trump likely has two strategic priorities in mind: 1) maintaining market/economic strength, and 2) staying “tough” on China. At the moment, these two themes are at odds and the President is balancing his efforts. He has demonstrated a willingness to turn up the heat on China as long as markets are behaving, but when markets respond too negatively, the heat is dialed back. We believe a negotiated deal will materialize eventually, but as long as the market will bear it, President Trump is unlikely to put this to rest before the 2020 election.
- Federal Reserve: The Fed raised interest rates four times in 2018 and projected two rate hikes in 2019 when the year started. By the end of the first quarter, Fed policymakers reduced expectations to zero rate increases and moved forward with a 0.25% rate cut on 7/31. Concurrently, a number of other global central banks have either eased policy or are expected to do so. This appears to be largely in response to uncertainties tied to the ongoing trade war between the U.S. and China. President Trump has not been shy about his desire for the Fed to cut rates further and faster to spur economic growth and we speculate that stoking uncertainty about the eventual U.S./China outcome is a means to that end.
As Bad as It Seems?
Global growth is decelerating from 2018 highs, but consensus forecasts are calling for greater than 3% global growth in 2019 and we see 2.0%-2.5% real GDP growth here in the U.S. – slower yes, but recessionary no. The U.S. consumer is gainfully employed, confident, and spending. Business confidence and fixed investment spending have been softer, but that is largely reflective of the unknowns associated with the trade war. Examining key recession indicators, we observe some mixed signals consistent with late cycle positioning.
- Yield Curve: An inverted yield curve (short-term yields exceed longer-term yields) has historically been a useful indicator of future economic growth. The yield curve inverted 4-24 months prior to each of the last seven recessions – there were also two false positives. In March of this year the yield curve inverted, triggering this indicator for the first time since the great recession. The curve remains inverted today.
- Unemployment: The labor market is another indicator of recession risk as rising unemployment can foreshadow economic contraction. The unemployment rate has historically bottomed nine months before the onset of a recession. Unemployment currently stands at 3.7%, near a 50-year low, but it is difficult to identify a trough in real time.
- Real Retail Sales: Consumer spending makes up the majority of U.S. GDP, so real year-over-year declines in retail spending can indicate that a recession is near. In December 2018, real retail sales declined 0.3% triggering this indicator, but growth has rebounded in 2019 averaging +1.4% year-to-date.
History Favors Discipline
It has been more than ten years since the financial crisis. We find ourselves late in the economic cycle with heightened risk of recession in the next couple of years. The question is not if we will experience another recession, but when. This is always the case. Economic recessions are more routine than most appreciate and recent examples like the tech bubble (2001) and the great recession (2008) cloud perceptions of the market experience typically associated with recessions.
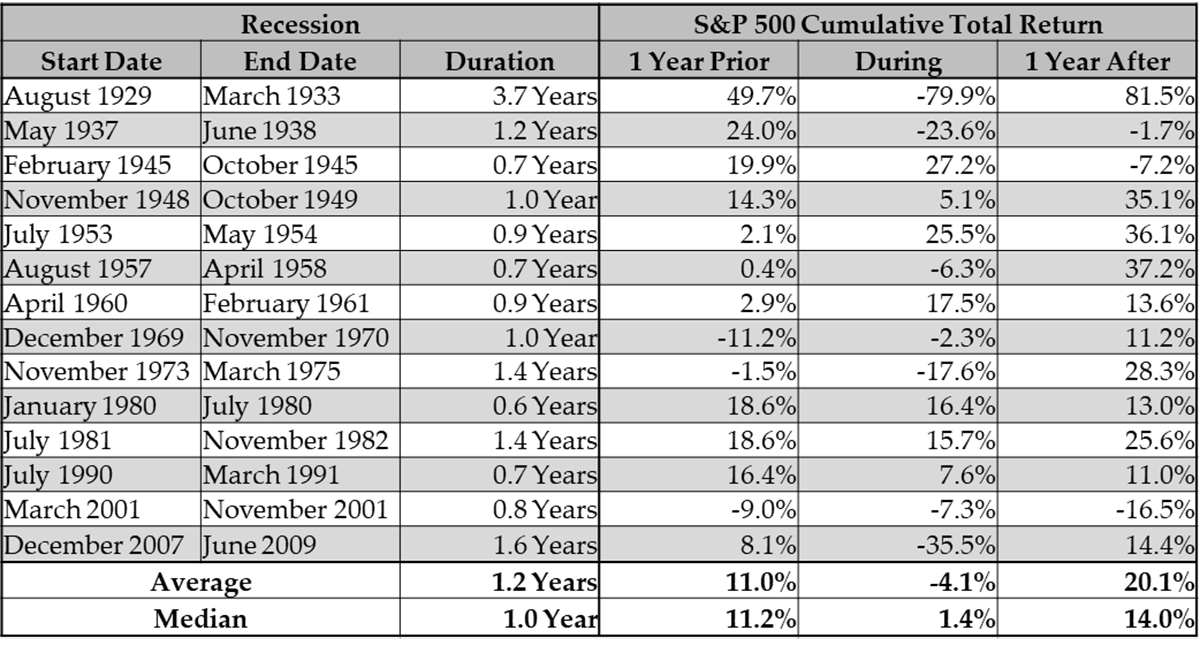
Source: Bloomberg, NBER, author’s calculations.
Looking back nearly a century, the U.S. has experienced a recession about once every 5-6 years with the recession itself typically lasting about one year. Importantly, U.S. stock returns have averaged 11% in the twelve months leading up to a recession and 20% in the twelve months immediately following a recession, while the average decline during the recessionary period has averaged just 4%. Granted, peak-to-trough recessionary drawdowns were more severe, but also short-lived.
This means that on average, investors would have captured 8.5% annualized returns holding U.S. equities in the typical 3-year period beginning 12 months prior to recession and ending 12 months after recession. Efforts to avoid a transient recessionary drawdown by timing the market come with a disproportionate risk of missing periods of growth essential to long-term wealth creation.
Article by Nicholas A. Juhle, CFA, Vice President and Director of Research, Greenleaf Trust
As vice president and director of investment research at Greenleaf Trust, Nick leads a team responsible for creating comprehensive investment solutions to help clients reach their financial goals. He is the chair of the investment committee, responsible for portfolio-level investment decisions and outcomes. Nick joined Greenleaf Trust in 2012 from Robert W. Baird & Company. He holds a bachelor’s degree in business administration from the University of Michigan Ross School of Business. Nick is a CFA® charterholder and a member of the CFA® Institute.


