Miami Ranks #13 in the country where investing in housing outperforms the stock market!
The housing market has come a long way since the Great Recession. The demand for homes has reached such a fever pitch that in certain U.S. metro areas, the equity you have in a home outperforms investments in index funds tracking the S&P 500 — long considered one of the most reliable vehicles for investors and a strong indicator of how the stock market is performing as a whole.
Q2 hedge fund letters, conference, scoops etc
Key takeaways
- We examined the performance of home prices in 20 U.S. metro areas from 2012 to 2018. Of these 20 areas, housing appreciation in the Los Angeles, San Francisco, San Diego, Miami and Seattle markets outpaced the S&P 500 over this period.
- San Francisco outperformed the S&P 500 by the greatest margin, growing approximately 127 percentage points from 2012 to 2018, compared with the S&P 500’s gain of nearly 98 percentage points.
- Among the five metro areas that outperformed the S&P 500, only Los Angeles has a majority of homes occupied by renters rather than by owners. Renters obviously don’t reap any benefits from the explosive growth in home values — in fact, they often see their rents rise as landlords see the growing value of their real estate.
- From 2012 to 2018, the housing markets in all 20 cities we looked at increased in value. The slowest-growing market, Cleveland, still rose by almost 22 percentage points.
How we know housing markets have outperformed the stock market
Among the most reliable and most widely cited indices used to measure housing markets are the Case-Shiller indices, calculated each month by Standard & Poor’s and CoreLogic. There are several Case-Shiller indices, but we chose the Composite 20 index, which tracks housing values in the following 20 metropolitan areas:
- Atlanta
- Boston
- Charlotte
- Chicago
- Cleveland
- Dallas
- Denver
- Detroit
- San Francisco
- Seattle
- Las Vegas
- Los Angeles
- Miami
- Minneapolis
- New York
- Phoenix
- Portland (OR)
- San Diego
- Tampa
- Washington D.C.
The index examines the change in home prices for each of these cities by looking at residential home sales and running that data through an algorithm. To learn more about the Case-Shiller index, there’s plenty of information from Standard & Poor’s here.
In the 2012-2018 time period of our study, the Case-Shiller Composite 20 index showed a growth in average home values in all 20 metropolitan areas. You can then compare the Case-Shiller index to the growth in the S&P 500, an index of roughly 500 stocks that often serves as a bellwether for the U.S. stock market as a whole.
The chart above indicates that according to the Case-Shiller Composite 20 index, the housing markets of five metro areas grew quicker than the S&P 500 in the 2012-2018 period, which saw a rise of 97.97 percentage points:
- San Francisco (+127.26 percentage points)
- Los Angeles (+111.57 percentage points)
- Seattle (+110.95 percentage points)
- Miami (+109.10 percentage points)
- San Diego (+98.67 percentage points)
That means in theory, the equity you have in a home in one of these markets may have appreciated by a greater amount than if you had invested it in an index fund that tracks the S&P 500 — a common stand-in for the entire stock market.
Good news for homeowners, bad news for renters
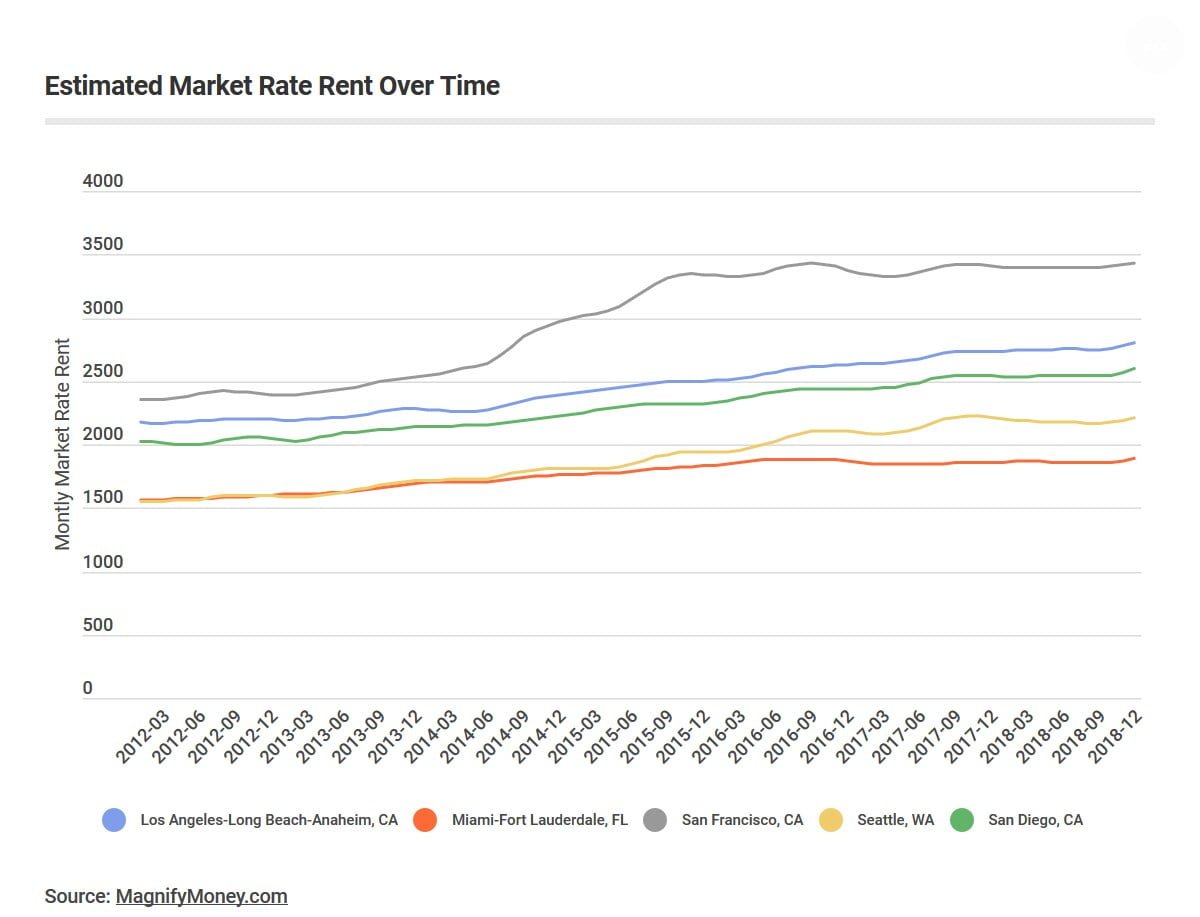
While homeowners may be celebrating, our study gives the renters living in these five metro areas little reason for joy. As the value of a home goes up, landlords increase rents to reflect the broader housing market (as much as they are able under the constraint of local housing laws and regulations). The chart below estimates the performance of rents in the five metro areas that outperformed the stock market from 2012 to 2018:
In San Francisco, for example, the average rent rose nearly 46% during the time period in question from $2,359 to $3,433 a month. While the City by the Bay offers the most dramatic example of rent increases, tenants in the other four metro areas also had to pay more for the privilege of renting in a hot housing market.
Another concerning consequence of rising home values in these cities is that homeowners in these markets tend to already be wealthier than their non-owning neighbors, which means real estate appreciation widens the wealth gap. For example in Los Angeles, only approximately 31% of renters have an income of $75,000 or more a year, compared with 63% of homeowners. Homeownership also has a racial disparity in these metro areas: Almost 71% of African American households in Seattle rent, compared with just 36% of white households.
Why stocks are still a better bet than housing
Despite the value of housing outpacing the growth of the stock market in certain metro areas, homeowners should think twice before funneling funds earmarked for their investment accounts into hearth and home.
The most obvious difference is the relative liquidity of investment securities and a house (especially one that’s your primary residence). Selling a house comes with a litany of costs that eat up both your time and your money, while cashing out on your investments can usually happen in a matter of days (not that selling an investment in an index fund or stock is without potential tax costs and other potential losses).
There’s also the matter of putting all of your eggs in one basket. The ability to diversify your investments is one of the greatest advantages of investing in markets. By placing your money in a diverse array of securities, from stocks, to bonds, to money market accounts, it can help shield you from volatility in any one particular market. But if you put all of your money in your home as an investment and the housing market crashes (like it did most recently in 2008), then your nest egg is scrambled.
Finally, owning a home comes with property taxes you need to pay every year. In the city and county of San Francisco, the property tax rate for the financial year of 2018-2019 was 1.1630%. With investments, you typically only pay a capital gains tax one time: when you sell it.
Methodology
Data on change in S&P 500 value over time comes from the Stern School of Business at New York University. Data on home value for each of the metro changes comes from the Case-Shiller Index of home values and is pulled from the Federal Reserve Economic Data. Data was analyzed over the 2012-2018 time period.


