Whilst history doesn’t repeat itself, it often rhymes, so the saying goes. In this sense, every economic cycle is unique however various underlying patterns repeat themselves with a high degree of consistency. With an understanding of the underlying economic patterns, central bank rates and the reasons these patterns occur, we can analyze the data to ascertain where we are in the current economic cycle, at any point in time, with a reasonable degree of confidence.
Central Bank Rates – How To Use Economic Cycle In Investment Strategy
An understanding of where we are in the current economic cycle adds a lot of value to investment strategies.

Q1 hedge fund letters, conference, scoops etc
For a simple investment strategy consisting of stocks or cash, one can assess how heavily to be invested. An investor may want to more confidently time their entry to the stock market by investing in the earliest stages of the economic recovery, and hold a fully invested position through the economic expansion, before likely looking to progressively move back to cash when late cycle conditions arise and significantly back to cash when recession risks are high.
This is more advanced than traditional market timing methodologies which propose one should invest more heavily when markets are cheap, versus when markets are expensive. Whilst the valuation-based strategy makes sense in theory, it is heavily flawed by the fact that market valuations have not been consistent over time, and markets can remain expensive for very long periods of time leaving an investor sitting on the sidelines. It is also, in our opinion, that this strategy fails to build investor conviction in their investment decisions and is more useful as a reference input into decision making, rather than a tool by itself. We do consider this below.
Get a full $299 subscription one year subscription at RecessionProtect.com for FREE!! ValueWalk readers only - use valuewalk100 code at checkout - no credit card info needed.
A more advanced investment strategy may be similar to above, but involve the addition of further financial instruments. For example, in the early stages of the economic recovery, an investor may wish to add leverage to their investment portfolio, and gradually reduce this leverage as the economic expansion matures, before finally acquiring put options or shorting ETFs as a market portfolio insurance strategy as the indications of late cycle economic characteristics arise and risk of recession increases.
Finally, a more complex strategy may wish to rotate portfolio exposure depending on the stage of the economic cycle we are in. For example, in the earliest phases of an economic recovery, cyclical sectors tend to perform the best (i.e., consumer discretionary, building materials & construction), where as in the late cycle, more defensive sectors (i.e., healthcare, utilities & telecom) begin to outperform due to their more stable top-line characteristics whilst sectors that are responsive to building inflationary pressures (i.e., commodities) also tend to perform well. Finally, in the recession stages, those sectors with the most defensive characteristics perform the best. Alternatively, investors may wish to rotate between asset classes at different points in the cycle, such as, stocks in an economic recovery, commodities in a late cycle phase, and long-term treasuries in a recession.
Breaking Apart the Economic Cycle
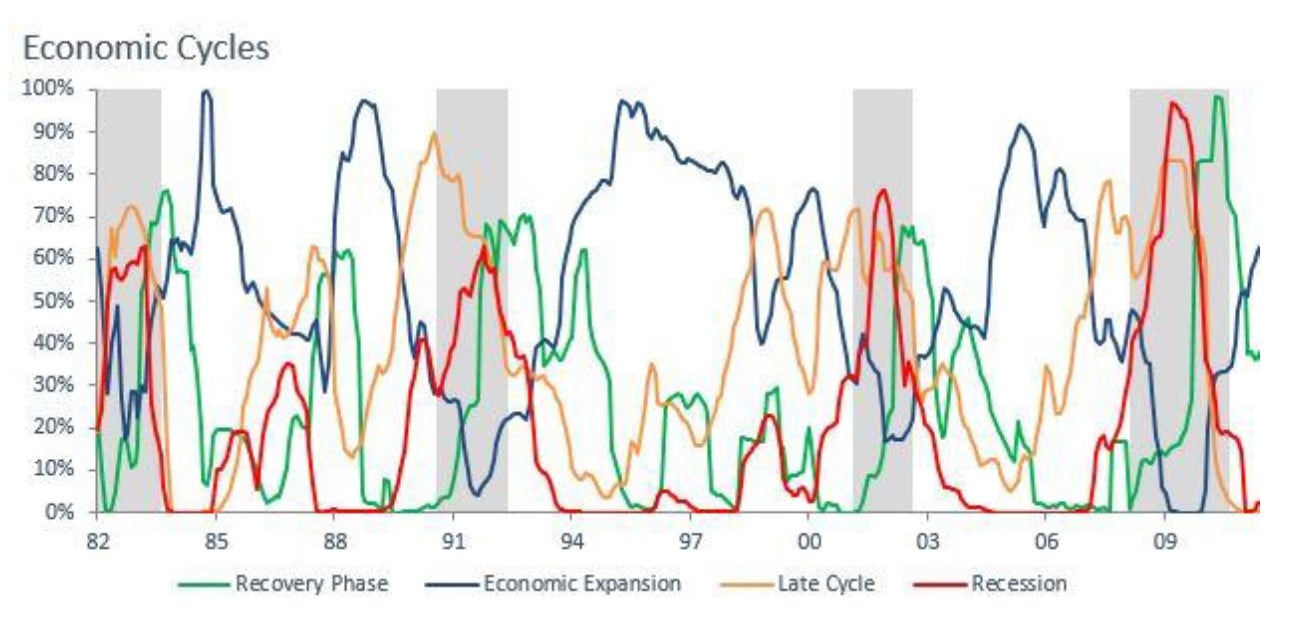
Economic cycles are driven by sub-cycles, such as cycles in the price of credit which drive leverage cycles, business investment cycles and consumer spending cycles. The characteristics of each of these sub-cycles are unique in their nature, and can be measured at a more granular level allowing us to identify four stages of an economic cycle:
- Recovery phase: central banks & Govt loosen policy to help growth re-accelerate out of the last recession, liquidity conditions transition from tight to loose and stimulation gets consumer and business activity moving positively.
- Economic expansion: this is the longest part of the economic cycle. Economic growth stabilizes, liquidity conditions become neutral, underlying cyclical data points such as credit & business investment cycles drive the economy.
- Late-cycle: the cycle matures as demand begins to exceed economic capacity, inflation pressure arises & central bank hiking begins to tighten liquidity. The output gap has largely closed and the economy is vulnerable to recession when economic momentum slows or liquidity becomes too tight. Eventually the prospects of return on investment for firms start to fall and business investment growth plateaus.
- Recession: the final phase, as the economy cools and enters into a contraction as consumer and business activity slows in response to tighter monetary & fiscal policy. The de-stocking of business inventory to better manage cashflow causes upstream supply chains to suffer faster falling sales. Tight monetary policy effects on interest rates has made property less affordable causing a slow-down in construction activity (i.e., new builds), home improvement (i.e., alterations & additions) and home furnishings which causes knock on effects to employment & business investment decisions.
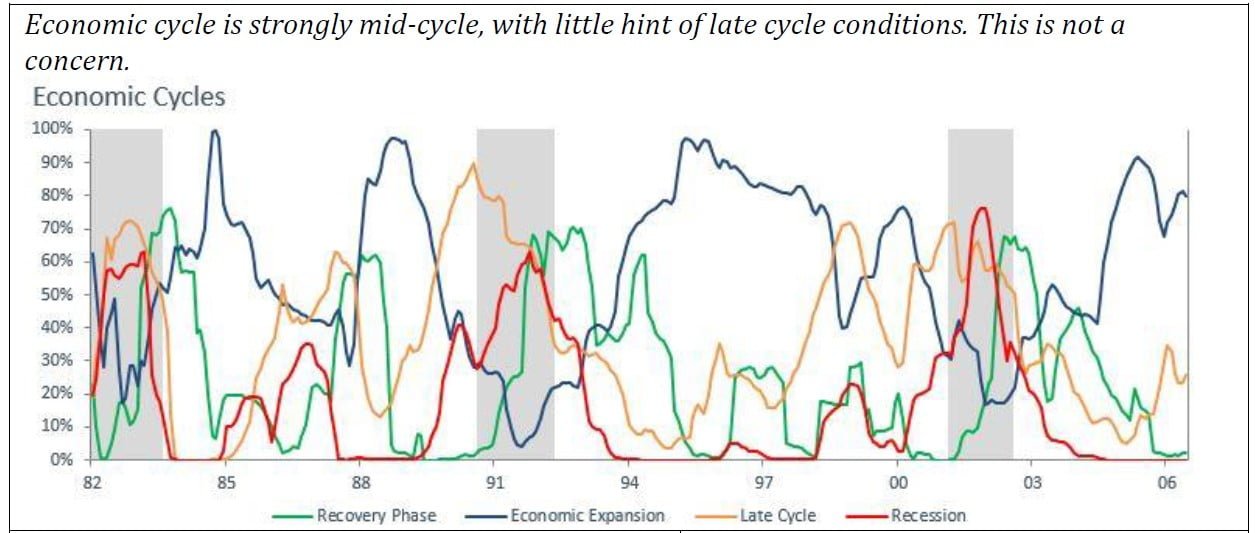
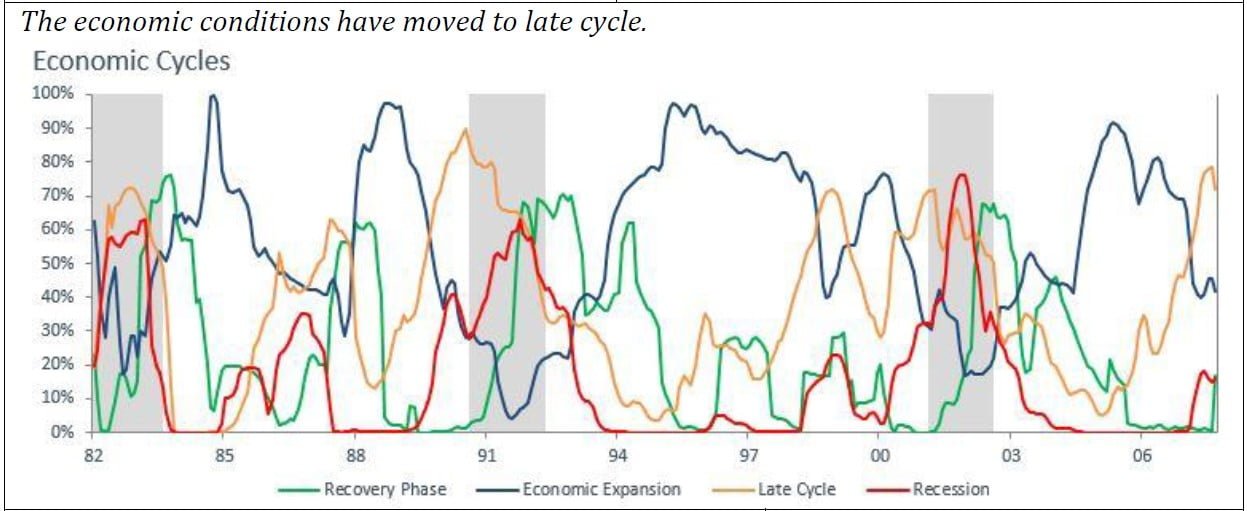
Our work identifies and measures economic factors based on the characteristics of each of these phases, to measure the strength of each cycle phase at the current time, giving us a picture of where we are in the current cycle.
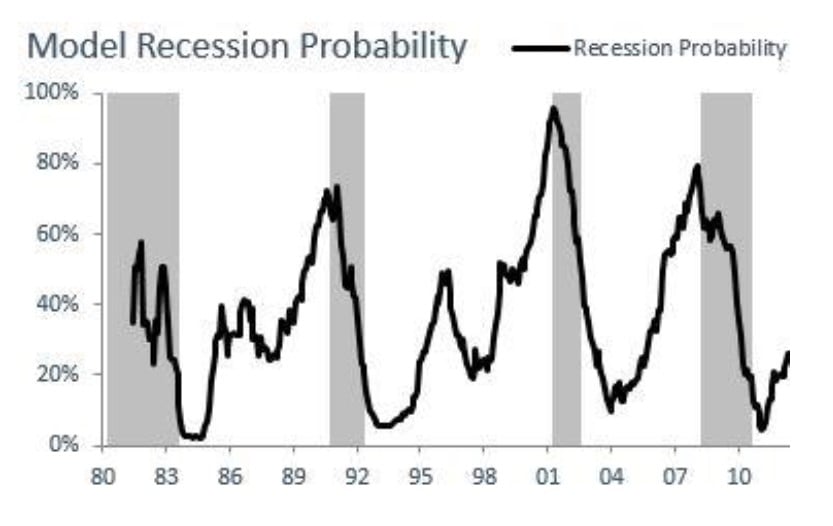
Applying a Recession Probability Model
Whilst the Economic Cycle model is extremely useful in its application, for the specific purpose of assessing the risk of moving from the Late-cycle stage to the Recession stage, a Recession Probability model is best deployed. This is because there have been various points in history whereby after establishing Late-cycle conditions, the economy has managed to revert back to Economic-expansion conditions, thus sustaining the cycle in length for a number of years, before returning to Late-cycle and ultimately Recession. This can be seen around 1988-89 and the year 2000 in the above chart.
Utilising Economic Leading Indicators
The value of utilising multiple tools to make a holistic assessment of current economic risks can be deepened further by the additional utilisation of liquidity based Economic Leading Indicators.
Leading indicators are designed to give insight into the future direction of risk asset prices (i.e., stock market). To be useful, they must firstly make logical sense, and secondly have proven a degree of reliability, historically.
Our top two tools are centered around the teachings of the famous macro hedge fund manager, Stanley Druckenmiller, who was one of the first to define a now widely held belief that whilst earnings move individual stocks, liquidity moves markets.
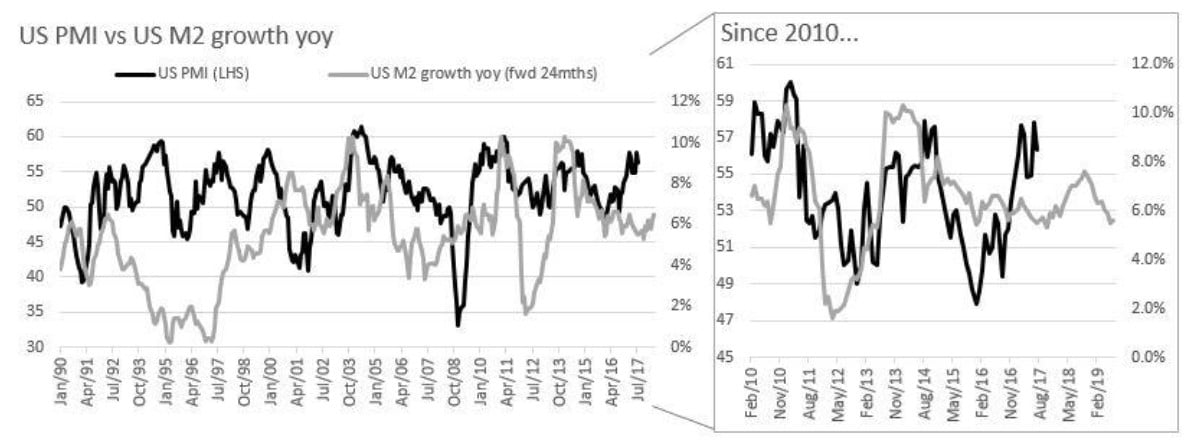
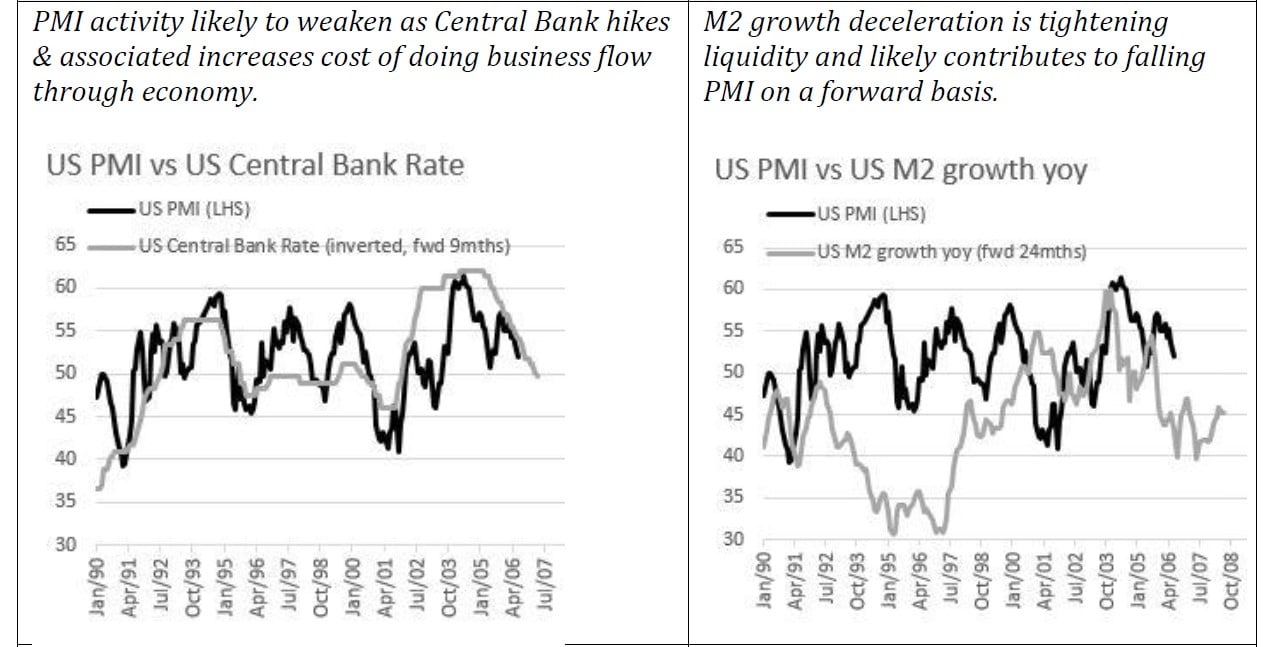
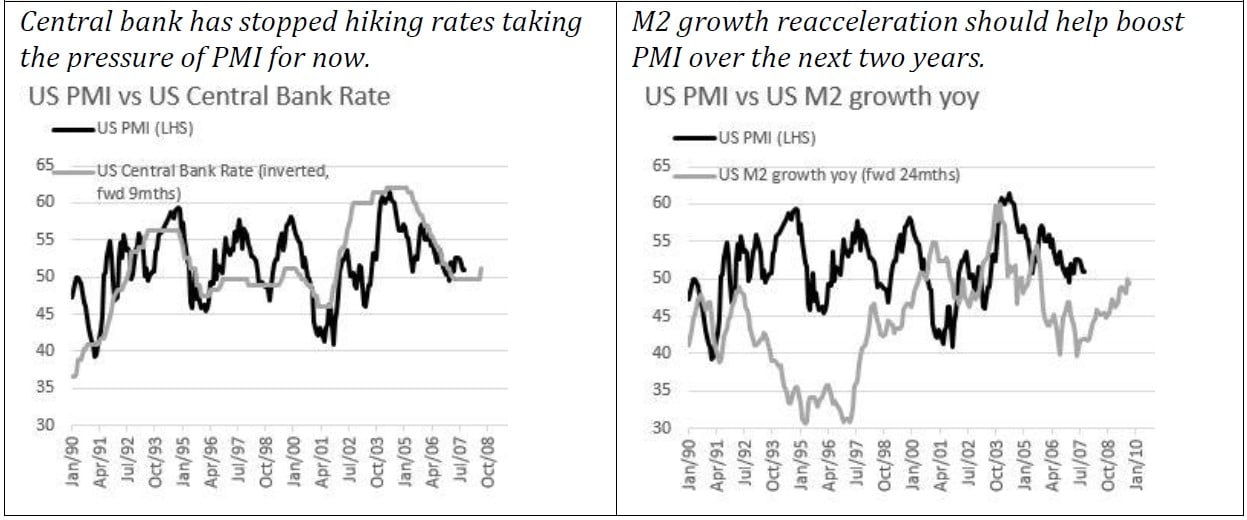
At a macro level "liquidity" is the availability & cost of money and credit, which drives business capital investment decisions, jobs, consumption, and as a result the direction of the economy and markets. Central banks are often central to setting the cost & availability of money & credit, and it is here our economic lead indicators focus: central bank policy & money growth. It can be seen in the charts below that the changing direction of the Fed Funds rate and money growth (M2) tends to lead movements in economic strength, as measured by the Purchasing Managers Index (PMI). Note that we focus on the PMI as it is a real-time indicator of economic strength, and thus moves in coincident fashion with the stock market.
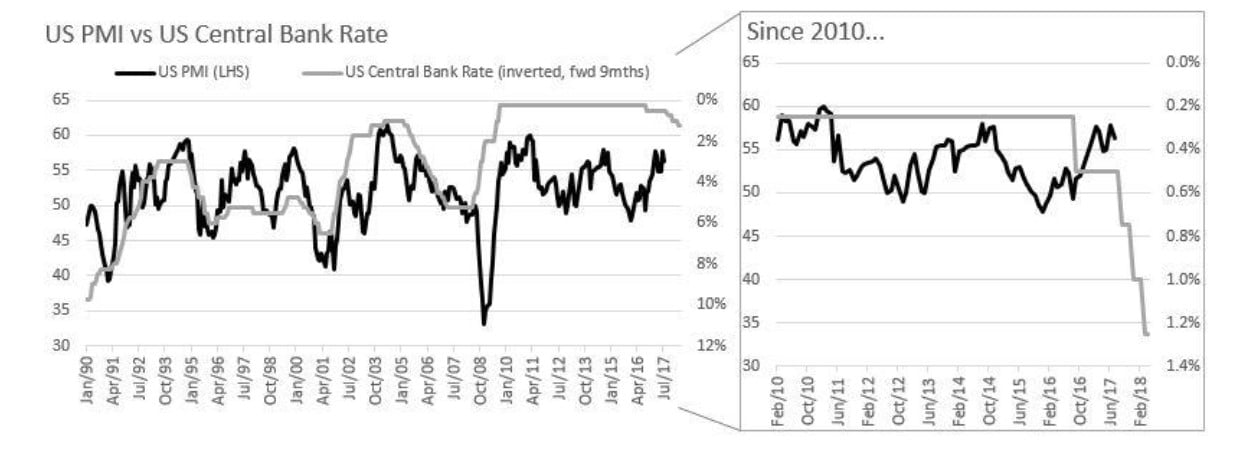
These tools are certainly not perfect leading indicators (if they were, we probably would not share them). There is no such thing. However, consider the logic, for example of why the Central Bank rate leads the PMI. As central bank rates fall:
- The cost of interest falls and those consumers who don't have fixed rate debt benefit from increased discretionary income;
- Home buyers now have more affordable access to new mortgages, increasing demand for housing. This kickstarts the construction, renovation & home furnishings cycle;
- Businesses can now access debt for investment purposes at more competitive rates, encouraging new investment plans & driving new jobs in the economy.
Evidently, there is a time lag between when the central bank rates are initially cut, or hiked, and the flow on effect through the rest of the economy. This is not to say, however, that the PMI cannot continue to accelerate in spite of aggressively hiking Central Bank rates. If economic strength is powerful enough, then it may take time before the Central Bank rate hikes puts pressure on and weakens the economy. This is why no one individual tool should be overemphasized, and instead, a range of proven & powerful tools should be followed by the investor, with the aim to keep an eye on the holistic view of what the tools are saying.
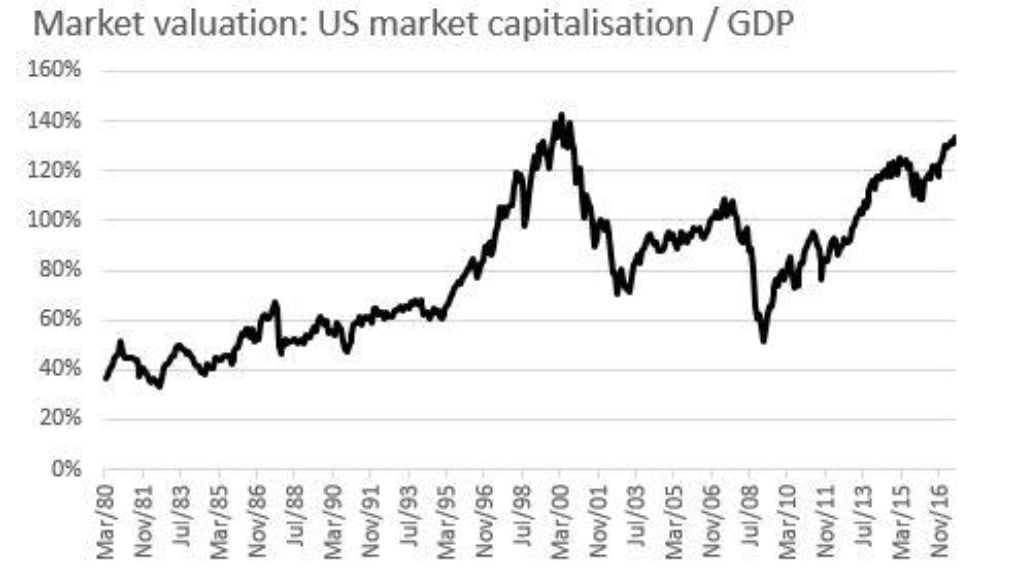
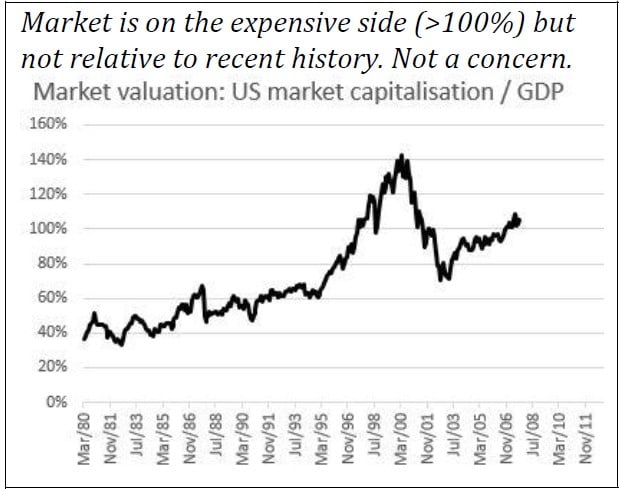
Market Valuation
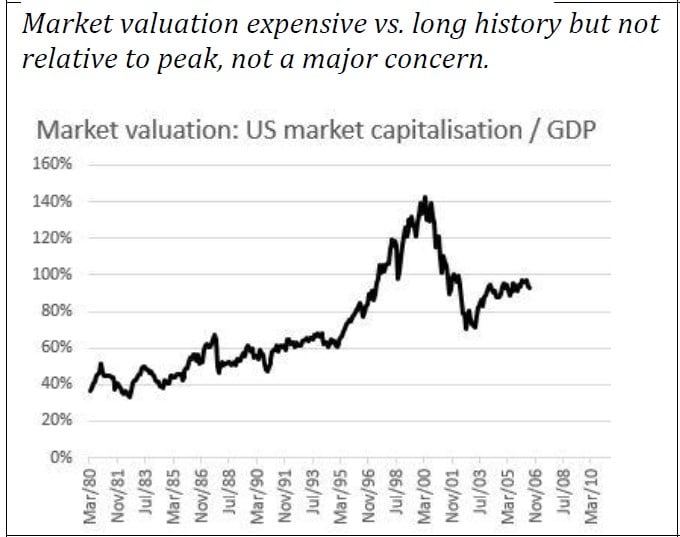
The market valuation tells us the risk/reward (i.e,. how far the market can move in either direction), when the economic cycle turns. This valuation metric was made famous by Warren Buffett in 2001. It's simple in use as it allows a look at how the aggregate stock market in the US is priced vs. the GDP of the US and we can make broad observations about whether or not the market is cheap. This is not used as a timing tool, but it does indicate how far the market can move downward should we have a recession, or upward when the market recovers. (Note the US capitalization in the below chart is the Wilshire 5000 Total Market Index).
Risk Management Via Breadth of Market Movements
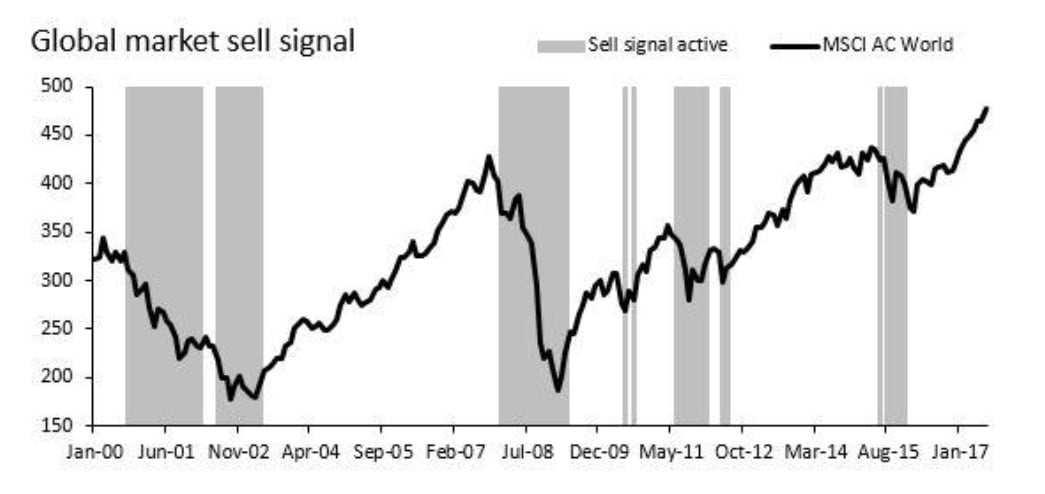
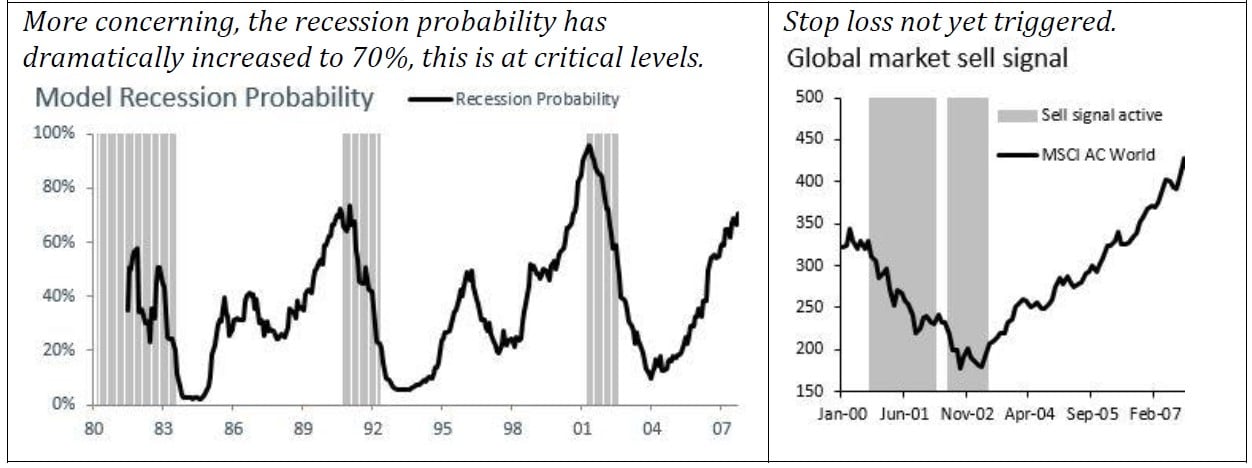
Finally, it is often useful to have a stop loss failing all else. There are times when economic/geopolitical shocks can disrupt markets and recessions can occur without the normal necessary economic conditions. For this purpose, we rely on our diffusion index of global stock markets which measures the breadth and unison of global market movements. Specifically, when there are more global stock markets that are below their one year moving average than above, the breadth and unison of decline is significant and the sell signal is triggered. Historically, this has allowed the investor to capture the majority of bull markets whilst avoiding the majority of bear markets. In the below chart, the gray areas indicate when the sell signal was activate.
How to Build the Holistic Picture
When our leading economic indicators are pointing negative, Recession Model is pointing to high risk, our Economic Cycle Model is telling us we are currently late cycle and the market valuation is expensive, then we are progressively reducing risk prior to the last piece of our puzzle which is to wait for our market breadth indicator to confirm our negative views before aggressively moving our investments to cash. This is best looked at via historic example.
Pulling the Tools Together in Practice - A June 2006, and September 2007 Example Looking at Central Bank Rates
The below two pieces of analysis are examples of the tools in application in June 2006 and September 2007.
June 2006 Update Summary: Stay invested. We are currently mid-cycle, with moderate but not high risk of recession. The points of caution to focus on are the rising Central Bank rates and declining M2 money growth which appear to imply tighter liquidity conditions ahead which could slow economic activity.
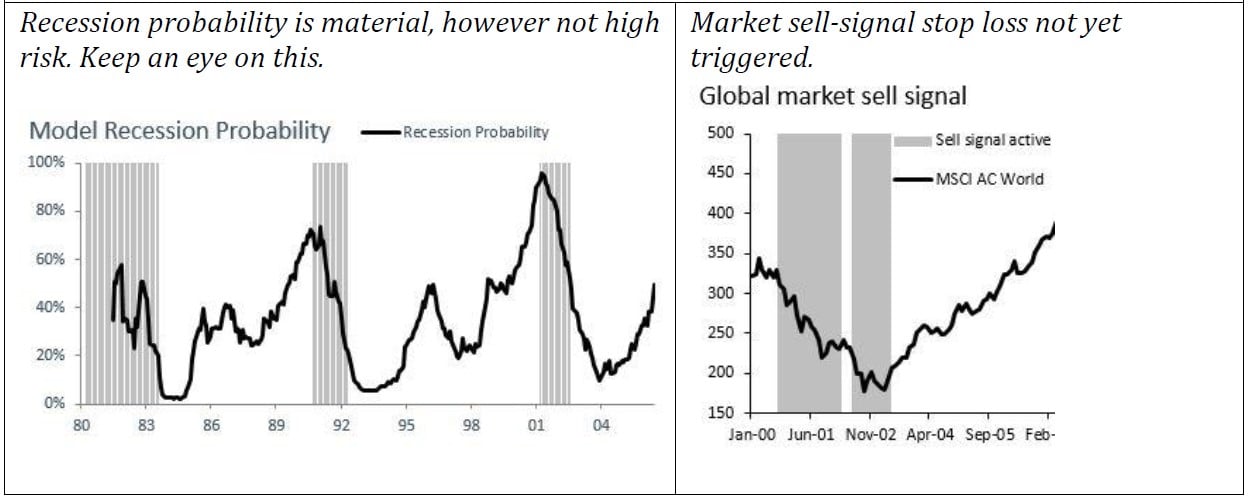
September 2007 Update Summary: Reduce risk exposure. Economic activity has weakened as previous lead indicators had anticipated, but whilst the pressure is off from a liquidity leading indicator perspective (for now), we are now in the Late Cycle phase of the economy and the recession probability has risen materially, enough to warrant rapid de-risking of the portfolio. The stop-loss has not yet been triggered, but if this was to be confirmed whilst the current economy recession risks persist, then a complete de-risking of the portfolio is recommended.
Conclusion
No tool is valuable in isolation, however, using a number of tools to triangulate views on the economic cycle and markets allow for increased odds of avoiding losses, or even making money shorting, in a recession. The key is to watch for breadth of indications across multiple tools, as opposed to just one.
Readers can subscribe to many tools for free on our website, www.recessionprotect.com
Get a full $299 subscription one year subscription at RecessionProtect.com for FREE!! ValueWalk readers only - use valuewalk100 code at checkout - no credit card info needed.
Article by RecessionProtect.com


