On The Origins Of Long-term Capital Losses And Gains: A Graham & Doddsville Perspective On Risk And Investing
Steven Klerck
KU Leuven
Abstract
For many individual investors and families, independent of their absolute wealth, experiencing a permanent or long-term capital loss poses the highest risk. We define a long-term capital loss/gain as a real capital loss/gain over a ten-year investment horizon. Based on our long-term investment horizon, applied to a dataset spanning more than 130 years, we are able to crystallize the key to highly persistent long-term wealth protection and wealth accumulation. A picture emerges that closely aligns with the investment philosophy and the investment principles of Graham and Doddsville (Buffett, 1984). In particular we find that the highest long-term capital losses reside within equity portfolios with the highest valuation risk (i.e. growth portfolios) and the highest distress risk, i.e. investment portfolios with the smallest margin of safety. Investors in high valuation-risk and high distress-risk portfolios experienced real losses of up to -72% over a ten-year investment horizon. A low valuation risk and a medium/low distress risk are on the other hand key fundamental characteristics in avoiding long-term capital losses and, as a consequence, consistently realizing real long-term capital gains. Our findings and conclusions can be incorporated by wealth managers and financial advisors in drafting fundamentals-based risk profiles and investment programs in collaboration with their clients.
“Confronted with a like challenge to distill the secret of sound investment into three words, we venture the motto, MARGIN OF SAFETY.
“It is our thesis that a properly executed group investment in common stocks does not carry any substantial risk of this sort and that therefore it should not be termed risky merely because of the element of price fluctuation.
“In a well-defined bear market many sound common stocks sell temporarily at extraordinarily low prices. It is possible that the investor may then have a paper loss of fully 50 per cent on some of his holdings, without any convincing indication that the underlying values have been permanently affected.1
1. Introduction
According to academics and well-known investors such as Graham and Dodd (1934), Graham (1949), Seth Klarman (1991), Warren Buffett (Cunningham, 2000) and James Montier (2009), among others, investment risk equates with a permanent or long-term capital loss. Graham (1949) argues that there are two main causes to permanent or long-term capital losses: the purchase of low quality securities (i.e. high distress risk) and/or the purchase of companies far above the tangible value (i.e. high valuation risk). In this paper we subject his thesis to an empirical analysis in four regions (US, Europe, Japan and Asia Pacific) and the global equity market. A long-term capital loss is defined as a real capital loss over a ten-year investment horizon. Valuation risk is captured by the market-to-book ratio. Distress risk is assessed by a company’s solvency, liquidity and profitability. Solvency is captured by total equity to total assets. Liquidity is measured by cash and short-term investments to total assets. Operating income to total assets measures profitability.2
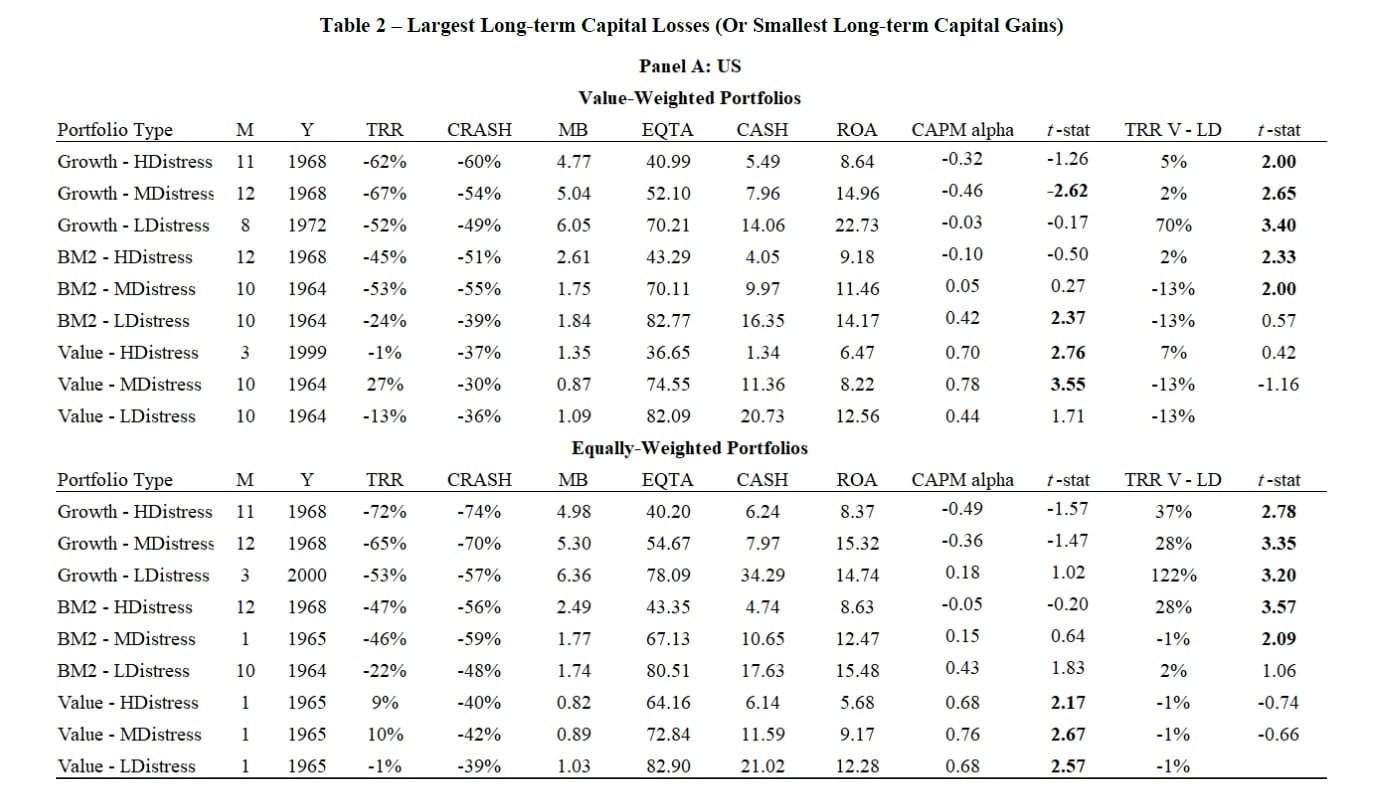
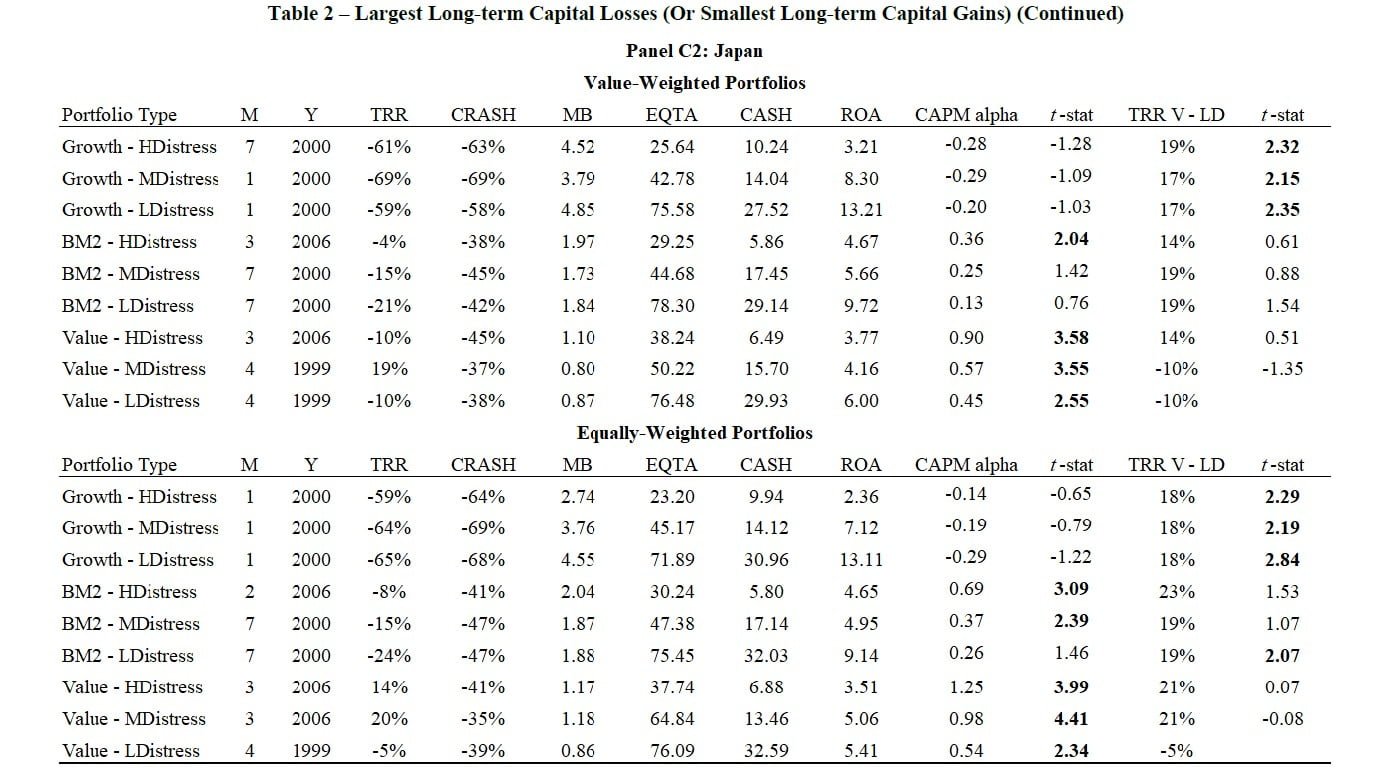
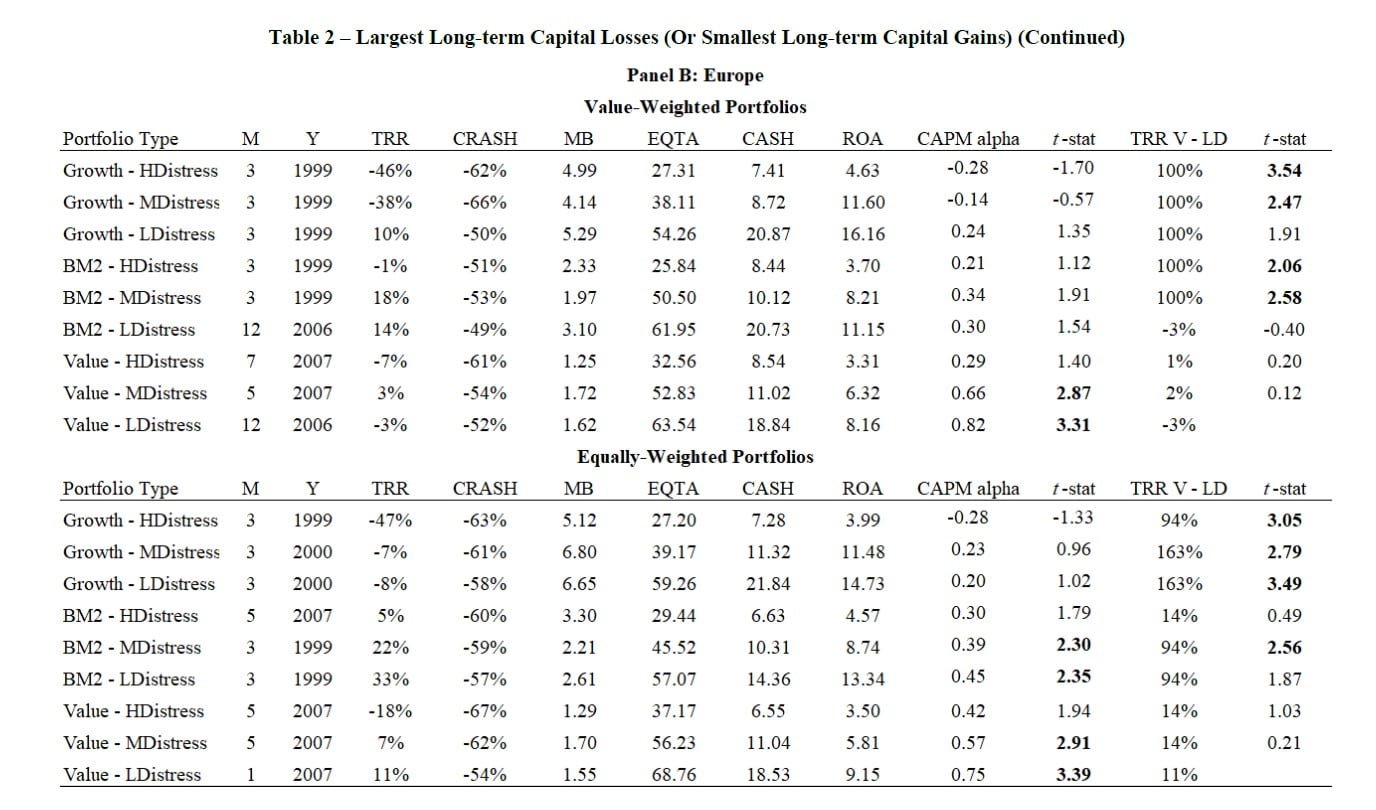
The results of the empirical analyses and corresponding implications for investors can be summarized in three conclusions. First, consistent with the investment insights by Graham (1949) we find that the largest real long-term capital losses are concentrated in growth portfolios. High distress growth investors have been confronted with real capital losses of up to -72% over a ten-year investment horizon. For low distress growth investors we document real capital losses of up to -65%. Investors with a focus on margin-of-safety companies, i.e. low valuation risk and low distress risk companies, have on the other hand been able to avoid economically significant losses in purchasing power over ten-year investment horizons. Secondly, a focus on low valuation risk and low distress risk companies does not imply protection against economically significant short-term losses, short-term volatility and/or short-term underperformance. All worst-case fundamentals-based portfolios have been confronted with short-term crashes of -50% and more. Furthermore all valuation-based and distress-based portfolios have suffered significant short-term underperformance during multiple consecutive years, both between and within style portfolios. Thirdly, these findings have important implications for investors’ proper attitudes towards stock market fluctuations and investment programs, implications that a) have already been set forth by Graham (1949) in The Intelligent Investor in general and in the chapter The Investor And Stock Market Fluctuations in particular, and b) are apparently still unknown to many (retail) investors anno 2019. We will elaborate on these implications in Section 6.
The remainder of the paper is structured as follows. In Section 2, we provide an insight in the concept of risk from a Graham and Doddsville perspective (Buffett, 1984). In the days of the old finance academics and a subset of investors held a completely different view on the notion of risk compared with the modern creed in academia. Section 3 contains the sample description, variable measurement and the portfolio characteristics. In Section 4, for the four regions and the global stock market, we document the largest long-term capital losses in real terms over ten-year investment horizons for the valuation-based and distress-based portfolios. By documenting ten-year total real returns per decade Section 5 provides an additional perspective on the historical potential of the fundamentals-based portfolios in consistently realizing real long-term capital gains. An overview, conclusions and implications for investors can be found in Section 6.
2. Risk From A Graham And Doddsville Perspective
Avoiding permanent or long-term capital losses takes center stage in the investment philosophy of Graham and Doddsville. In this regard academics (Graham and Dodd, 1934; Graham, 1949) distinguish between an investment operation and a speculative operation. An investment operation is one which, upon thorough analysis, promises safety of principal and a satisfactory return. Operations not meeting these requirements are speculative. An investment operation requires a margin of safety, which is the central concept of investment or the secret of sound investment. A margin of safety is present when quality securities are bought at reasonable or low valuations. The safety of principal is, on the other hand, at risk in absence of a margin of safety, i.e. in case low-quality securities are bought at high valuations.3 Short-term price fluctuations however are not a relevant dimension of risk for an investor. It is our thesis that a properly executed group investment in common stocks does not carry any substantial risk of this sort and that therefore it should not be termed risky merely because of the element of price fluctuation.4 As a consequence, according to the school of Colombia permanent or long-term capital losses can be avoided and consistently long-term capital gains can be realized by a persistent focus on quality securities bought at reasonable or low valuations. In the next sections we subject this thesis to an empirical analysis in four regions (US, Europe, Japan and Asia Pacific) and a global equity portfolio spanning more than 130 years of data.
3. Sample Description, Variable Measurement And Portfolio Characteristics
3.1 Sample Description And Variable Measurement
Accounting data for the US stock market are obtained from the Compustat annual database over the 1962-2016 period. Only companies with fiscal year-end on or before 12/31/t are included in the analysis. Market data are obtained from the CRSP monthly and daily stock returns files over the 1963-2018 period. We include all domestic stocks listed on NYSE, AMEX and Nasdaq with CRSP share code of 10 or 11 (i.e. we exclude closed-end funds, REITs, ADRs and foreign stocks). Financial firms – firms with a one-digit standard industry classification code of six – are deleted. We eliminate stocks with prices less than $1 at the time of portfolio formation (Chordia et al., 2014). Micro stocks and small stocks, defined as stocks with a market capitalization below the 20th percentile of NYSE stocks at the end of June each year, are removed from the US dataset. At the end of June 2017 firms with a market capitalization below $852 million are, as a consequence, kept apart from the dataset. Valuation risk is captured by the market-to-book ratio. Book equity is computed as in Fama and French (2008). Companies with a negative book value are kept apart from the analysis (Fama and French, 2008). The market-to-book ratio is computed using book values at the end of December of the previous fiscal year and market values at the end of June each year (Asness and Frazzini, 2013). Distress risk is assessed by three basic financial ratios: solvency (denoted EQTA) is measured by total equity to total assets (AT), liquidity (denoted CASH) by cash & short-term investments (CHE) to total assets (AT) and profitability (denoted ROA) by operating income after depreciation (OIADP) to total assets (AT).5 The financial ratios are winsorized annually at 1% and 99% of their respective distributions.
The international (i.e. Europe, Japan and Asia Pacific) accounting and stock market data are from Thomson Reuters Datastream. For Europe we include the following countries: Austria, Belgium, Denmark, Finland, France, Germany, Greece, Ireland, Italy, the Netherlands, Norway, Portugal, Spain, Sweden, Switzerland and the United Kingdom. The Asia Pacific dataset includes Australia, Hong Kong, New Zealand, Singapore, South Korea and Taiwan. For Europe and Japan the sample period is 1989-2018. For Asia Pacific we focus on the 1997-2018 period. Both active and delisted shares are included. In line with the methodology for the US dataset we delete financial firms. We remove micro stocks and small stocks, defined as stocks with a market capitalization below the 75th percentile of all stocks in the region.6 For Europe, Japan and Asia Pacific the 75th percentiles of market capitalizations are $914 million, $561 million and $225 million respectively at the end of June 2017. The book-to-market ratio is computed as in Annaert et al. (2013). Companies with a negative book value are removed from the dataset. The solvency ratio (EQTA) is measured by total equity (Worldscope item WC03501) to total assets (Worldscope item WC02999), liquidity (CASH) by cash & short-term investments (Worldscope item WC02999) to total assets and profitability (ROA) by operating income (Worldscope item WC01250) to total assets. We apply the same winsorizing rules as for the US dataset.
Monthly value-weighted and equally-weighted buy-and-hold portfolio returns are computed from the end of June in year t+1 until the end of June in year t+2. All our portfolio returns are in US dollar. Ten-year total returns are inflation-adjusted using the Consumer Price Index data available on Robert Shiller’s website. Stock portfolios are rebalanced annually. Value-weighted portfolios can be dominated by a few large stocks, resulting in an unrepresentative picture of the historical portfolio returns (Fama and French, 2008). As a consequence, and consistent with the constraints imposed upon professional investors, we set the maximum weight assigned to one company in the value-weighted portfolios to 10%. As part of the US dataset, for delisted firms the remaining return is calculated by applying CRSP’s delisting return (Beaver et al., 2007). If no delisting return is available, we denote the delisting return as equal to the average delisting return of the corresponding CRSP one-digit delisting code over the 1960-2018 period. Proceeds from delisted companies are reinvested in the corresponding portfolio for the remainder of the year. The global portfolio returns are computed by weighting the regional portfolio returns with their respective relative total market capitalization. At the end of June 2017 the weights of the US, Europe
Read the full article here by Steven Klerck, SSRN


